
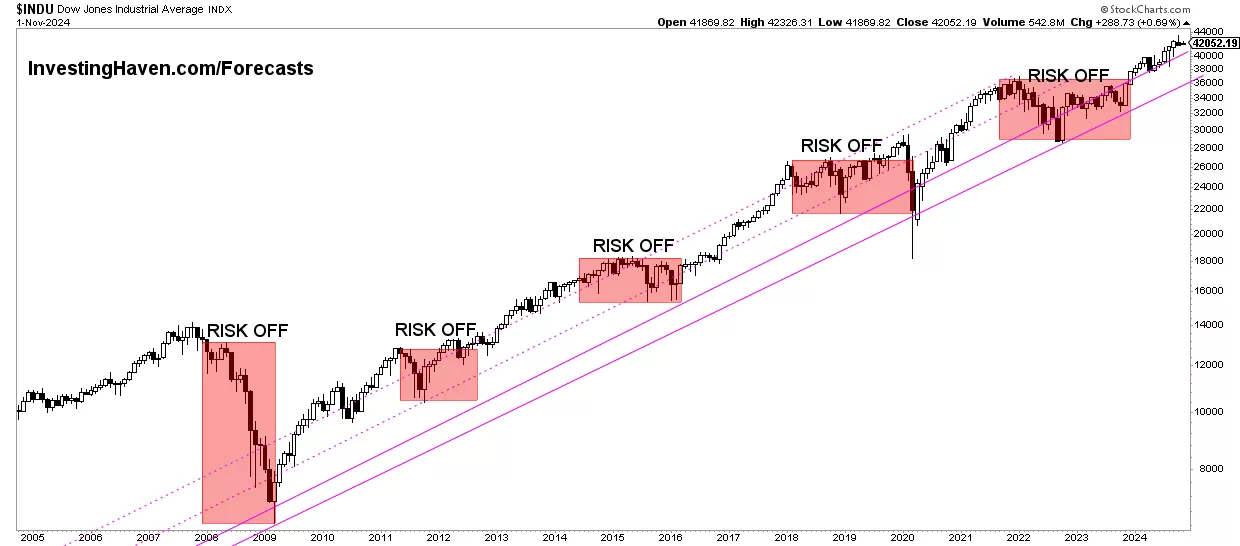
The Dow Jones Industrial Average (DJIA) stands as the most iconic barometer of the American stock market. For over a century, investors, policymakers, and the general public have looked to “the Dow” as a shorthand for the health of the U.S. economy. When the index reaches a new all-time high, it captures headlines and fuels discussions about wealth creation, inflation, and the future of capitalism. As of mid-2024, the Dow Jones Industrial Average has crossed the monumental 40,000 threshold, marking a historic peak that reflects a complex interplay of corporate resilience, monetary policy, and technological evolution.

Understanding the “highest” Dow average requires more than just looking at a single number. It involves analyzing the journey the index took to get there, the components that drove the surge, and what these record-breaking levels mean for the average investor’s portfolio. In a financial landscape characterized by rapid shifts, reaching an all-time high is both a celebration of past growth and a catalyst for strategic reassessment.
Historical Milestones: The Dow’s Journey to New Heights
The history of the Dow Jones Industrial Average is a chronicle of the American industrial and digital revolutions. Founded in 1896 by Charles Dow and Edward Jones, the index originally consisted of just 12 companies, primarily in the heavy industry sector—sugar, oil, rubber, and coal. At its inception, the index was valued at 40.94. To reach the 40,000 mark, the index had to survive the Great Depression, two World Wars, the stagflation of the 1970s, the Dot-com bubble, and the Great Recession of 2008.
The Path to 10,000 and 20,000
The Dow first crossed the 10,000 mark in March 1999, during the height of the internet boom. It took nearly 103 years to reach that first five-figure milestone. However, the pace of growth accelerated as the global economy became more interconnected and digitized. Despite the setbacks of the early 2000s, the index reached 20,000 in early 2017. This doubling in less than 20 years highlighted the increasing efficiency of corporate earnings and the massive influx of capital into equity markets.
The Pandemic Recovery and the 30,000 Mark
The journey from 20,000 to 30,000 was marked by unprecedented volatility. In early 2020, the COVID-19 pandemic caused one of the swiftest market crashes in history. Yet, the recovery was equally rapid. Fueled by massive government stimulus and near-zero interest rates from the Federal Reserve, the Dow surged past 30,000 in November 2020. This milestone was significant because it occurred during a period of global economic uncertainty, proving that the stock market often acts as a forward-looking mechanism, pricing in future recoveries long before they are felt on the ground.
Reaching the 40,000 Summit
In May 2024, the Dow Jones Industrial Average eclipsed 40,000 for the first time. This peak was driven by a unique combination of factors: cooling inflation data, a robust labor market, and the explosive growth of Artificial Intelligence (AI) which boosted several of the Dow’s tech-heavy components. While 40,000 is a psychological milestone, it also represents a fundamental reality of the modern economy—top-tier American corporations are generating record profits even in high-interest-rate environments.
Decoding the Numbers: What Drives the Dow to Record Levels?
To understand why the Dow reaches new highs, one must understand how it is calculated. Unlike the S&P 500 or the Nasdaq, which are market-capitalization-weighted indices, the Dow is price-weighted. This means that companies with higher stock prices have a greater influence on the index’s movements than those with lower stock prices, regardless of the company’s actual size.
The Role of Blue-Chip Components
The Dow consists of 30 “blue-chip” stocks, selected by a committee at S&P Dow Jones Indices. These are intended to be leaders in their respective industries with a history of sustained growth. Because the index is price-weighted, moves in high-priced stocks like UnitedHealth Group, Goldman Sachs, or Microsoft have a disproportionate impact on the index hitting a new high. When these titans report strong earnings or optimistic guidance, they provide the “weight” necessary to push the average to record levels.
The Impact of Monetary Policy
Interest rates are the gravity of the financial markets. When the Federal Reserve raises rates to combat inflation, it typically puts downward pressure on stock prices because borrowing becomes more expensive and future cash flows are discounted at a higher rate. Conversely, when the market anticipates a “pivot” toward lower rates, the Dow often rallies. The recent highs have been largely supported by the market’s belief that the central bank has successfully navigated a “soft landing”—taming inflation without triggering a massive recession.
Corporate Earnings and Innovation
Ultimately, the Dow is a reflection of corporate profitability. All-time highs are usually underpinned by strong quarterly earnings reports. In recent years, companies within the Dow have demonstrated remarkable pricing power, allowing them to maintain profit margins despite rising input costs. Furthermore, the integration of technology into traditional sectors—such as healthcare and manufacturing—has led to efficiency gains that translate directly to the bottom line.
The Psychological and Practical Impact of All-Time Highs
When the Dow reaches its highest point, it triggers a variety of psychological responses in the investing public. For some, it is a signal of “irrational exuberance,” leading to fears that a crash is imminent. For others, it is a confirmation of a strong bull market, encouraging further participation.
The Myth of “The Top”
A common mistake among retail investors is the belief that they should stop investing when the market hits an all-time high. However, historical data suggests that markets often hit new highs in clusters. An all-time high is frequently a sign of strong momentum rather than an immediate signal of a reversal. In fact, some of the best historical returns have followed years where the Dow hit multiple record peaks. Waiting for a “pullback” that may not come for months or years can result in significant opportunity costs.
Sentiment and Momentum
The psychological impact of a “big round number” like 40,000 cannot be overstated. These milestones act as magnets for media attention, which in turn brings more retail investors into the market. This influx of capital creates a self-fulfilling prophecy of upward momentum. However, professional investors often use these peaks to rebalance their portfolios, ensuring that their asset allocation hasn’t drifted too far toward equities during the run-up.
Strategic Asset Allocation in a High-Value Market
Navigating a market that is at its highest historical average requires a disciplined approach to personal finance. While it is tempting to chase the “hot” sectors driving the Dow, successful long-term investing relies on diversification and risk management.
The Importance of Rebalancing
When the Dow reaches record levels, the equity portion of an investor’s portfolio often grows faster than the fixed-income or cash portions. This can leave an investor “overweight” in stocks, exposing them to more risk than they originally intended. Rebalancing—selling some winners to buy assets that have underperformed—is a vital strategy for maintaining a target risk profile. It forces the investor to “buy low and sell high,” a fundamental tenet of wealth preservation.
Dollar-Cost Averaging
For those concerned about “buying the top,” dollar-cost averaging (DCA) remains the most effective tool. By investing a fixed amount of money at regular intervals, regardless of whether the Dow is at 30,000 or 40,000, an investor naturally buys more shares when prices are lower and fewer when they are higher. This removes the emotional stress of trying to time the market’s peak.
Looking Beyond the 30 Stocks
While the Dow is a prestigious index, it only represents 30 companies. A truly diversified portfolio should look beyond these industrial giants to include small-cap stocks, international equities, and emerging markets. Often, when the Dow is at an all-time high, other areas of the market may still be undervalued, providing a “margin of safety” for the proactive investor.
Looking Ahead: Can the Dow Sustain Its Upward Trajectory?
The question of whether the Dow will continue to find new “highest” averages depends on several long-term macroeconomic trends. History suggests that the trend of the market is upward over the long term, driven by human innovation and the compounding of capital.
The Productivity Frontier
The next leg of the Dow’s growth will likely be driven by productivity gains from AI and automation. As these technologies move from the “hype” phase to actual implementation across the 30 Dow components, we could see a significant expansion in margins. If a manufacturing giant in the Dow can produce more with less through robotics, or a financial service member can automate risk assessment, the fundamental value of those companies increases, pushing the index higher.

Demographic Shifts and Global Capital
Despite aging populations in some developed nations, the global middle class continues to expand. American companies—the core of the Dow—are global entities that derive a significant portion of their revenue from overseas. As long as American brands and technologies remain the gold standard globally, the Dow is likely to continue its ascent, albeit with the inevitable periods of correction and consolidation.
In conclusion, the highest Dow Jones average is a moving target—a snapshot of a specific moment in economic history. While the 40,000 milestone is a testament to the growth of the American economy, it is also a reminder that the market is a dynamic entity. For the savvy investor, the peak is not a place to fear, but a data point to be analyzed within a broader strategy of consistent, disciplined wealth building. The Dow’s highest points are merely basecamps for the next climb in the long-term journey of global commerce.
aViewFromTheCave is a participant in the Amazon Services LLC Associates Program, an affiliate advertising program designed to provide a means for sites to earn advertising fees by advertising and linking to Amazon.com. Amazon, the Amazon logo, AmazonSupply, and the AmazonSupply logo are trademarks of Amazon.com, Inc. or its affiliates. As an Amazon Associate we earn affiliate commissions from qualifying purchases.