
To understand the modern financial landscape, one must look back to the late 19th century, a period of rapid industrialization, speculative fervor, and the birth of financial journalism. The Dow Jones Industrial Average (DJIA), often referred to simply as “the Dow,” is the oldest continuing stock market index in the world. It serves as a heartbeat for the American economy, a three-digit or five-digit number that summarizes the collective health of the U.S. corporate giants. But when did it start, and why was it created in the first place?
The Dow Jones Industrial Average officially debuted on May 26, 1896. However, its story begins much earlier, rooted in the partnership of three men who sought to bring transparency and data to a stock market that was, at the time, largely seen as a playground for speculators and insiders.
The Founders and the Birth of a Financial Institution (1882–1896)
The journey toward the first industrial average began in 1882 when Charles Dow, Edward Jones, and Charles Bergstresser founded Dow, Jones & Company. At the time, the American financial markets were chaotic. Information was a commodity traded in whispers, and there was no centralized way for an average investor to know whether the market was trending up or down.
Charles Dow was a journalist with a keen interest in the underlying mechanics of business. Edward Jones was a statistician capable of processing vast amounts of data with precision. Together, they began delivering hand-delivered news bulletins to traders in the Wall Street area. These bulletins eventually evolved into the Customer’s Afternoon Letter, the precursor to The Wall Street Journal.
The 1884 Transportation Average
Before the famous Industrial Average was born, Charles Dow created his first index in 1884. This index consisted of eleven companies: nine railroads and two steamship companies. In the late 19th century, railroads were the backbone of the American economy, representing the primary mode of commerce and expansion. This initial index is known today as the Dow Jones Transportation Average. While it served its purpose, Dow realized that the U.S. economy was shifting. Manufacturing and industrial production were becoming just as vital as the rails that carried the goods.
May 26, 1896: The First Industrial Average
On a Tuesday in late May 1896, Charles Dow published the first Dow Jones Industrial Average. Unlike the transportation index, this new benchmark focused on the “smokestack” companies—the industrial giants of the era. On its first day, the Dow stood at a mere 40.94 points. It was calculated by simply adding up the stock prices of its 12 constituent companies and dividing the total by 12.
The Original Twelve: The Engine of Late 19th-Century America
To look at the original twelve companies of the Dow is to take a snapshot of the American economy at the turn of the century. These were companies involved in cotton, sugar, tobacco, gas, and rubber. They represented the raw materials and energy that fueled a developing nation.
The original constituents were:
-
American Cotton Oil: Used in food production and soap.
-
American Sugar: The dominant force in the sugar refining industry.
-
American Tobacco: A massive monopoly in the tobacco trade.
-
Chicago Gas: A utility provider for the burgeoning Midwest.
-
Distilling & Cattle Feeding: Involved in the production of spirits and industrial alcohol.
-
General Electric: The only original member that survived in the index for over a century (though it was eventually removed in 2018).
-
Laclede Gas: A utility company serving St. Louis.
-
National Lead: A major producer of lead-based paints and materials.
-
North American Company: A utility holding company.
-
Tennessee Coal, Iron and Railroad Company: A major steel producer later acquired by U.S. Steel.
-
U.S. Leather: At the time, leather was an essential industrial material for belts and machinery.
-
United States Rubber: A pioneer in rubber manufacturing.
The Survival of General Electric
For decades, General Electric (GE) was the symbol of the Dow’s stability. It was an original member, though it was removed and reinstated a few times in the very early years. GE’s presence for 111 consecutive years (from 1907 to 2018) highlighted the transition from the industrial age to the digital and service-based economy. Its eventual removal signaled a new era where technology and healthcare would take center stage over traditional heavy manufacturing.
Understanding the Math: How the Dow Moves
One of the most unique—and often criticized—aspects of the Dow Jones Industrial Average is its methodology. Unlike the S&P 500 or the Nasdaq Composite, which are market-capitalization-weighted, the Dow is a price-weighted index.

Price Weighting vs. Market Cap Weighting
In a price-weighted index, companies with higher stock prices have a greater influence on the index’s movement than companies with lower stock prices, regardless of the company’s actual size or total valuation. For example, a $1 move in a $200 stock has the same impact on the Dow as a $1 move in a $20 stock, even though the $1 move represents a much smaller percentage change for the higher-priced stock.
The Dow Divisor
In 1896, the math was simple: add 12 prices and divide by 12. However, as companies underwent stock splits, merged, or were replaced, a simple arithmetic mean no longer worked. If a stock in the index split 2-for-1, its price would drop by half, which would cause the index to “drop” even if no value was actually lost.
To solve this, the “Dow Divisor” was created. The divisor is a constantly adjusted numerical value used to maintain the continuity of the index. When a corporate action like a stock split occurs, the divisor is adjusted so that the index value remains the same before and after the event. Today, the divisor is a tiny fraction (much less than one), meaning that a one-point move in any single stock’s price actually translates to a many-point move in the Dow index itself.
Historical Milestones and Market Cycles
Since its inception at 40.94 points, the Dow has acted as the primary narrator for the story of American capitalism. Its fluctuations have marked the heights of prosperity and the depths of economic despair.
The Great Depression and the 1929 Crash
The most infamous period in the Dow’s history occurred in the late 1920s. After peaking at 381.17 in September 1929, the index plummeted during the “Black Tuesday” crash. By July 1932, the Dow hit a closing low of 41.22—essentially returning to its starting value from 1896. This wiped out decades of gains and necessitated the financial regulations that govern Wall Street today.
The Post-War Boom and the 1,000-Point Mark
The Dow did not reclaim its 1929 peak until 1954. However, the subsequent decades saw unprecedented growth. On November 14, 1972, the Dow closed above 1,000 for the first time. It took another 15 years to reach 2,000, but as the pace of technology and globalization accelerated, the milestones began to fall more rapidly.
The Modern Era: 10,000 to 30,000 and Beyond
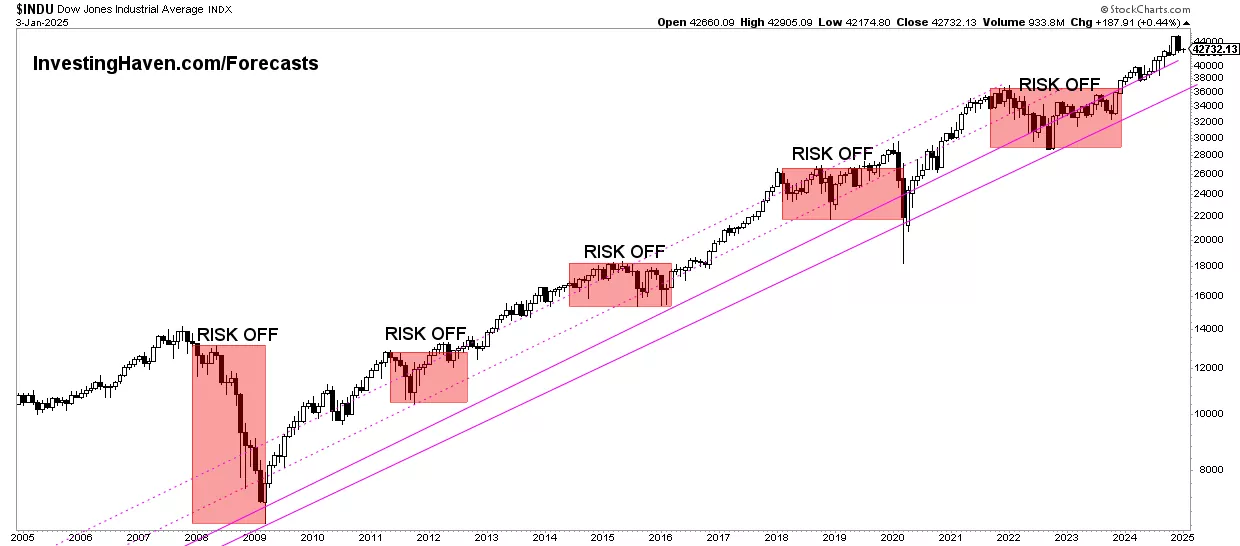
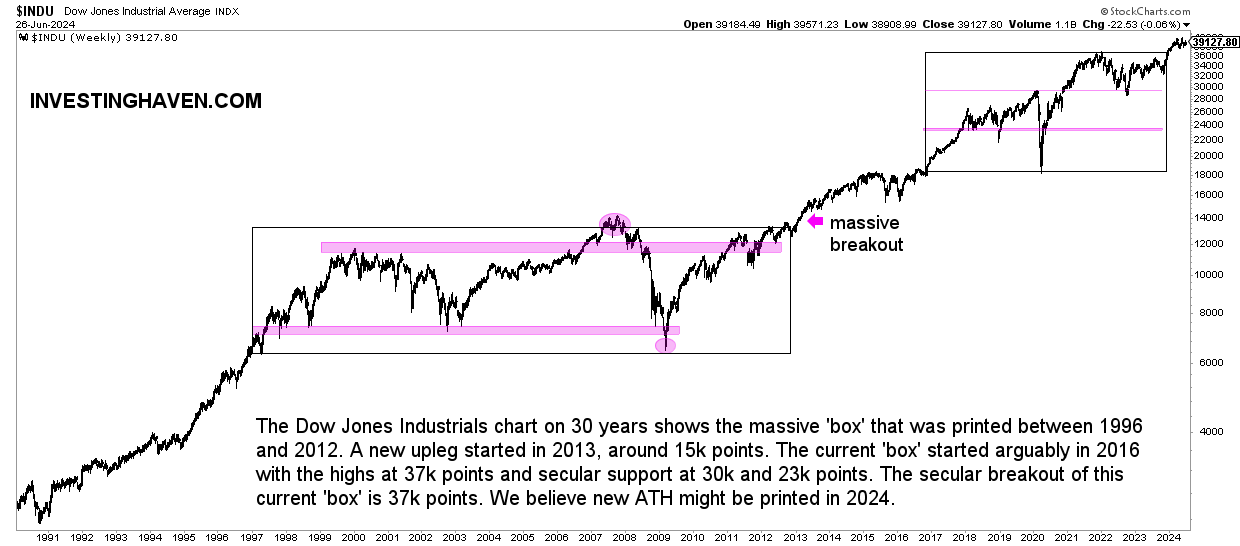
The 1990s dot-com boom pushed the Dow past 10,000 in 1999. Despite the setbacks of the 2008 Great Recession, the index proved resilient. The 20,000 mark was breached in early 2017, and the 30,000 mark was surpassed in late 2020. These numbers represent more than just growth; they reflect the compounding power of the American corporate sector over more than a century.
The Dow in the 21st Century: Evolution and Critique
As the economy has evolved from manufacturing to services and technology, the Dow has had to change its “membership” to remain relevant. In 1928, the index expanded from 20 to 30 stocks, a number that remains the standard today.
Shifting Sectors
The modern Dow is no longer purely “industrial.” It includes tech giants like Apple and Microsoft, financial powerhouses like Goldman Sachs and JPMorgan Chase, and consumer leaders like Coca-Cola and Walmart. The selection process is not based on a rigid formula but is managed by a committee at S&P Dow Jones Indices. They look for companies with an excellent reputation, sustained growth, and interest among a broad range of investors.
Criticisms of the Index
Despite its fame, the Dow faces criticism from the modern financial community. Many professional investors prefer the S&P 500 because it includes more companies (500 vs. 30) and uses market-cap weighting, which they argue is a more accurate reflection of market value. Critics also point out that the Dow’s 30-stock limit is too narrow to capture the complexity of the total market.
However, the Dow persists for a reason. Its long history provides a unique longitudinal data set that no other index can match. It is the most recognized financial brand in the world. When the evening news reports that “the market was up today,” they are almost always referring to the Dow Jones Industrial Average.
Conclusion: A Legacy of Transparency
When Charles Dow and Edward Jones started their index in 1896, they couldn’t have imagined a world of high-frequency trading, digital currencies, or globalized supply chains. Yet, their fundamental goal remains intact: to provide a simple, reliable benchmark for the health of the economy. From its humble beginnings with 12 industrial stocks to its current status as a global financial barometer, the Dow Jones Industrial Average remains the definitive timeline of American enterprise. For the personal investor and the corporate strategist alike, understanding where the Dow started is essential to understanding where the markets are going.
aViewFromTheCave is a participant in the Amazon Services LLC Associates Program, an affiliate advertising program designed to provide a means for sites to earn advertising fees by advertising and linking to Amazon.com. Amazon, the Amazon logo, AmazonSupply, and the AmazonSupply logo are trademarks of Amazon.com, Inc. or its affiliates. As an Amazon Associate we earn affiliate commissions from qualifying purchases.