
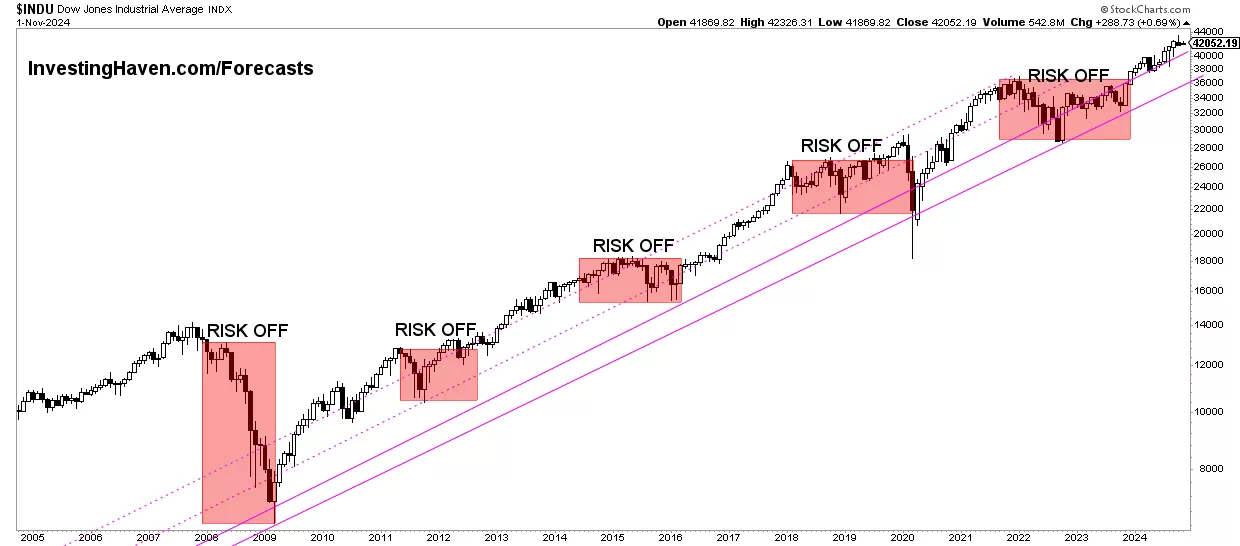
The Dow Jones Industrial Average (DJIA) has long served as the primary pulse of the American stock market. For over a century, investors, economists, and the general public have looked to this price-weighted index of 30 prominent “blue-chip” companies as a shorthand for the health of the broader economy. In recent years, the index has shattered psychological barriers that were once thought to be decades away. As of the current market cycle in late 2024, the Dow Jones Industrial Average reached its highest level ever, consistently pushing past the 42,000-point threshold.

This journey to record highs is more than just a collection of numbers on a screen; it represents the resilience of corporate earnings, the evolution of monetary policy, and the shifting landscape of global finance. To understand the significance of the Dow’s record-breaking peaks, one must look at the catalysts that drove the index to these heights and what these milestones signal for the future of personal finance and institutional investing.
Tracking the Ascent: The Dow’s Record-Breaking Performance
The history of the Dow is a history of American industrial and technological expansion. While the index started at a humble 40.94 points in 1896, its growth over the last several decades has been exponential. The climb to the current all-time high has been punctuated by several era-defining milestones that changed the way investors perceive market value.
The Breach of 40,000 and Beyond
In May 2024, the Dow Jones Industrial Average achieved a historic milestone by closing above 40,000 for the first time. This event was not merely a symbolic victory; it was a testament to a robust recovery from the volatility of the early 2020s. Since that initial breach, the index has continued to test new frontiers, frequently setting fresh intraday and closing records above 41,000 and 42,000.
The transition from 30,000 to 40,000 occurred at a remarkably rapid pace compared to previous 10,000-point increments. It took the index nearly 18 years to move from 10,000 to 20,000, and roughly 3.5 years to move from 20,000 to 30,000. The latest leap highlights the accelerating nature of capital appreciation in an era defined by massive liquidity and high-growth technology components within the index.
Historical Context of Major Milestones
Looking back at the timeline of the Dow helps put the “highest ever” figure into perspective. The index first hit 1,000 in 1972, a feat that took 76 years to accomplish. The 10,000 mark was crossed in 1999 during the height of the dot-com boom. Despite the Great Recession of 2008, which saw the index plummet below 7,000, the subsequent bull market became the longest in history, eventually propelling the Dow to 20,000 in early 2017.
Each of these peaks was met with skepticism at the time, with many analysts warning of overvaluation. Yet, the long-term trajectory of the Dow suggests that while market corrections are inevitable, the “highest ever” mark is a moving target that eventually yields to the compounding power of corporate growth.
The Mechanics of the Index: Why the Dow Still Matters
In the modern financial world, many traders prefer the S&P 500 or the Nasdaq 100 because they are market-cap weighted and include a broader range of companies. However, the Dow Jones Industrial Average remains a critical barometer for “Money” and investment strategy due to its unique construction and the caliber of its components.
Understanding Price-Weighting
Unlike most indices that give more weight to companies with the largest total market value, the Dow is price-weighted. This means that companies with a higher stock price exert more influence on the index’s movement than those with lower prices, regardless of the company’s actual size. While critics argue this method is antiquated, it creates a unique dynamic where the Dow reflects the “prestige” of individual share prices among American industrial giants.
The Power of the 30 Blue Chips
The companies that make up the Dow are selected by a committee at S&P Dow Jones Indices. They are intended to represent the best of the American economy across sectors like healthcare, technology, finance, and consumer goods. Inclusion in the Dow is a mark of stability and corporate maturity. When the Dow hits a new all-time high, it signifies that the most established, dividend-paying pillars of the U.S. economy—such as Microsoft, Goldman Sachs, UnitedHealth Group, and Apple—are performing at their peak. For many conservative investors and retirees, the Dow’s performance is more relevant than the volatile swings of speculative tech startups.
Catalysts of the Current Bull Market

Reaching the highest average in history does not happen in a vacuum. A specific set of economic conditions converged to drive the Dow to its 40,000+ levels. Understanding these drivers is essential for any investor looking to capitalize on current trends.
Monetary Policy and Interest Rate Expectations
One of the primary engines behind the Dow’s record highs has been the shifting stance of the Federal Reserve. After a period of aggressive interest rate hikes to combat inflation, the market began pricing in a “pivot” toward rate cuts. Lower interest rates generally benefit stocks by reducing the cost of borrowing for corporations and making equity yields more attractive compared to fixed-income assets like bonds. The anticipation of a “soft landing”—where inflation cools without triggering a recession—provided the bullish sentiment necessary to push the Dow to its record peak.
Corporate Earnings and Efficiency
Despite concerns about a slowing economy, Dow components have shown remarkable earnings resilience. Many of these companies utilized the post-pandemic period to streamline operations, integrate AI-driven efficiencies, and maintain strong pricing power. When blue-chip companies report earnings that beat analyst expectations, it provides a fundamental foundation for the index to climb. The record highs we see today are supported by actual profits, rather than purely speculative enthusiasm.
The “Flight to Quality”
In times of geopolitical uncertainty or inflationary pressure, investors often engage in a “flight to quality.” This involves moving capital away from risky, high-growth “moonshot” stocks and into the stable, cash-flow-positive companies found in the DJIA. Because the Dow consists of industry leaders with massive balance sheets, it often becomes the destination for institutional capital seeking safety without exiting the equity markets entirely.
Strategic Considerations for Investors at All-Time Highs
When the headlines scream that the Dow has hit its highest average ever, many retail investors feel a mix of excitement and anxiety. There is a common fear that buying at the top is a recipe for loss. However, from a financial management perspective, record highs are a normal feature of a growing economy.
The Danger of Market Timing
Attempting to time the market by waiting for a “dip” can be a costly mistake. History shows that the Dow often hits a record high and then continues to hit dozens more over the following months. An investor who sat out in early 2024 because the Dow hit 38,000 would have missed the subsequent run to 42,000. In the world of investing, “time in the market” is almost always superior to “timing the market.”
Rebalancing and Diversification
While the Dow’s record highs are a cause for celebration, they also serve as a reminder to rebalance. If your Dow-focused holdings have grown significantly, they may now represent a larger percentage of your portfolio than originally intended. Financial professionals often recommend using these peaks to lock in some gains and redistribute capital into undervalued sectors or international markets to ensure a diversified risk profile.
Dividend Reinvestment
A significant portion of the Dow’s total return comes from dividends. Many of the 30 components are “Dividend Aristocrats” or “Dividend Kings” that have increased their payouts for decades. At record highs, the yield percentage may look lower because the stock price is higher, but the absolute dollar amount of the dividend often remains steady or grows. Reinvesting these dividends during both peaks and troughs is one of the most effective ways to build long-term wealth.
Navigating the Future: The Path to 50,000
The question on every investor’s mind is no longer “What is the highest Dow Jones average ever?” but rather “How much higher can it go?” While the index is currently in uncharted territory, the fundamental drivers of growth suggest that the journey is far from over.
Potential Headwinds
No market moves upward in a straight line. Investors must remain vigilant regarding potential risks that could pull the Dow away from its record highs. These include sudden spikes in energy prices, geopolitical conflicts that disrupt global supply chains, or a resurgence of inflation that forces the Federal Reserve to keep interest rates “higher for longer.” Any of these factors could trigger a correction, which is typically defined as a 10% drop from recent highs.
The Next Frontier
Psychological barriers like 50,000 are already being discussed in trading rooms across Wall Street. To reach that level, the Dow will need continued innovation from its tech components and steady growth from its industrial and financial members. As the global economy becomes increasingly digitized, the composition of the Dow may continue to evolve, replacing legacy industrial firms with the next generation of dominant corporations.
Ultimately, the highest Dow Jones average ever is a milestone that reflects the enduring strength of the American corporate engine. For the disciplined investor, these records are not a signal to exit, but a validation of the long-term upward bias of the equity markets. Whether the index is at 10,000 or 42,000, the principles of sound investing—diversification, consistency, and a focus on quality—remain the same. As the Dow continues to reach for new heights, it serves as a reminder that the economy’s capacity for growth has historically outpaced even the most pessimistic forecasts.
aViewFromTheCave is a participant in the Amazon Services LLC Associates Program, an affiliate advertising program designed to provide a means for sites to earn advertising fees by advertising and linking to Amazon.com. Amazon, the Amazon logo, AmazonSupply, and the AmazonSupply logo are trademarks of Amazon.com, Inc. or its affiliates. As an Amazon Associate we earn affiliate commissions from qualifying purchases.