
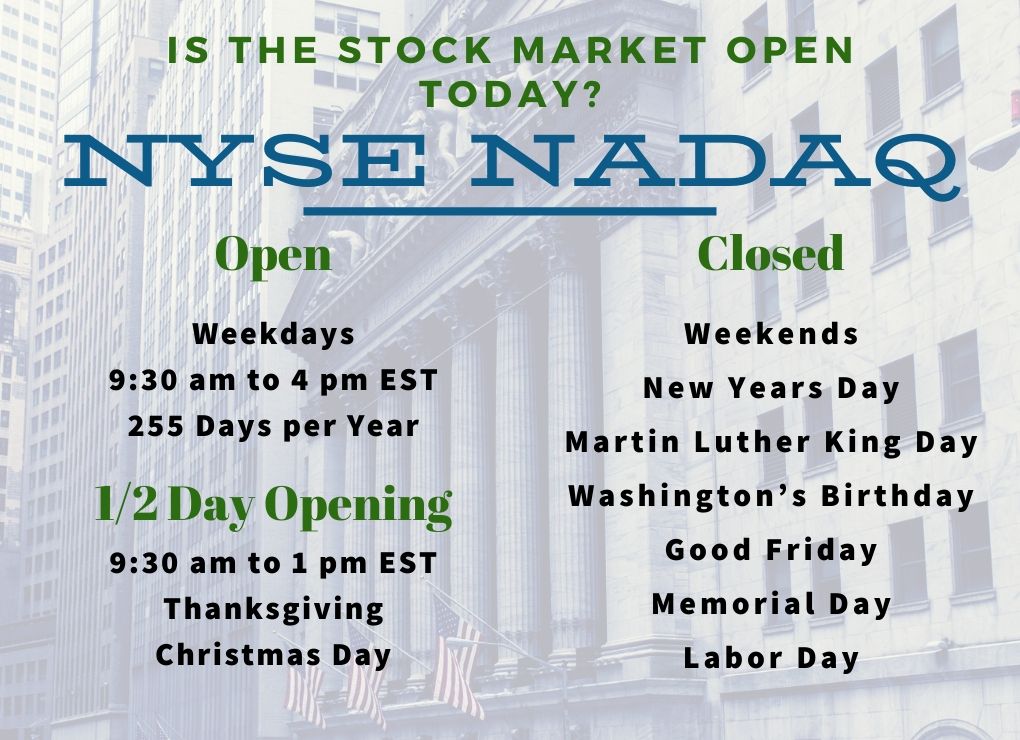
The closing bell of the New York Stock Exchange (NYSE) is more than just a ceremonial end to a trading day; it represents the definitive pulse of global finance. When investors ask, “What did the NYSE close at today?” they are rarely looking for a single digit. Instead, they are seeking an understanding of market sentiment, the health of the broader economy, and the trajectory of their personal wealth. As the world’s largest stock exchange by market capitalization, the NYSE serves as the primary stage where the forces of supply and demand reach a daily consensus, setting the tone for international markets and shaping the financial decisions of millions.
Understanding the NYSE Closing Bell and Its Global Impact
The NYSE operates as a continuous auction market, but the “close” is a unique event known as the Closing Auction. This process is designed to consolidate all remaining interest in a stock into a single, final price that reflects the most accurate valuation at 4:00 PM Eastern Time. For institutional investors, mutual funds, and retail traders alike, this price is the gold standard for valuing portfolios and executing large-scale trades.
The Mechanics of the Closing Auction
Unlike the volatile fluctuations seen throughout the trading day, the closing price is determined through a highly regulated auction process. This ensures that the final price is not a result of a single “fat-finger” trade or a momentary spike in liquidity. Instead, the NYSE’s designated market makers (DMMs) aggregate buy and sell orders to find the price point where the maximum number of shares can be traded. This concentration of liquidity makes the closing price the most reliable data point of the day, which is why it is used to calculate Net Asset Values (NAV) for mutual funds and to trigger various automated financial contracts.
Why the Final Number Matters for Global Stability
The NYSE is home to many of the world’s most influential corporations, from blue-chip industrial giants to massive financial institutions. Consequently, when the NYSE closes higher or lower, it sends a ripple effect across the globe. European and Asian markets often react to the “lead” set by Wall Street. A strong close in New York can bolster confidence in Tokyo and London the following morning, while a sharp decline can trigger defensive postures worldwide. Understanding the closing figures is essential for anyone looking to grasp the interconnected nature of modern capitalism.
Analyzing Market Performance: Beyond Just the Number
When interpreting the NYSE’s performance, it is vital to distinguish between the various indices that track the exchange. While many people use the term “the market” interchangeably with the Dow Jones Industrial Average (DJIA), the NYSE Composite Index provides a much broader view. The NYSE Composite includes all common stocks listed on the New York Stock Exchange, including American Depositary Receipts (ADRs), real estate investment trusts (REITs), and tracking stocks.
The NYSE Composite vs. The Dow Jones
The Dow Jones Industrial Average tracks 30 prominent companies, providing a snapshot of the industrial and consumer sectors. In contrast, the NYSE Composite tracks over 2,000 companies. While the Dow might be up on a given day due to a rally in a few tech giants, the NYSE Composite might be down if the broader sectors—such as energy, utilities, or mid-cap manufacturing—are struggling. To truly answer what the NYSE “closed at,” an investor must look at the Composite Index to see how the “average” company performed, rather than just the elite few.
Sector Performance and Market Breadth
A “green” day on the NYSE doesn’t necessarily mean every sector flourished. Sophisticated investors look at market breadth—the ratio of advancing stocks to declining stocks. If the NYSE closes higher but more stocks declined than advanced, it suggests that a few heavyweights are propping up the index, indicating potential weakness in the overall market. Conversely, a day where gains are spread across healthcare, finance, and consumer staples suggests a healthy, sustainable rally. Monitoring these internal dynamics allows investors to identify where the “smart money” is moving before it becomes headline news.
Factors Influencing Today’s Market Closing Prices
The closing price is the culmination of thousands of data points processed by investors in real-time. Several macroeconomic and microeconomic factors dictate whether the final bell rings on a high or low note.

Economic Indicators and Interest Rate Speculation
The Federal Reserve remains the single most influential force on the NYSE. Any signals regarding interest rate hikes or cuts can cause massive swings in closing prices. High interest rates generally make borrowing more expensive for corporations and can dampen consumer spending, leading to lower stock valuations. Conversely, a “dovish” stance from the Fed often leads to a late-day rally as investors anticipate cheaper capital and higher corporate profits. Employment data, Consumer Price Index (CPI) reports, and manufacturing indices also serve as catalysts that drive the final hour of trading—often referred to as the “power hour.”
Corporate Earnings and Investor Sentiment
We are currently in an era where data is disseminated instantly, but the “reaction” often takes time to bake into the price. During earnings season, a company’s quarterly report can swing its stock price—and by extension, its sector—by double digits. However, it isn’t just about the numbers; it’s about the “guidance.” If a company beats earnings expectations but lowers its outlook for the next quarter, the NYSE may see a sell-off in the final minutes of trading as investors recalibrate their expectations. This collective sentiment represents the psychological component of the closing price, reflecting the market’s hope or fear regarding the immediate future.
How to Use Closing Data for Your Investment Strategy
For the disciplined investor, the NYSE closing price is more than a statistic; it is a tool for strategic decision-making. Whether you are a long-term “buy and hold” enthusiast or a more active participant, how you interpret the 4:00 PM print can define your financial success.
Technical Analysis and Historical Trends
Many traders use the closing price to identify support and resistance levels. A stock that consistently closes above a certain price point is said to have “broken out,” signaling a potential upward trend. Furthermore, the relationship between the closing price and the 50-day or 200-day moving average is a key indicator used by professionals to determine if the market is in a bullish or bearish phase. If the NYSE Composite closes below its long-term moving average, it may be a signal to increase cash positions or hedge against further downside.
Long-term vs. Short-term Perspectives
It is easy to get caught up in the daily noise of the NYSE. However, individual closing prices should be viewed as part of a larger mosaic. For personal finance goals, such as retirement planning or saving for a home, the “closing price today” is less important than the “closing price five years from now.” That said, observing daily closes helps investors stay informed about market volatility. It allows for “rebalancing”—selling some of what has gone up and buying what has gone down—to maintain a target asset allocation. By keeping an eye on the close, you ensure that your portfolio remains aligned with your risk tolerance and financial objectives.
Navigating After-Hours Trading and Volatility
While the closing bell signifies the end of the official session, the market never truly sleeps. After-hours trading occurs via Electronic Communication Networks (ECNs), allowing investors to trade from 4:00 PM to 8:00 PM ET.
The Role of Institutional Moves After the Bell
Major news often breaks after the 4:00 PM close—such as government policy shifts or unexpected CEO resignations. This can cause the “after-hours” price to diverge significantly from the official NYSE closing price. For the average investor, it is crucial to realize that after-hours markets have much lower liquidity and higher volatility. A stock might drop 5% after the bell on a small amount of volume, only to recover by the next morning’s open. Understanding this prevents knee-jerk reactions to price movements that occur outside of the primary trading window.
Preparing for the Next Opening Bell
The NYSE closing price provides the baseline for the next day’s “gap.” If the market closes at a record high with strong momentum, it often “gaps up” the following morning as buyers scramble to get in. Conversely, a “weak close”—where the market ends at the low of the day—often suggests that the selling pressure hasn’t yet exhausted itself. By analyzing how and why the NYSE closed at its specific level today, you gain the foresight necessary to prepare your orders for tomorrow, ensuring you are acting on insight rather than emotion.
In conclusion, the question of what the NYSE closed at today is the starting point for a deeper inquiry into the state of the global economy. By looking past the surface-level numbers and into the sectors, economic drivers, and technical trends, investors can transform a simple daily update into a comprehensive financial strategy. Whether the market is up or down, the closing bell offers the clarity needed to navigate the complex world of personal and business finance.
aViewFromTheCave is a participant in the Amazon Services LLC Associates Program, an affiliate advertising program designed to provide a means for sites to earn advertising fees by advertising and linking to Amazon.com. Amazon, the Amazon logo, AmazonSupply, and the AmazonSupply logo are trademarks of Amazon.com, Inc. or its affiliates. As an Amazon Associate we earn affiliate commissions from qualifying purchases.