
For many investors, the first ritual of the morning or the final check of the evening involves a glance at a brokerage app or a financial news ticker. When the numbers are in the green, there is a sense of quiet satisfaction. However, when the screen is bathed in red, the immediate question arises: “How much is the market down today?” While the raw percentage change provides a snapshot of the moment, understanding the implications of that decline requires a deeper dive into the mechanics of the financial markets, the catalysts driving the movement, and the strategic mindset necessary to navigate periods of turbulence.
In the world of personal finance and investing, “the market” is rarely a singular entity. To accurately answer how much it is down, one must look at specific benchmarks, economic indicators, and the broader context of the current fiscal environment.
Measuring the Downturn: The Essential Indices
To understand market performance, one must first identify which “market” is being referenced. Different indices track different sectors and company sizes, meaning one could be down significantly while another remains relatively flat.
The S&P 500: The Broader Market Barometer
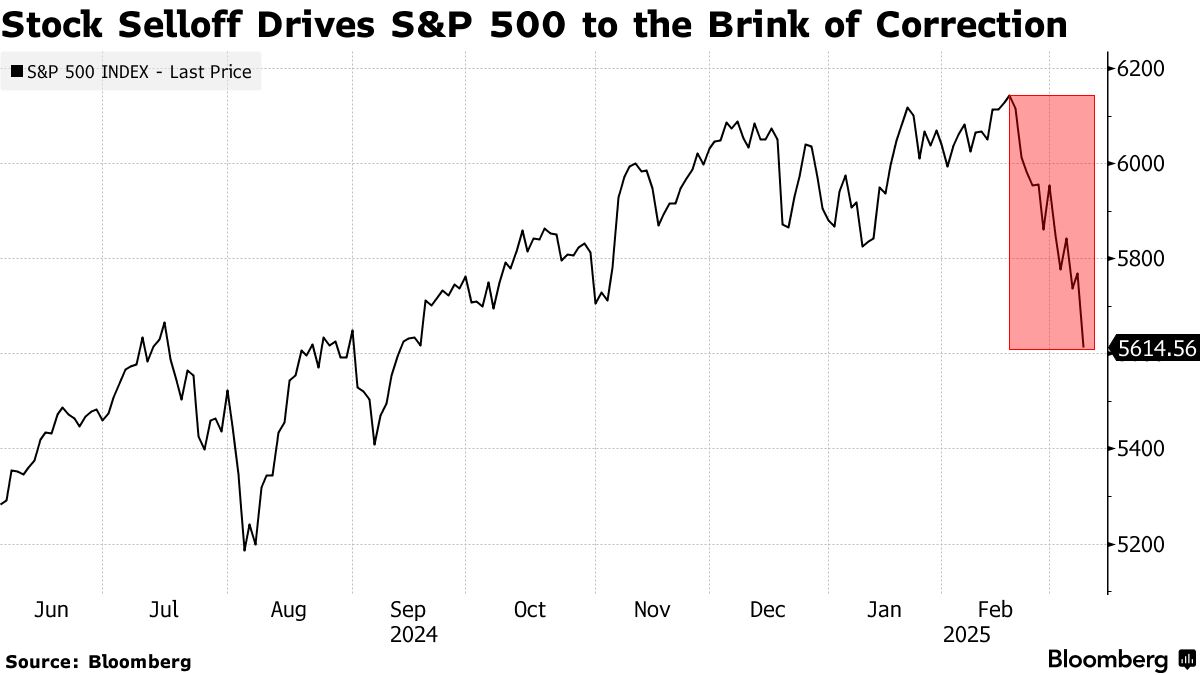
The Standard & Poor’s 500 is often considered the most accurate representation of the U.S. stock market and the overall economy. Comprising 500 of the largest publicly traded companies in the United States, it is a market-capitalization-weighted index. When an investor asks how the market is doing, they are usually referring to this index. A decline in the S&P 500 suggests a broad-based sell-off affecting multiple sectors, from technology and healthcare to consumer staples and energy.
The Nasdaq Composite: The Tech-Heavy Perspective
The Nasdaq is heavily weighted toward technology and growth-oriented companies. Because tech stocks are often more sensitive to interest rate changes and future earnings projections, the Nasdaq tends to experience higher volatility than other indices. If the Nasdaq is down more than the S&P 500 on a given day, it often indicates that investors are pulling back from “risk-on” assets or that the tech sector is facing specific headwinds, such as regulatory concerns or a rotation into more defensive value stocks.
The Dow Jones Industrial Average: The Blue-Chip Pulse
The Dow consists of 30 prominent, “blue-chip” companies. Unlike the S&P 500, it is a price-weighted index. While it is less representative of the total market than the S&P 500, it serves as a valuable indicator of how established, industrial, and financial giants are performing. When the Dow is down significantly, it often signals a lack of confidence in the foundational pillars of the American corporate landscape.
The Catalysts of a Market Slide: Identifying the “Why”
Seeing a downward trend is one thing; understanding the “why” is what separates reactive traders from disciplined investors. Market declines are rarely random; they are typically the result of specific economic or psychological triggers.
Macroeconomic Factors: Interest Rates and Inflation
Perhaps the most influential driver of market movement in the modern era is the Federal Reserve’s monetary policy. When inflation rises, the central bank may increase interest rates to cool the economy. Higher interest rates make borrowing more expensive for corporations, which can eat into profit margins and slow expansion. Furthermore, higher rates increase the “discount rate” used to value future cash flows, which often leads to a revaluation of stock prices—particularly for high-growth companies. If the market is down today, it is frequently due to a recent CPI (Consumer Price Index) report or a hawkish statement from a Fed official.
Geopolitical Tensions and Global Stability
Markets hate uncertainty. Geopolitical conflicts, trade wars, or political instability in major economies can trigger immediate “flight to safety” responses. During these times, investors may sell equities and move capital into “safe-haven” assets like gold or U.S. Treasuries. These declines are often sharp and sudden, reflecting the market’s attempt to price in unpredictable future risks.
Corporate Earnings and Growth Forecasts
The stock market is ultimately a forward-looking machine that attempts to price the future earnings of companies. During “earnings season,” when major corporations release their quarterly results, a few high-profile misses can drag down entire sectors. If a bellwether company like Apple or Microsoft provides a weak outlook for the next quarter, it can dampen sentiment across the board, leading to a general market decline regardless of the current economic data.
Navigating the Numbers: Percentage Points vs. Long-Term Trends
When tracking how much the market is down, it is easy to lose perspective. A 500-point drop in the Dow Jones might sound catastrophic in a headline, but as a percentage of the total index value, it may represent a relatively minor fluctuation.
Understanding Corrections and Bear Markets
A standard day-to-day dip of 1% or 2% is a normal part of market healthy functioning. However, investors should be aware of specific technical definitions:
-
Pullback: A drop of 5% to 10% from recent highs.
-
Correction: A decline of 10% to 20%. Corrections occur roughly every 16 months on average and are often seen as opportunities to “rebalance” portfolios.
-
Bear Market: A decline of 20% or more from recent peaks. Bear markets are often associated with recessions and can last for months or even years.
Identifying where today’s decline sits within these categories helps an investor determine whether the movement is “noise” or a fundamental shift in the market cycle.
The Role of Volatility and the VIX
The CBOE Volatility Index, or VIX, is often called the “fear gauge.” It measures the market’s expectation of 30-day forward-looking volatility derived from S&P 500 index options. When the market is down significantly, the VIX usually spikes. A high VIX suggests that investors are paying more for “insurance” against further declines. Monitoring the VIX alongside the daily percentage change provides insight into whether the sell-off is orderly or driven by panic.
Strategic Responses: What to Do When the Market Is Down
For the personal finance enthusiast, a down market is not just a statistical event; it is a test of strategy. How an investor reacts to a “red day” can have a more significant impact on their long-term wealth than the market movement itself.
The Power of Dollar-Cost Averaging (DCA)
One of the most effective ways to handle market downturns is to ignore them through automation. Dollar-cost averaging involves investing a fixed amount of money at regular intervals, regardless of the share price. When the market is down, your fixed investment buys more shares. Over time, this lowers the average cost per share and removes the emotional burden of trying to “time the bottom.”
Portfolio Rebalancing: Selling High, Buying Low
A market decline often shifts the weight of a portfolio. For example, if stocks drop significantly, your portfolio might become “overweight” in bonds or cash. A down market provides a logical prompt to rebalance—selling a portion of the assets that held their value to buy more of the equities that are now “on sale.” This disciplined approach ensures that you are adhering to your original risk tolerance and buying assets when they are undervalued.
Tax-Loss Harvesting
For investors in taxable accounts, a market downturn presents an opportunity for tax-loss harvesting. This involves selling securities that are trading at a loss to offset capital gains in other parts of the portfolio. The sold security is then replaced with a similar (but not identical) asset to maintain the desired market exposure. This strategy can significantly improve after-tax returns, turning a market decline into a fiscal advantage.
The Psychological Toolkit for the Disciplined Investor
The greatest threat to a portfolio during a market downturn is often the investor’s own psychology. The “loss aversion” bias suggests that the pain of losing money is twice as powerful as the joy of gaining it. This bias leads many to sell at the bottom, locking in losses that might have been temporary.
Maintaining a Long-Term Horizon
History shows that the stock market has an upward bias over long periods. While daily declines are common, the probability of a positive return increases the longer an investor holds their positions. When the market is down today, it is helpful to look at a 5-year or 10-year chart of the S&P 500. From that perspective, even the most significant daily drops often appear as minor blips in a consistent upward trajectory.
Avoiding the “Refresh” Trap
In an age of instant notifications, it is easy to become obsessed with real-time data. However, for a long-term investor, checking the market multiple times a day provides little value and high stress. If the market is down, the best course of action is often to step away from the screen. A well-constructed financial plan should account for volatility; if your strategy depends on the market being green every day, it is the strategy—not the market—that needs adjustment.

Conclusion: Perspective over Panic
Asking “how much is the market down today?” is a natural response to the inherent uncertainty of investing. However, the answer is only as useful as the context in which it is placed. Whether the decline is driven by a shift in Fed policy, geopolitical unrest, or a standard technical correction, the fundamental principles of successful investing remain the same: diversification, discipline, and a focus on long-term goals.
Market downturns are the “price of admission” for the long-term gains that equities provide. By understanding the indices, identifying the catalysts, and utilizing strategic tools like dollar-cost averaging and rebalancing, investors can transform a day of “red” into a building block for future financial independence. The market may be down today, but for the prepared investor, the journey toward wealth continues unabated.
aViewFromTheCave is a participant in the Amazon Services LLC Associates Program, an affiliate advertising program designed to provide a means for sites to earn advertising fees by advertising and linking to Amazon.com. Amazon, the Amazon logo, AmazonSupply, and the AmazonSupply logo are trademarks of Amazon.com, Inc. or its affiliates. As an Amazon Associate we earn affiliate commissions from qualifying purchases.