
The S&P 500 record high is more than just a numerical milestone; it is a vital barometer for the health of the American economy and the collective sentiment of global investors. As a market-capitalization-weighted index of the 500 leading publicly traded companies in the United States, the S&P 500 serves as the primary benchmark for the U.S. equity market. When the index hits a record high, it signifies that the total value of these companies has reached an unprecedented peak, reflecting growth in corporate earnings, technological innovation, and investor confidence.
Understanding what constitutes a record high, how these peaks are measured, and what they mean for the individual investor is essential for navigating the complexities of modern finance. While many retail investors view record highs with a mixture of excitement and trepidation, institutional players treat these milestones as data points within a broader historical continuum. To truly grasp the significance of a new peak, one must look beneath the surface of the headline numbers to examine the underlying economic drivers and historical patterns.
Defining the S&P 500 Record High
In financial terms, a record high—often referred to as an “all-time high” (ATH)—is the highest price level the index has ever reached during its existence. Because the S&P 500 is a price index, this figure represents the aggregate value of its constituent stocks, adjusted by a divisor to ensure that corporate actions like stock splits or spinoffs do not artificially distort the index level.
How Record Highs Are Calculated
The S&P 500 is market-cap weighted, meaning that companies with larger valuations, such as Apple, Microsoft, and Nvidia, have a more significant impact on the index’s movement than smaller constituents. A record high is achieved when the combined market capitalization of these 500 companies, weighted accordingly, surpasses any previous closing or intraday value.
It is important to distinguish between the “Closing High” and the “Intraday High.” The closing high is the price of the index at the final bell of the trading day, and this is the figure most commonly cited by financial historians and media outlets. The intraday high represents the absolute peak reached during the hours of active trading, which may be higher than the final close if the market retreats before the day ends. For most technical analysts, the closing high is the more significant metric, as it represents the “settled” conviction of the market.
Price Index vs. Total Return Index
When discussing record highs, most people are referring to the S&P 500 Price Index. However, savvy investors also track the S&P 500 Total Return Index. The total return index accounts for the reinvestment of dividends, providing a more comprehensive view of the actual wealth generated for shareholders. While the price index may hit a record high based on share prices alone, the total return index often hits record highs more frequently because it includes the compounding effect of quarterly dividend payments. For long-term wealth building, the record highs of the total return index are often more indicative of true portfolio performance.
The Historical Context of S&P 500 Milestones
The history of S&P 500 record highs is a story of American industrial and technological evolution. Since the index in its current form was established in 1957, it has navigated decades of inflation, stagflation, technological revolutions, and global crises. Each record high represents a moment where the market has successfully climbed a “wall of worry” to reach new territory.
From Post-War Growth to the Dot-Com Bubble
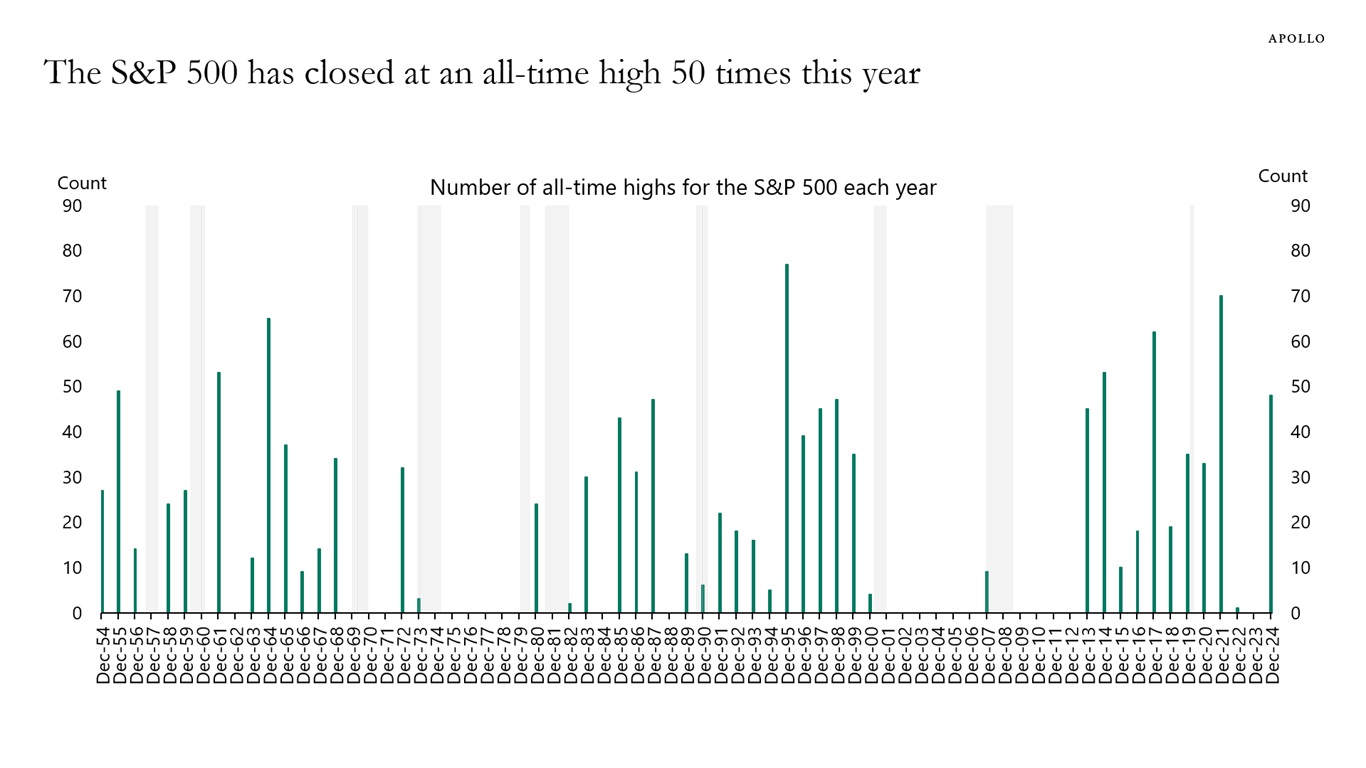
In the early decades of the S&P 500, record highs were driven by the expansion of American manufacturing and the rise of the middle class. The index crossed the 100-point milestone for the first time in 1968. However, the 1970s brought a period of stagnation where record highs were few and far between due to high inflation and energy crises.
The 1980s and 1990s marked a dramatic shift. The deregulation of financial markets and the dawn of the information age propelled the index to heights previously thought impossible. The S&P 500 crossed 1,000 points in February 1998. During the late 1990s, record highs became a weekly occurrence as the “Dot-Com Bubble” inflated valuations. When that bubble burst in 2000, it took years for the index to reclaim those record levels, illustrating that while record highs are signs of progress, they can sometimes be fueled by irrational exuberance.
The Post-2008 Recovery and the Tech Boom
The Global Financial Crisis of 2008 saw the S&P 500 lose more than half its value, dropping far below its previous record highs. However, the subsequent recovery led to one of the longest bull markets in history. Starting in 2013, the index began a consistent streak of breaking new ground.
This modern era of record highs has been characterized by the dominance of “Big Tech.” The transition to cloud computing, the rise of software-as-a-service (SaaS), and the recent explosion of Artificial Intelligence (AI) have provided the fundamental earnings growth necessary to push the index to the 3,000, 4,000, and 5,000-point milestones. Each of these thousand-point intervals serves as a psychological “round number” resistance level that, once broken, often reinforces investor confidence.
Why Record Highs Matter to Your Portfolio
For the average investor, a record high can be an intimidating prospect. There is a common psychological bias known as “fear of heights,” where investors assume that because the market is at an all-time high, it must be due for a crash. However, historical data often suggests the opposite.
Sentiment and Market Momentum
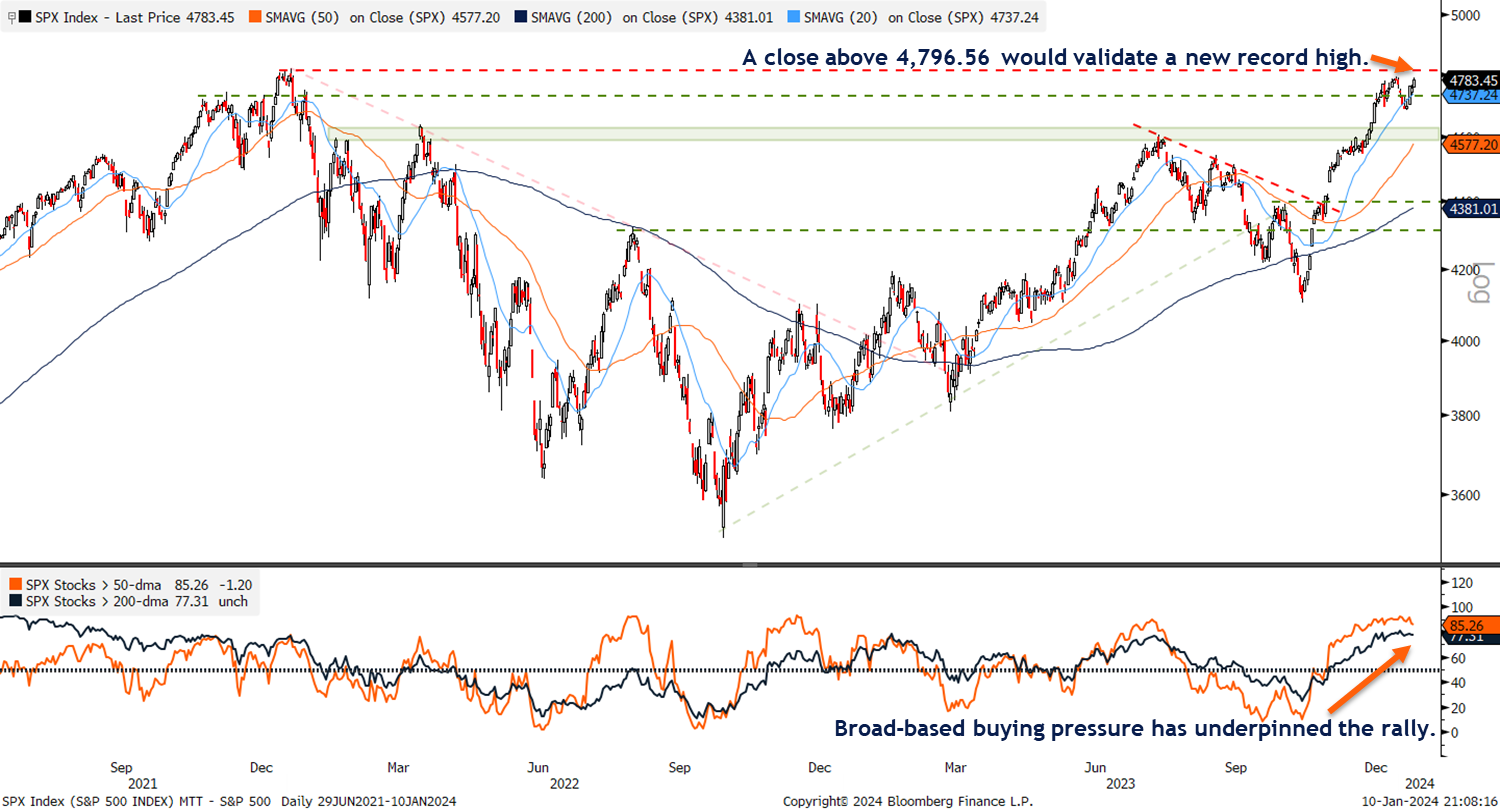
A record high is a powerful signal of positive momentum. In technical analysis, once an index breaks through a previous “resistance” level (the former record high), that level often becomes a “support” level. This transition indicates a shift in market psychology where investors are willing to pay higher multiples for future earnings.
Furthermore, record highs attract “sideline money.” Investors who have been holding cash often feel a sense of “fear of missing out” (FOMO) when they see the S&P 500 hitting new peaks. This influx of capital can drive the index even higher, creating a self-fulfilling prophecy of growth. While this momentum can lead to overvaluation, it is also the primary mechanism through which long-term market gains are realized.
The Impact on Retirement and Wealth Building
For those with 401(k)s, IRAs, or brokerage accounts invested in index funds, record highs are a direct indicator of net worth growth. When the S&P 500 hits a record high, it means that almost every long-term investor who has held their position is currently in a profitable state. This “wealth effect” can boost consumer spending and further stimulate the economy, creating a virtuous cycle that supports corporate revenues.
Investing at All-Time Highs: Risks and Rewards
The most common question asked when the S&P 500 hits a record high is: “Is it too late to buy?” The answer, backed by decades of financial research, is usually “No.”
The Myth of the “Market Peak” Crash
It is a common misconception that investing at an all-time high is a recipe for poor returns. In fact, research conducted by various financial institutions, including JPMorgan Asset Management, has shown that the average returns one, three, and five years after investing at an all-time high are often similar to, or even slightly better than, returns from investing on any other random day.
Markets tend to trend upward over time because the companies within the index are productive assets that generate profits and grow over time. Therefore, the S&P 500 spends a significant portion of its life within a few percentage points of a record high. Waiting for a “dip” or a “crash” before investing can lead to missing out on substantial gains, a phenomenon known as the “cost of waiting.”
Strategic Approaches: Dollar-Cost Averaging
For investors who are nervous about putting a large lump sum into the market at a record high, Dollar-Cost Averaging (DCA) is a highly effective strategy. By investing a fixed amount of money at regular intervals, regardless of the index price, an investor buys fewer shares when prices are high and more shares when prices are low. This mitigates the risk of “bad timing” and allows the investor to participate in the market’s long-term upward trajectory while maintaining peace of mind during periods of volatility.
Navigating the Future: Indicators of Sustained Growth
While record highs are celebratory, disciplined investors must also look at valuation metrics to determine if the new peak is sustainable. A record high driven by earnings growth is far more stable than one driven solely by speculative multiple expansion.
Corporate Earnings and P/E Ratios
The most critical metric to watch during a record high is the Price-to-Earnings (P/E) ratio. If the S&P 500 hits a new high while corporate earnings are also hitting new highs, the P/E ratio may remain stable, suggesting that the market is fairly valued. However, if the index price rises significantly faster than corporate profits, the “Forward P/E” expands, which may indicate that the market is becoming “expensive” or overextended.

Macroeconomic Factors and Interest Rates
The S&P 500 does not exist in a vacuum. Record highs are often influenced by the Federal Reserve’s monetary policy. Low interest rates tend to support higher stock prices because they reduce the cost of borrowing for companies and make equities more attractive compared to bonds. Conversely, if the index hits a record high in a high-interest-rate environment, it is often a sign of incredible resilience in corporate America, suggesting that businesses are efficient enough to generate profits despite higher capital costs.
In conclusion, the S&P 500 record high is a testament to the enduring power of the global economy and the innovative capacity of its leading corporations. While peaks can bring volatility and necessitate a cautious look at valuations, they are ultimately the milestones of progress in a long-term investment journey. By understanding the mechanics, history, and psychology of these highs, investors can move past the fear of “the top” and focus on the compounding growth that has historically followed every market peak.
aViewFromTheCave is a participant in the Amazon Services LLC Associates Program, an affiliate advertising program designed to provide a means for sites to earn advertising fees by advertising and linking to Amazon.com. Amazon, the Amazon logo, AmazonSupply, and the AmazonSupply logo are trademarks of Amazon.com, Inc. or its affiliates. As an Amazon Associate we earn affiliate commissions from qualifying purchases.