
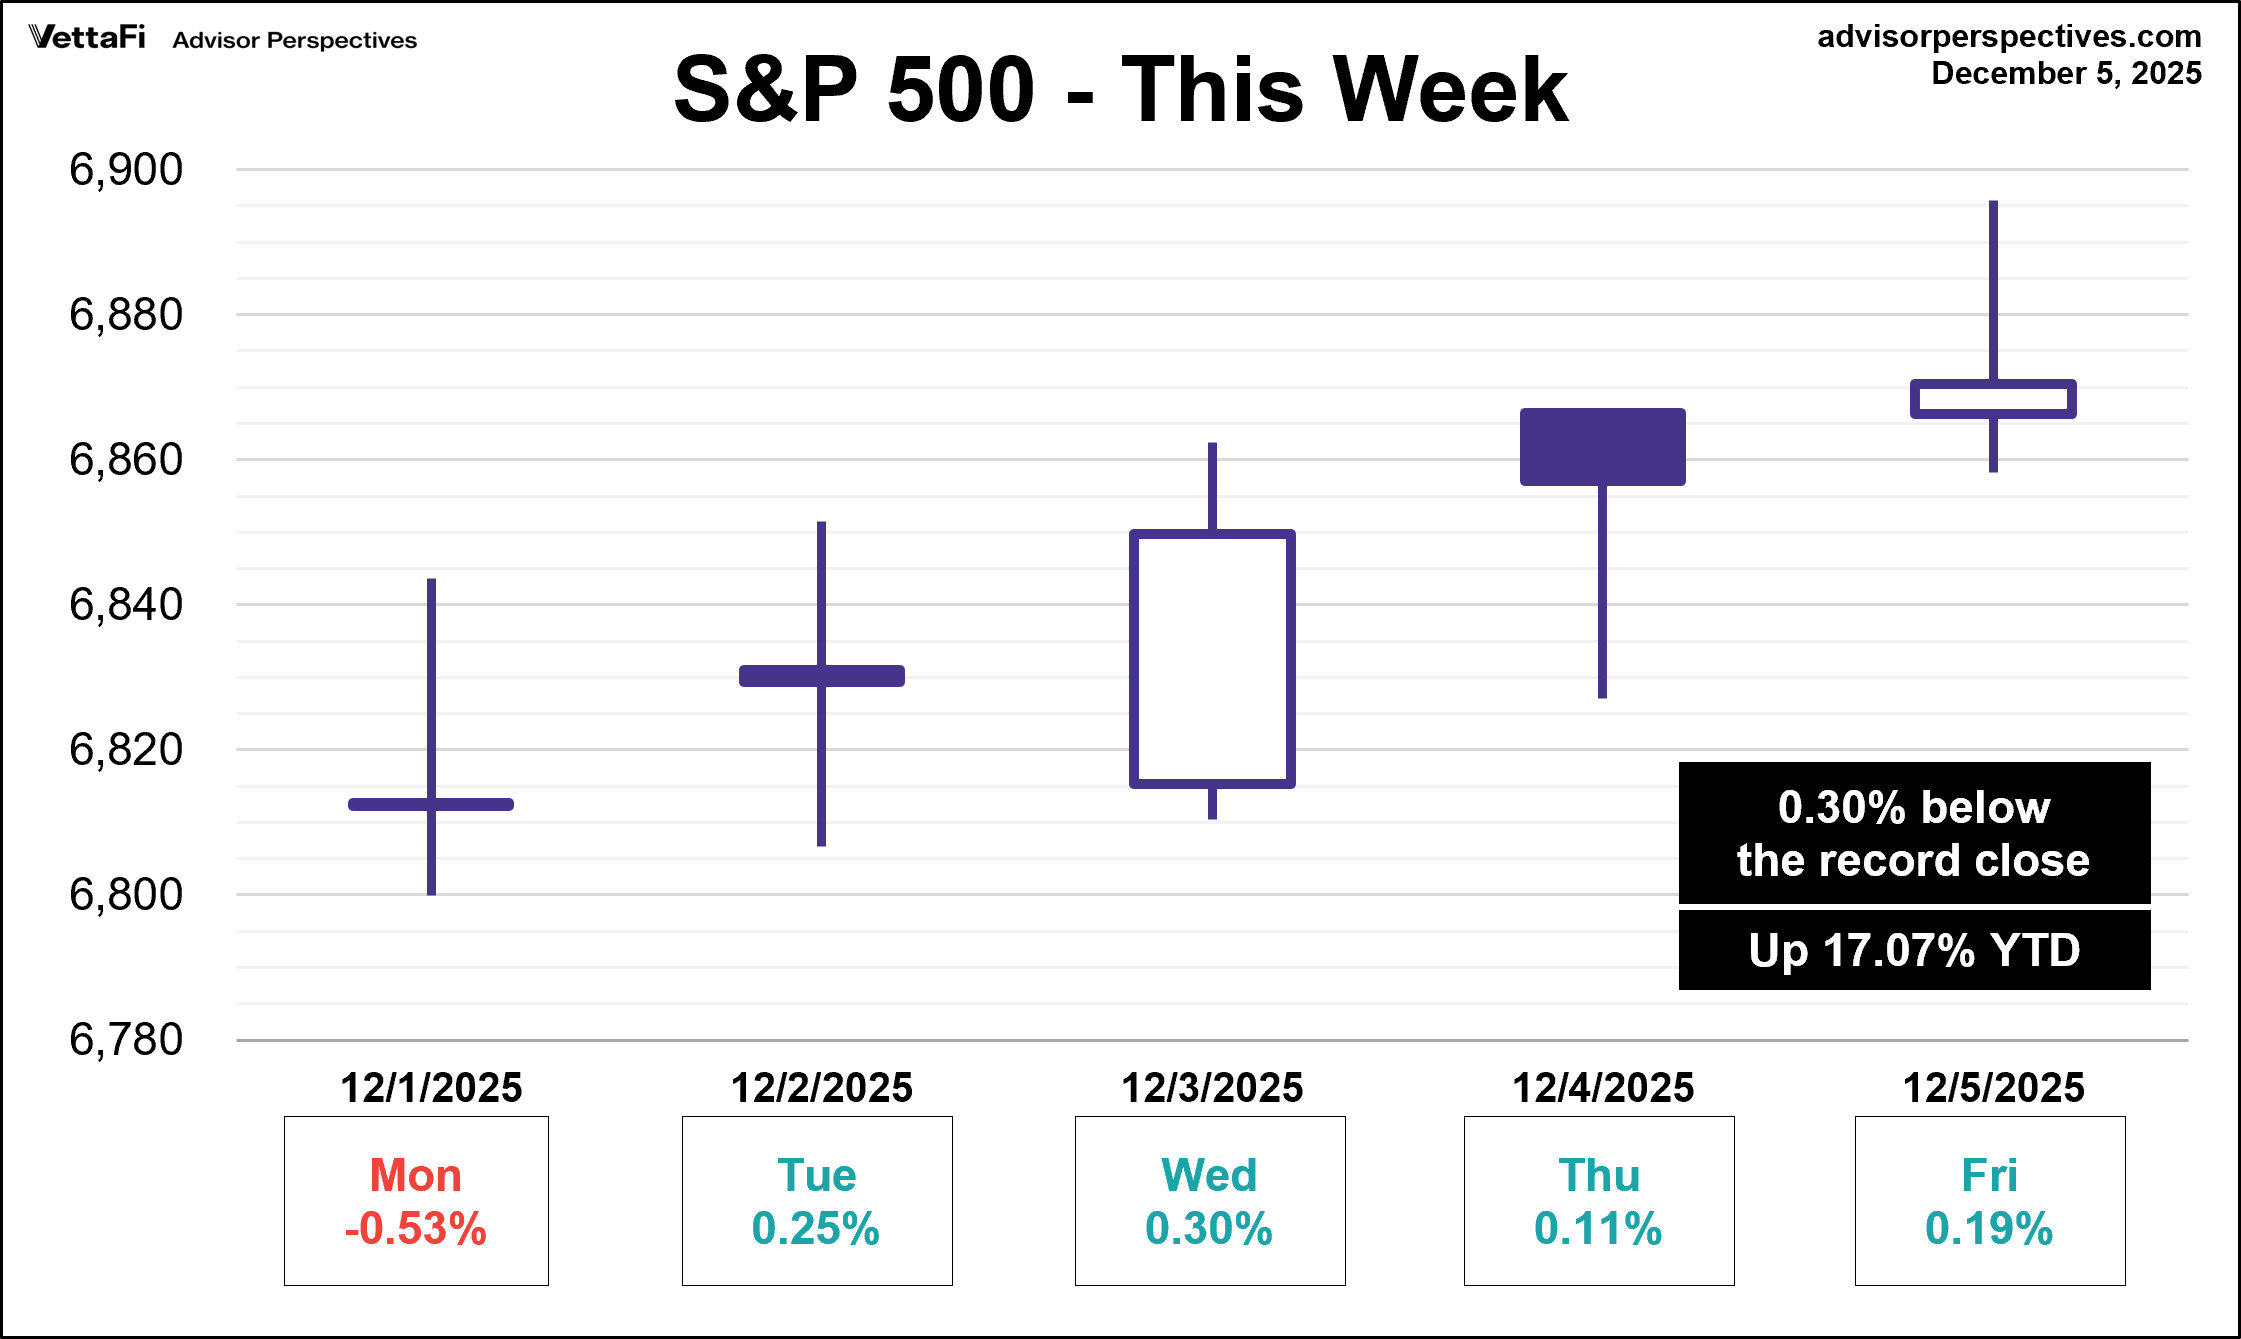
For investors, analysts, and casual observers of the global economy, the daily closing price of the Standard & Poor’s 500 Index (S&P 500) is more than just a number. It is a pulse check on the health of the American corporate landscape and a primary indicator of investor sentiment worldwide. When people ask, “where did the S&P close today,” they are often looking for a snapshot of their own financial future, as the index tracks the performance of 500 of the largest companies listed on stock exchanges in the United States, covering approximately 80% of available market capitalization.

Understanding the closing price requires a deep dive into the mechanics of the market, the psychological drivers of trading, and the macroeconomic factors that push the needle. Whether the index finishes in the green or the red on any given day, the context behind that movement provides the necessary insight for making informed financial decisions.
The Mechanics of the S&P 500 Daily Close
The daily closing price of the S&P 500 is determined at 4:00 PM Eastern Time when the New York Stock Exchange (NYSE) and the Nasdaq officially cease regular trading. However, the process of reaching that final number is a complex dance of liquidity, order matching, and institutional rebalancing.
How the Closing Price is Determined
Unlike a simple average, the S&P 500 is a float-adjusted market-capitalization-weighted index. This means that the closing price is influenced more heavily by the largest companies in the index, such as Apple, Microsoft, and Amazon, than by its smaller constituents. The “close” is the result of the closing auction, a process designed to consolidate liquidity and ensure that the final price reflects the true market consensus at the end of the session. During this auction, buy and sell orders are matched at a single price that maximizes the volume of shares traded. This helps mitigate the volatility that can occur in the final seconds of the trading day.
The Significance of the “Closing Bell”
The closing bell is not just a tradition; it marks the point at which mutual funds and many institutional portfolios calculate their Net Asset Value (NAV). For the millions of Americans invested in 400(k) plans or target-date funds, the S&P 500 closing price is the benchmark used to determine the value of their holdings for that day. It is the final “mark to market” that dictates how wealth is measured on a daily basis.
After-Hours Trading and Its Relationship to the Daily Close
While the official close happens at 4:00 PM, trading does not stop. Electronic Communication Networks (ECNs) allow for after-hours trading, which can sometimes cause the index futures to move significantly after the official close. If a major company like Nvidia or Alphabet releases an earnings report at 4:05 PM, the “close” might quickly feel outdated. However, the official closing price remains the historical record used by economists and financial historians to track market performance over decades.
Why Daily Fluctuations Matter (and Why They Don’t)
It is easy to become hyper-focused on the daily fluctuations of the S&P 500. A 1% drop can feel like a catastrophe, while a 1% gain can feel like a victory. However, a professional approach to money management requires distinguishing between “noise” and “signal.”
Volatility vs. Long-Term Growth
Daily volatility is a natural feature of the equity markets. It is driven by news cycles, algorithmic trading, and short-term speculation. For the long-term investor, the closing price of a single day is rarely a reason to change a financial strategy. Historically, the S&P 500 has provided an average annual return of approximately 10% over long horizons. This growth is rarely linear; it is a jagged line that trends upward over years, despite the “red” days that occur in the short term.
Psychologically Navigating “Red” Days
The psychological impact of a market close is significant. “Loss aversion” is a well-documented phenomenon in behavioral finance where the pain of losing is felt twice as strongly as the joy of gaining. When the S&P closes down significantly, investors are often tempted to “panic sell” to preserve what capital they have left. Understanding that the daily close is just one data point in a vast timeline is essential for maintaining the emotional discipline required for successful investing.
The Impact of Macroeconomic Data
Often, where the S&P 500 closes is a direct reaction to macroeconomic reports released earlier in the day. Key indicators include:
-
Consumer Price Index (CPI): If inflation is higher than expected, the market may close lower on fears that the Federal Reserve will raise interest rates.
-
Employment Data: Strong jobs reports can be a “double-edged sword.” While they signal a robust economy, they can also suggest that the economy is “overheating,” leading to tighter monetary policy.
-
Federal Open Market Committee (FOMC) Minutes: The words of the Fed Chair can move the index hundreds of points in a single afternoon session.
Analyzing Today’s Market Drivers
To understand where the index closed, one must look at the specific sectors and companies that drove the movement. The S&P 500 is not a monolith; it is a collection of eleven different sectors, each responding differently to economic stimuli.

Sector Performance: Tech vs. Value
In recent years, the Technology and Communication Services sectors have dominated the S&P 500’s performance. Because the index is market-cap weighted, “Mega-cap” tech stocks—often referred to as the “Magnificent Seven”—have an outsized influence. If the S&P closed higher today, it is likely that these tech giants performed well. Conversely, on days when the index is flat but energy or utilities are up, it signals a “rotation” where investors are moving money out of growth stocks and into defensive or value-oriented positions.
Corporate Earnings and Their Influence
We are currently in an era where “earnings season” dictates the daily close for weeks at a time. When a significant portion of the index constituents report better-than-expected profits or provide optimistic guidance for the next quarter, the index receives a collective lift. If the S&P 500 closes at a record high, it is usually because the fundamental “E” (Earnings) in the P/E (Price-to-Earnings) ratio is showing strength.
Geopolitical Events and Market Sentiment
Global events—ranging from conflicts in the Middle East to trade negotiations in Asia—can cause the S&P 500 to close lower regardless of domestic economic health. Markets dislike uncertainty. A sudden geopolitical shift can lead to a “risk-off” environment, where traders sell equities and move into “safe-haven” assets like gold or U.S. Treasuries, causing the S&P to finish the day in negative territory.
How to Use Daily Closing Data in Your Investment Strategy
While checking the closing price can be a daily habit, using that data effectively requires a strategic framework. Rather than reacting to the number, investors should use it to inform their broader financial plan.
Technical Analysis: Moving Averages and Support Levels
For those who engage in more active management, the daily close is used to calculate technical indicators. One of the most common is the 200-day moving average. If the S&P 500 closes below its 200-day moving average, it is often seen as a bearish signal, suggesting a potential long-term downtrend. Conversely, staying above key “support levels” can give investors confidence that the current bull market remains intact.
Dollar-Cost Averaging (DCA)
For the majority of personal investors, the daily closing price should serve as a reminder of the power of Dollar-Cost Averaging. By investing a fixed amount of money at regular intervals, regardless of where the S&P 500 closes, you naturally buy more shares when prices are low and fewer when prices are high. This strategy removes the need to “time the market” based on daily fluctuations.
Portfolio Rebalancing
Significant movements in the S&P 500 closing price can shift your target asset allocation. If a sustained rally in the S&P means that your portfolio is now 80% stocks and 20% bonds (when your target was 70/30), the closing data tells you it is time to rebalance. Rebalancing forces you to “sell high” by trimming your winners and “buy low” by adding to underperforming assets, which is a cornerstone of disciplined wealth management.
The Broader Economic Context of the S&P 500
Finally, the S&P 500’s closing price must be viewed alongside other indices to get a full picture of the financial landscape. While the S&P 500 represents large-cap U.S. companies, the Russell 2000 tracks small-cap companies, and the Nasdaq 100 focuses heavily on innovation and technology.
Comparison with the Dow and Nasdaq
On some days, the S&P 500 may close up while the Dow Jones Industrial Average (DJIA) closes down. This divergence often happens because the Dow is price-weighted and contains only 30 companies. Comparing the S&P close to the Nasdaq close can tell you if the day’s movement was driven by broad economic strength or specifically by the tech sector. If the Nasdaq outperforms the S&P, “growth” is leading; if the S&P outperforms the Nasdaq, the market is likely leaning toward “value” and stability.
Looking Ahead: Forecasting and Indicators
The closing price is a lagging indicator—it tells us what has already happened. However, it sets the stage for the next day’s “opening gap.” Investors also look at the “VIX,” often called the “fear gauge,” which measures the market’s expectation of 30-day forward volatility based on S&P 500 index options. A high VIX coupled with a lower S&P close suggests that investors are bracing for further turbulence.
In conclusion, where the S&P 500 closes today is a vital piece of financial data that reflects the collective wisdom, fears, and expectations of millions of participants. While the daily number provides a sense of immediate direction, its true value lies in how it contributes to the long-term narrative of the market. By understanding the mechanics, drivers, and strategic applications of the closing price, investors can move beyond the “noise” of daily headlines and focus on the “signal” of long-term wealth creation. Whether today was a day of record highs or a difficult pullback, it is merely one chapter in the ongoing story of the global economy.
aViewFromTheCave is a participant in the Amazon Services LLC Associates Program, an affiliate advertising program designed to provide a means for sites to earn advertising fees by advertising and linking to Amazon.com. Amazon, the Amazon logo, AmazonSupply, and the AmazonSupply logo are trademarks of Amazon.com, Inc. or its affiliates. As an Amazon Associate we earn affiliate commissions from qualifying purchases.