
The S&P 500 is often cited as the definitive pulse of the American economy and the primary benchmark for the global equity markets. When investors ask, “What is the S&P doing?” they are usually looking for more than just a daily percentage change. They are asking about the health of corporate America, the sentiment of global investors, and the trajectory of the broader economy. To understand what the index is doing today, one must look beneath the surface of the ticker symbol and examine the fundamental, technical, and psychological factors driving its movement.
Currently, the S&P 500 is navigating a complex landscape defined by shifting interest rate expectations, the transformative potential of artificial intelligence, and a surprisingly resilient consumer base. Understanding these movements requires a deep dive into the mechanics of the index and the macroeconomic forces that act upon it.

The Mechanics of the Index: Understanding Concentration and Weighting
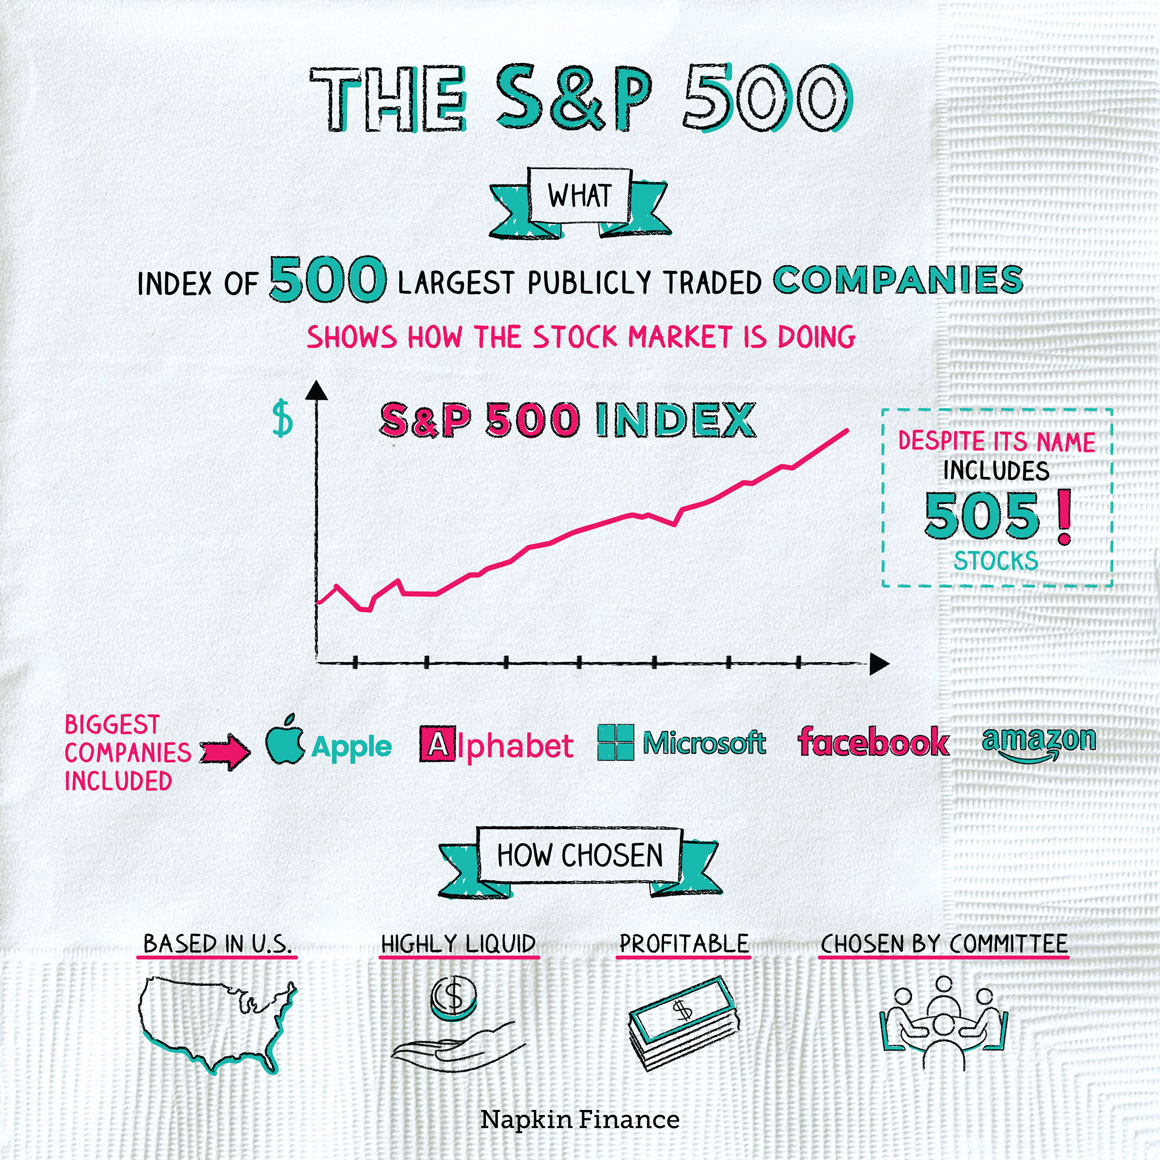
To understand what the S&P 500 is doing, you first have to understand how it is constructed. Unlike the Dow Jones Industrial Average, which is price-weighted, the S&P 500 is a float-adjusted market-capitalization-weighted index. This means that the larger a company’s market value, the more influence it has on the index’s performance.
The Rise of the Mega-Cap Influence
In recent years, the S&P 500 has become increasingly concentrated. A handful of technology giants—often referred to as the “Magnificent Seven”—now account for a significant portion of the index’s total value. When these companies move, the index moves with them. This concentration means that the S&P 500 may sometimes appear to be performing exceptionally well even if the majority of its 500 constituent stocks are flat or declining. This “top-heavy” nature is a critical factor in interpreting what the index is doing; it reflects the market’s current preference for scale, balance sheet strength, and growth potential in the tech sector.
Equal-Weight vs. Market-Cap Performance
To get a clearer picture of market breadth, analysts often compare the standard S&P 500 with its equal-weighted counterpart (RSP). When the standard index outperforms the equal-weighted version, it suggests that the largest companies are doing the heavy lifting. Conversely, when the equal-weighted index leads, it indicates a “broad-based rally” where mid-sized and smaller companies within the 500 are participating in the growth. Currently, the divergence between these two measures tells a story of selective optimism, where investors are congregating in high-quality, high-growth names while remaining cautious about the broader industrial and consumer sectors.
Macroeconomic Drivers: The Fed, Inflation, and Interest Rates
The most significant external force dictating what the S&P 500 is doing at any given moment is the Federal Reserve’s monetary policy. Equity markets and interest rates have a complex relationship, and the S&P 500 serves as the primary theater where this relationship plays out.
The “Higher for Longer” Narrative
For much of the recent period, the S&P 500 has been reacting to the “higher for longer” interest rate environment. Higher rates generally put downward pressure on stock valuations because they increase the discount rate used to value future cash flows. However, the S&P 500 has shown remarkable resilience in this environment. This suggests that investors are prioritizing corporate earnings power over the headwinds of tight monetary policy. The index’s behavior reflects a market that has largely “priced in” the current rate regime and is now looking forward to the eventual pivot toward easing.
Inflation and Corporate Profit Margins
Inflation is the other side of the Fed’s coin. The S&P 500 is doing something unique in this inflationary cycle: it is acting as a hedge. Because many of the companies in the index possess significant pricing power, they have been able to pass increased costs on to consumers, maintaining or even expanding their profit margins. When the index rises during periods of moderate inflation, it indicates that corporate America is successfully navigating the cost-push pressures that might otherwise derail the economy.
The Impact of Innovation and Earnings Growth
Beyond the macro-environment, the S&P 500 is currently a reflection of a massive technological shift. The index is increasingly being driven by fundamental earnings growth rooted in innovation, specifically within the realm of Artificial Intelligence (AI) and digital transformation.
The AI Secular Trend
If you look at the S&P 500’s performance over the last 18 months, much of the upward momentum can be attributed to the “AI trade.” Companies involved in semiconductor manufacturing, cloud computing, and software-as-a-service are seeing their valuations expand as the market bets on a massive productivity boom. The S&P 500 is currently functioning as a vehicle for capturing this secular trend. It is no longer just a “basket of stocks”; it is a bet on the next industrial revolution. This explains why the index has reached historic highs even in the face of geopolitical uncertainty and high borrowing costs.
Earnings Season as a Reality Check
While sentiment and speculation drive the index in the short term, earnings are the long-term gravity of the market. Every quarter, “what the S&P is doing” is redefined by earnings season. Currently, we are seeing a trend where companies are not just beating earnings estimates but are also providing robust future guidance. This fundamental strength provides a “floor” for the index. Even when technical indicators suggest the market is overbought, strong earnings reports act as a justification for higher price levels.
Interpreting Market Volatility and Investor Sentiment
What the S&P 500 is doing can also be viewed through the lens of psychology. The index is a living representation of the collective hopes and fears of millions of investors.
The Role of the VIX
The CBOE Volatility Index (VIX), often called the “fear gauge,” is inversely correlated with the S&P 500. When the S&P 500 is grinding higher with low volatility, it suggests a period of “complacency” or “steady accumulation.” When the index experience sharp, sudden drops, it often triggers a spike in the VIX. Currently, the S&P 500 has been characterized by relatively low volatility, suggesting that institutional investors are comfortable with the current risk-reward profile of the market.
Technical Levels and Support
From a technical analysis perspective, what the S&P 500 is doing is often defined by “key levels.” Traders look at the 50-day and 200-day moving averages to determine the trend. When the index stays above these averages, the trend is considered bullish. Currently, the index’s ability to “buy the dip” at key support levels indicates a strong underlying demand. Every time the S&P 500 pulls back, investors appear ready to deploy capital, suggesting that the “pain trade” (the move that causes the most participants to miss out) remains to the upside.
What This Means for Your Financial Strategy
Understanding what the S&P 500 is doing is only useful if it informs your personal finance and investment decisions. The current behavior of the index offers several takeaways for the modern investor.
The Power of Passive Investing
Because the S&P 500 is doing the work of capturing the winners of the modern economy, passive index fund investing remains one of the most effective strategies for long-term wealth building. By owning the S&P 500, an investor automatically gains exposure to the AI boom, the resilience of the American consumer, and the global reach of US-based multinationals. You don’t have to pick the winning stock if you own the entire benchmark.
Diversification Beyond the Top Ten
While the S&P 500 is a fantastic tool, its current “top-heavy” nature means that investors should be aware of their concentration risk. If the technology sector faces a regulatory hurdle or a valuation correction, the entire S&P 500 will feel the impact. Savvy investors are watching what the S&P is doing and using that information to decide when to diversify into other areas—such as small-cap stocks, international markets, or fixed income—to balance their portfolios.
Long-Term Perspective vs. Short-Term Noise
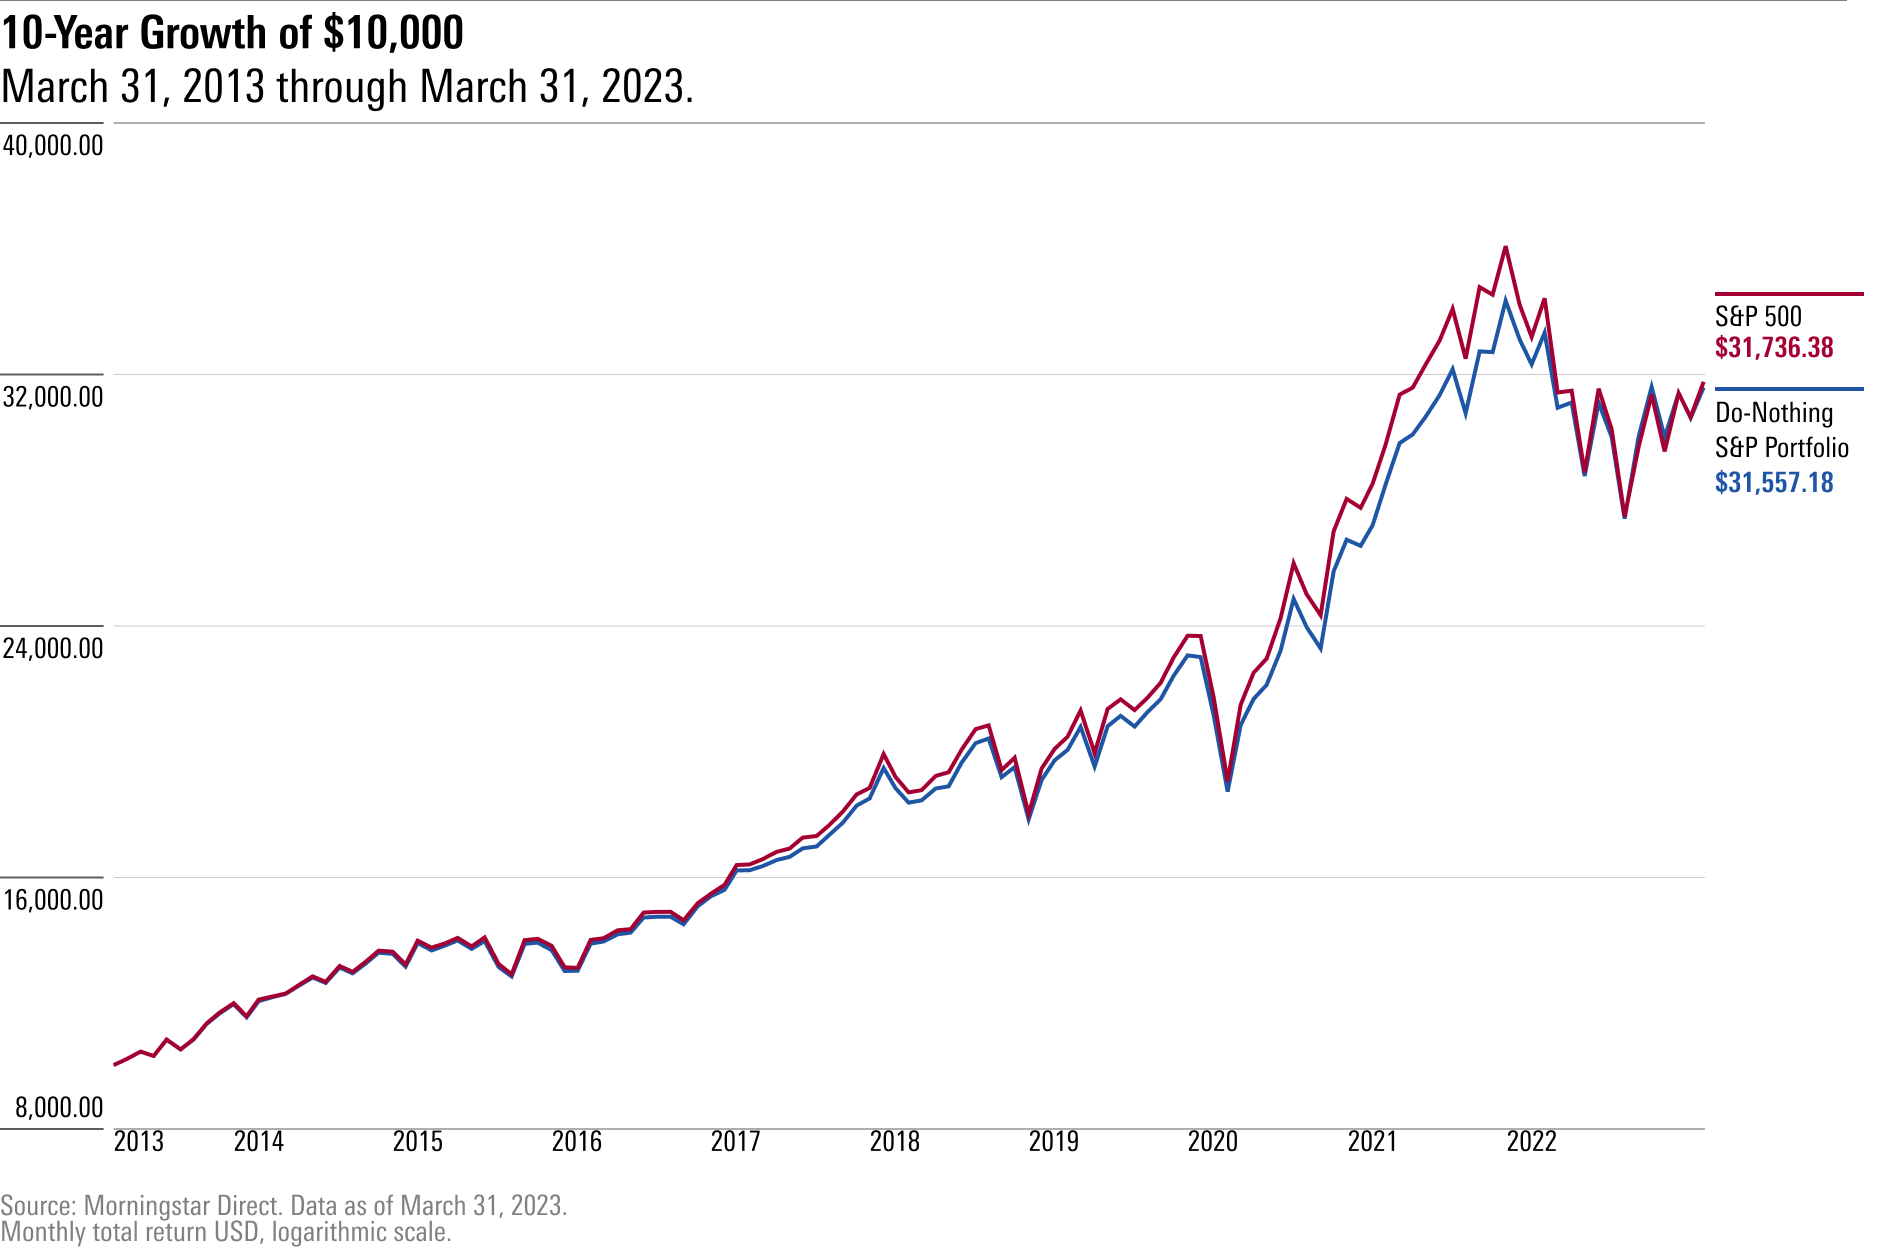
Ultimately, what the S&P 500 is doing “today” is often noise. What the S&P 500 does over “decades” is create wealth. Historically, the index has provided an average annual return of approximately 10% before inflation. The current fluctuations, whether driven by the Fed, AI hype, or geopolitical tensions, are merely chapters in a long-term story of economic expansion. For the individual investor, the goal should not be to trade the index’s daily moves, but to understand its current direction well enough to stay the course and remain invested through the cycles of the market.
aViewFromTheCave is a participant in the Amazon Services LLC Associates Program, an affiliate advertising program designed to provide a means for sites to earn advertising fees by advertising and linking to Amazon.com. Amazon, the Amazon logo, AmazonSupply, and the AmazonSupply logo are trademarks of Amazon.com, Inc. or its affiliates. As an Amazon Associate we earn affiliate commissions from qualifying purchases.