In the dynamic world of finance and business, understanding key performance indicators (KPIs) is paramount for making informed decisions. Among these, the Profitability Index (PI) stands out as a powerful tool, particularly when evaluating investment opportunities. Whether you’re an individual investor eyeing a new venture, a business owner assessing a potential project, or a finance professional seeking to optimize capital allocation, grasping the concept and application of the Profitability Index can significantly enhance your financial acumen.
The Profitability Index, also known as the Value Investment Ratio (VIR), is a capital budgeting metric used to assess the attractiveness of potential investments or projects. It measures the ratio between the present value of future cash inflows and the initial investment. In simpler terms, it tells you how much value you can expect to receive for every dollar you invest. A PI greater than 1 indicates that the project is expected to generate more value than it costs, making it a potentially profitable undertaking.

This article will delve deep into the Profitability Index, exploring its calculation, its significance in decision-making, its advantages and limitations, and how it integrates with other financial tools to paint a comprehensive picture of an investment’s viability. We’ll also touch upon its relevance across different sectors, from technology startups to established corporate ventures.
Understanding the Calculation of the Profitability Index
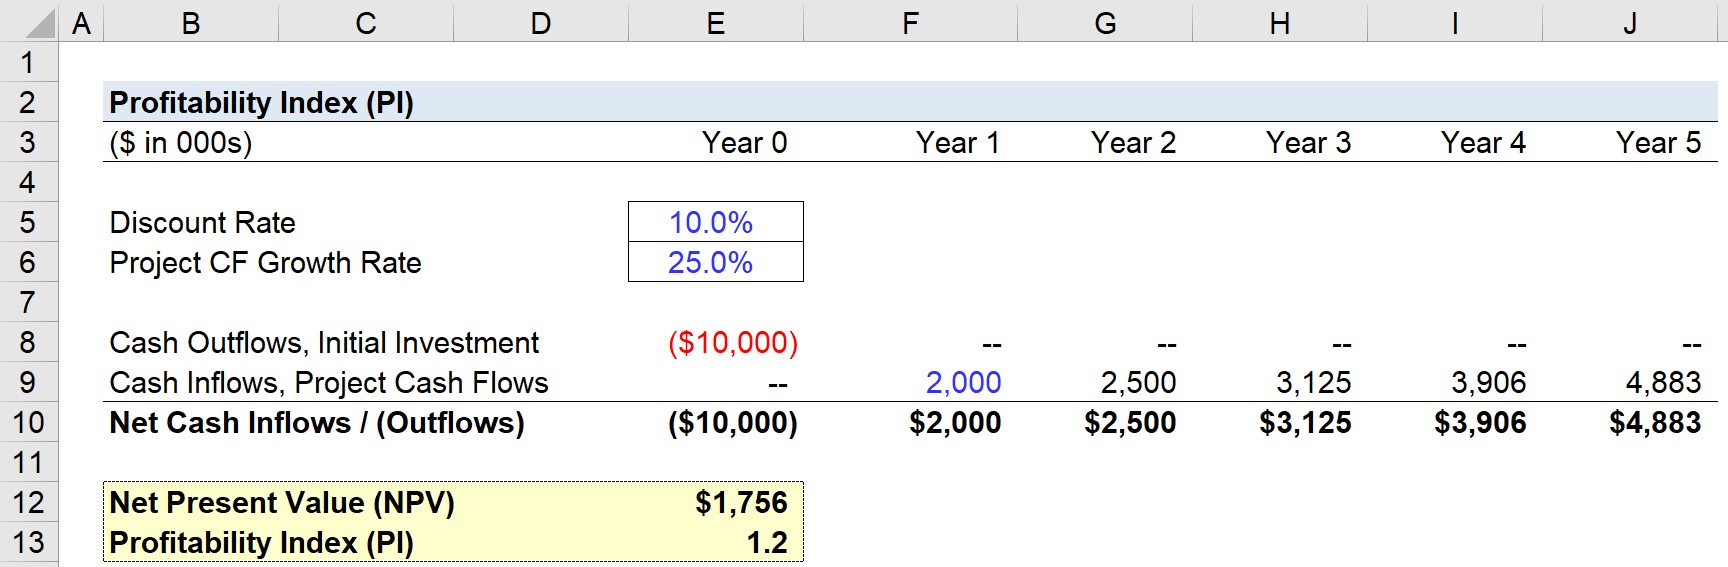
At its core, the Profitability Index is a straightforward calculation, yet its power lies in its ability to distill complex future cash flows into a single, easily digestible metric. The formula for calculating the Profitability Index is as follows:
Profitability Index (PI) = Present Value of Future Cash Inflows / Initial Investment
Let’s break down each component of this formula:
The Present Value of Future Cash Inflows
This is the most critical and often the most complex part of the PI calculation. It involves forecasting all the expected cash inflows that an investment or project is anticipated to generate over its lifespan. These cash inflows can include:
- Revenue generated from sales: The primary stream of income for most businesses.
- Cost savings: If the investment is aimed at improving efficiency or reducing operational expenses.
- Salvage value: The estimated value of an asset at the end of its useful life.
- Tax benefits: Any tax credits or deductions associated with the investment.
However, simply summing up these future cash flows is insufficient. The time value of money principle dictates that money received in the future is worth less than money received today due to inflation, opportunity cost, and risk. Therefore, each future cash inflow must be “discounted” back to its present value. This discounting process involves a discount rate, which typically represents the required rate of return or the cost of capital for the investment. A higher discount rate reflects a higher perceived risk or a greater opportunity cost.
The formula for calculating the present value of a single future cash flow is:
Present Value = Future Cash Flow / (1 + Discount Rate)^n
Where ‘n’ is the number of periods (usually years) in the future when the cash flow is expected.
For a series of future cash flows, the present value is the sum of the present values of each individual cash flow:
PV of Future Cash Inflows = Σ [Cash Flow_t / (1 + r)^t]
Where:
trepresents the specific period (year 1, year 2, etc.).ris the discount rate.Σdenotes the summation of all discounted cash flows over the project’s life.
The Initial Investment
This refers to the total upfront cost required to undertake the project or investment. It typically includes:
- Purchase price of assets: Such as machinery, equipment, or real estate.
- Installation and setup costs: Expenses incurred to get the assets operational.
- Research and development (R&D) expenses: Costs associated with developing new technologies or products.
- Working capital requirements: Funds needed to cover day-to-day operations, like inventory and accounts receivable.
- Any other direct costs incurred before the project begins generating revenue.
It’s crucial to ensure that the initial investment is also expressed in present value terms, although for most capital budgeting scenarios, the initial investment occurs at time zero, meaning its present value is equal to its face value.
Interpreting the Profitability Index
Once you have calculated the PI, its interpretation is straightforward:
- PI > 1: This signifies that the present value of the expected future cash inflows is greater than the initial investment. The project is expected to generate more value than it costs, making it a potentially profitable investment. Projects with a PI significantly greater than 1 are generally more attractive.
- PI = 1: This indicates that the present value of the future cash inflows is exactly equal to the initial investment. The project is expected to break even in terms of value creation, providing a return equal to the required rate of return. While not inherently bad, it doesn’t offer any excess value.
- PI < 1: This means that the present value of the future cash inflows is less than the initial investment. The project is expected to cost more than the value it generates, resulting in a loss. These projects should generally be rejected.
For investment decisions, especially when comparing multiple projects with different initial investment requirements, the PI is an invaluable tool. It helps in ranking projects based on their relative profitability, allowing decision-makers to prioritize those that offer the most “bang for their buck.”
The Significance of the Profitability Index in Investment Decisions
The Profitability Index is more than just a calculation; it’s a strategic tool that informs critical investment decisions across various financial contexts, from personal finance and online income ventures to large-scale corporate projects. Its ability to consider the time value of money and provide a clear, relative measure of value makes it indispensable.
Prioritizing Capital-Constrained Projects
One of the most significant strengths of the PI lies in its utility when dealing with capital rationing, a situation where a company has a limited amount of capital to invest but several potential projects vying for it. In such scenarios, simply looking at the Net Present Value (NPV) alone might lead to suboptimal decisions if projects have vastly different initial investment requirements.
For instance, Project A might have a higher NPV than Project B, but Project B might require a much smaller initial investment. If a company has to choose between them or allocate limited funds, the PI helps determine which project offers the best return per dollar invested. By ranking projects according to their PI (from highest to lowest), a company can allocate its limited capital to the most efficient investments first, maximizing the overall value generated for the available funds.
Evaluating Project Viability and Attractiveness
The PI provides a quick and effective way to gauge the fundamental attractiveness of any project. A PI greater than 1 is a strong initial signal of a project’s potential to generate positive returns. This is particularly useful in the early stages of project evaluation when screening a large number of proposals. It acts as a filter, quickly identifying potentially worthwhile opportunities and discarding those that are unlikely to be profitable.
For individuals exploring online income streams or side hustles, understanding the PI for each potential venture can be enlightening. For example, if you’re considering two online businesses, one requiring significant upfront investment in software and marketing, and another with lower startup costs but potentially slower growth, the PI can help you compare their relative efficiency and expected return on investment.
Guiding Strategic Technology Investments
In the realm of technology, where innovation and rapid obsolescence are constant factors, making wise investments is crucial. The PI can be instrumental in evaluating investments in new software, AI tools, or advanced gadgets. For a company, a PI calculation for adopting a new AI-powered customer service platform would consider the upfront cost of implementation, software licensing, training, and integration, juxtaposed against the projected benefits of reduced labor costs, increased customer satisfaction, and potential sales uplift. A PI greater than 1 would support the investment, while a PI below 1 would suggest rethinking or rejecting the proposal.
Similarly, when reviewing app development projects or investing in new hardware for a business, the PI helps quantify the potential financial upside against the initial outlay, providing a data-driven basis for decisions.
Enhancing Brand and Marketing Investment Decisions
While seemingly more abstract, brand and marketing initiatives also have financial implications that can be assessed using the PI. For a corporate identity overhaul or a major marketing campaign, the initial investment includes creative development, media buying, and implementation costs. The future cash inflows might be harder to quantify directly but could be estimated through projected increases in sales, market share, brand loyalty, and customer acquisition, all of which contribute to future revenue.
While precise PI calculations for purely intangible brand benefits can be challenging, the framework encourages a more rigorous financial assessment of marketing strategies. By forcing a consideration of future value against upfront costs, it pushes marketers and brand strategists to justify their investments with tangible financial projections. Case studies of successful brand strategies often implicitly or explicitly highlight how the long-term value generated far outstripped the initial investment, a concept that the PI aims to quantify.
Advantages and Limitations of the Profitability Index
Like any financial metric, the Profitability Index has its strengths and weaknesses. Understanding these nuances is crucial for its effective application.
Advantages of the Profitability Index
- Considers the Time Value of Money: This is a fundamental advantage. By discounting future cash flows, the PI acknowledges that a dollar today is worth more than a dollar tomorrow, leading to more realistic valuations.
- Provides a Relative Measure of Profitability: The PI expresses profitability as a ratio, making it ideal for comparing projects of different scales and initial investment sizes. It highlights which projects offer the best return per unit of investment.
- Useful for Capital Rationing: As discussed, its ability to rank projects based on efficiency makes it invaluable when capital is limited.
- Simple to Understand and Communicate: Once the calculation is done, the interpretation of the PI (greater than, equal to, or less than 1) is intuitive and easy to grasp for a wide range of stakeholders.
- Encourages Comprehensive Cash Flow Analysis: To calculate the PI accurately, one must thoroughly forecast all potential cash inflows and outflows associated with a project, promoting a detailed and disciplined approach to financial planning.
- Can be Used to Evaluate a Single Project: Even for a standalone investment, a PI greater than 1 indicates its potential profitability and its ability to meet or exceed the required rate of return.
Limitations of the Profitability Index
- Relies on Accurate Forecasts: The PI is only as good as the cash flow projections and the chosen discount rate. Inaccurate forecasts can lead to misleading results and poor investment decisions. This is particularly challenging for innovative technology projects or nascent online businesses where historical data might be scarce.
- Does Not Consider Project Scale (when used in isolation): While excellent for comparing relative efficiency, the PI doesn’t directly tell you the absolute profit in dollar terms. A project with a PI of 2 and an initial investment of $10,000 will generate a total present value of $20,000, while a project with a PI of 1.5 and an initial investment of $1,000,000 will generate a total present value of $1,500,000. In capital rationing, the higher PI project might be preferred for its efficiency, but the lower PI project might generate substantially more absolute wealth. This is where combining PI with NPV becomes essential.
- Assumes Reinvestment at the Discount Rate: The calculation implicitly assumes that any cash flows generated by the project can be reinvested at the same discount rate. This may not always be realistic.
- Ignores Non-Financial Factors: The PI is purely a financial metric. It doesn’t account for strategic fit, managerial expertise, market sentiment, environmental impact, or other qualitative aspects that might influence the success of an investment.
- Sensitivity to the Discount Rate: Small changes in the discount rate can significantly alter the PI, especially for projects with cash flows extending far into the future. Choosing the appropriate discount rate is therefore critical.
- Can be Misleading for Mutually Exclusive Projects: If two projects are mutually exclusive (you can only choose one), and one has a higher PI but a lower NPV than another, choosing based solely on PI might result in a lower overall profit in absolute terms.
Integrating Profitability Index with Other Financial Tools
To overcome some of its limitations and gain a more holistic view of investment opportunities, the Profitability Index is best used in conjunction with other financial analysis tools. This integrated approach ensures that both the efficiency and the absolute wealth-generating potential of an investment are considered.
Net Present Value (NPV)
NPV is perhaps the most complementary metric to PI. While PI shows the return per dollar invested, NPV shows the absolute dollar value that an investment is expected to add to the company or individual.
NPV = Present Value of Future Cash Inflows – Initial Investment
- When to use PI and NPV together:
- Capital Rationing: When comparing projects with different initial investments, PI is excellent for ranking efficiency. However, if two projects have similar PIs but vastly different scales, NPV helps determine which project will create more absolute wealth.
- Mutually Exclusive Projects: If you can only choose one project, NPV is generally the preferred primary decision criterion because it directly measures the wealth creation. However, if two mutually exclusive projects have very different initial investment sizes, a project with a slightly lower NPV but a significantly higher PI might be attractive if the goal is to maximize the return on a smaller capital outlay.
- Standalone Projects: For a single project, an NPV greater than zero and a PI greater than one are both positive indicators of profitability.
Internal Rate of Return (IRR)
The IRR is the discount rate at which the NPV of all cash flows (both positive and negative) from a particular project or investment equals zero. It represents the effective rate of return that an investment is expected to yield.
- Relationship between PI and IRR: Both metrics aim to assess profitability. A project with a PI greater than 1 will typically have an IRR greater than the discount rate used in the PI calculation, and vice versa.
- When to use PI and IRR together: While IRR provides a percentage return, PI provides a ratio relative to the initial investment. In cases of capital rationing, PI can be more informative than IRR when projects have different scales of investment. For instance, a small project with a very high IRR might still generate less absolute profit than a larger project with a moderate IRR.
Payback Period
The payback period is the time it takes for an investment to generate enough cash flow to recover its initial cost.
- When to use PI and Payback Period together: PI focuses on profitability over the entire project life, while the payback period focuses on liquidity and risk in the short term. A project might have a high PI but a long payback period, indicating it’s profitable but takes a long time to recoup the initial investment. Conversely, a project with a short payback period might have a low PI, meaning it recovers its cost quickly but doesn’t generate much profit beyond that. Businesses often seek a balance, considering both metrics for a comprehensive risk and return assessment.
By employing these tools in conjunction with the Profitability Index, investors and business leaders can move beyond a single perspective to create a robust framework for evaluating investment opportunities. This comprehensive approach is essential for navigating the complexities of modern finance and making strategic decisions that drive sustainable growth and profitability, whether in tech innovation, brand building, or personal finance ventures.
aViewFromTheCave is a participant in the Amazon Services LLC Associates Program, an affiliate advertising program designed to provide a means for sites to earn advertising fees by advertising and linking to Amazon.com. Amazon, the Amazon logo, AmazonSupply, and the AmazonSupply logo are trademarks of Amazon.com, Inc. or its affiliates. As an Amazon Associate we earn affiliate commissions from qualifying purchases.