
The Nasdaq Composite and the Nasdaq-100 remain the primary barometers for the global growth economy. When investors ask, “How is the Nasdaq doing?” they are usually inquiring about more than just a numerical value; they are seeking an assessment of the health of the technology sector, the risk appetite of the broader market, and the trajectory of innovation-driven capital. In the current economic landscape, the Nasdaq’s performance is a complex narrative of high-octane growth, significant valuation debates, and the overarching influence of macroeconomic policy.
The Pulse of the Market: Current Performance Metrics and Index Dynamics
To understand how the Nasdaq is doing, one must first distinguish between the Nasdaq Composite—which includes almost all stocks listed on the Nasdaq Stock Exchange—and the Nasdaq-100, which tracks the 100 largest non-financial companies. Currently, the index is navigating a period of heightened sensitivity to both internal corporate earnings and external economic indicators.
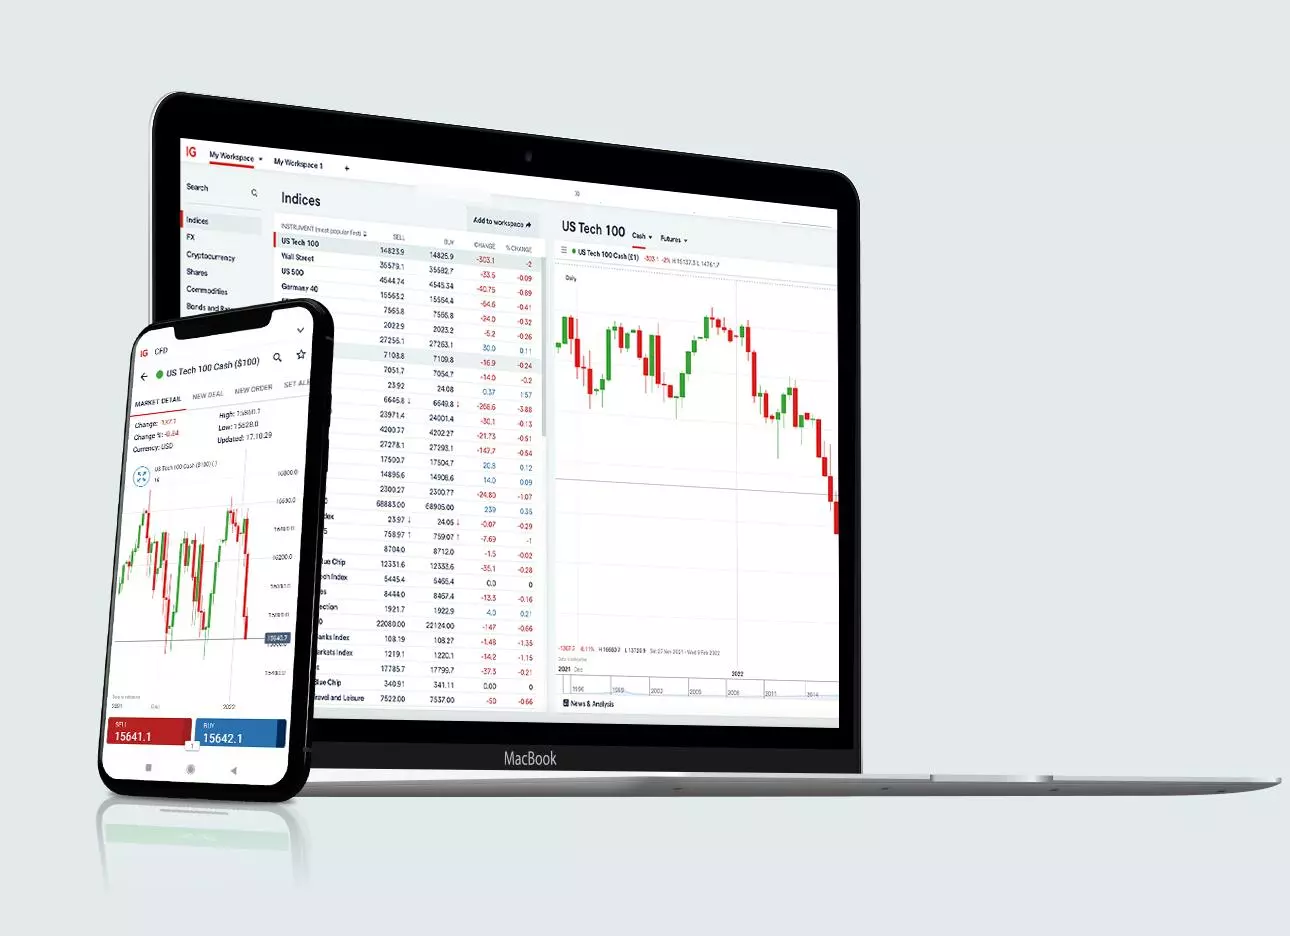
After the volatility of the early 2020s, the Nasdaq has entered a phase characterized by “rational exuberance.” While price-to-earnings (P/E) ratios remain elevated compared to historical averages for the S&P 500, they are often justified by the robust cash flows and dominant market positions of the index’s top constituents. The performance has been largely bullish, driven by a rebound in enterprise spending and a transformative surge in artificial intelligence investment. However, this upward trajectory is not without its “drawdown” periods, where profit-taking and fears of over-extension cause short-term corrections.
The Shift from Speculation to Quality
Unlike the dot-com bubble of 2000, the current “health” of the Nasdaq is supported by fundamental profitability. The companies leading the charge today—Microsoft, Apple, Alphabet, and Nvidia—are not merely “growth” stories; they are “quality” stories. They possess fortress-like balance sheets and generate massive free cash flow. This shift means that even when the index faces a downturn, the floor is often higher than in previous cycles because the underlying assets are inherently productive and profitable.
Understanding Year-to-Date Trends
On a year-to-date basis, the Nasdaq has frequently outperformed broader market indices, though this outperformance is often concentrated. Investors monitoring the index should look at the “breadth” of the market. When the Nasdaq is doing well, we see a majority of tech and biotech stocks participating in the rally. When the index is struggling or moving sideways, it is often a sign that investors are rotating out of “growth” and into “value” or “defensive” sectors like consumer staples and utilities, usually in response to rising interest rates or geopolitical uncertainty.
The Macroeconomic Landscape: Interest Rates and Inflation
The Nasdaq is notoriously sensitive to the Federal Reserve’s monetary policy. Because many companies within the index are valued based on their future cash flows, the “discount rate” applied to those earnings is critical. When interest rates rise, the present value of those future earnings drops, leading to a natural compression in stock prices.
The Federal Reserve’s Shadow
How the Nasdaq is doing is often a direct reflection of the market’s expectation of the Fed’s next move. If inflation data comes in cooler than expected, the Nasdaq tends to rally on the hope of rate cuts. Conversely, “sticky” inflation numbers often lead to sell-offs. In the current environment, the index is in a tug-of-war between strong corporate performance and a “higher-for-longer” interest rate environment. This has created a “bumpy” ride for investors, where stellar earnings reports are sometimes overshadowed by hawkish comments from central bank officials.
The Yield Curve and Tech Valuations
There is a strong inverse correlation between the 10-Year Treasury yield and Nasdaq performance. When yields climb toward multi-year highs, the cost of capital for high-growth firms increases. This affects everything from the ability of a mid-cap software firm to fund R&D to the valuation multiples the market is willing to pay for a “Magnificent Seven” giant. Monitoring the Nasdaq requires a constant eye on the bond market; if the 10-Year yield stabilizes or retreats, it typically provides the oxygen necessary for tech stocks to climb.
The Concentration Conundrum: The “Magnificent Seven” Factor
A critical aspect of the Nasdaq’s current health is its concentration. A small group of mega-cap technology stocks—Apple, Microsoft, Alphabet, Amazon, Nvidia, Meta, and Tesla—accounts for a disproportionate share of the index’s total market capitalization. This means that “how the Nasdaq is doing” is often synonymous with “how the Magnificent Seven are doing.”
The AI Revolution as a Fundamental Catalyst
Artificial Intelligence has become the single most significant driver of Nasdaq performance. Nvidia’s meteoric rise is the most visible example, but the ripple effects are felt across the entire index. From semiconductor manufacturers to cloud service providers and software-as-a-service (SaaS) companies, the promise of AI-driven productivity gains has kept the Nasdaq resilient even in the face of economic headwinds. Investors are currently betting that AI is not a bubble, but a foundational shift in the global economy, akin to the arrival of the internet.
The Risks of Heavy Concentration
While concentration has driven the index to record highs, it also presents a risk. If one or two of these giants miss earnings expectations or face significant regulatory hurdles (such as antitrust litigation), the entire index can be dragged down regardless of how the other 90+ companies are performing. This “weighting” issue led to a special rebalancing of the Nasdaq-100 in recent times to reduce the influence of the top players, yet they still remain the primary engines of the index’s movement.
Navigating the Nasdaq: Investment Strategies and Financial Tools
For the individual investor, the Nasdaq’s performance offers both opportunity and volatility. Managing a portfolio that is heavily weighted toward the Nasdaq requires a sophisticated approach to risk management and an understanding of specific financial instruments.
Utilizing ETFs and Index Funds
Most retail investors interact with the Nasdaq through Exchange Traded Funds (ETFs) like the Invesco QQQ Trust, which tracks the Nasdaq-100. This provides a diversified exposure to the tech sector without the “single-stock risk” of picking individual winners. For those looking for even more targeted exposure, there are leveraged ETFs (which amplify the index’s movements) and inverse ETFs (which allow investors to profit when the Nasdaq goes down). However, these are high-risk tools best suited for short-term tactical plays rather than long-term wealth building.
Technical Analysis: Moving Averages and Support Levels
To gauge how the Nasdaq is doing from a technical perspective, many analysts look at the 50-day and 200-day moving averages. If the index is trading above its 200-day moving average, the long-term trend is considered bullish. If it dips below, it may signal a period of consolidation or a transition into a bear market. Identifying “support levels”—prices where the index has historically stopped falling—can help investors time their entries or set stop-loss orders to protect their capital.
Dollar-Cost Averaging in a Growth Index
Because the Nasdaq is more volatile than the Dow Jones Industrial Average or the S&P 500, “timing the market” is notoriously difficult. A more effective strategy for many has been dollar-cost averaging (DCA). By investing a fixed amount of money at regular intervals, investors buy more shares when prices are low and fewer when prices are high. Given the Nasdaq’s historical tendency to recover from dips and reach new highs over long cycles, DCA allows investors to harness the index’s growth potential while smoothing out the impact of short-term volatility.
Long-Term Outlook: Innovation as a Value Driver
When assessing the long-term prospects of the Nasdaq, one must look beyond the current quarter’s earnings. The index is essentially a bet on human ingenuity and the continued digitalization of the global economy.
Emerging Sectors within the Index
While “Big Tech” dominates the headlines, the Nasdaq is also home to the future of biotechnology, renewable energy, and cybersecurity. These sectors are often less sensitive to the same factors that move the mega-cap stocks. For instance, a breakthrough in gene editing or a major shift in cybersecurity requirements due to global tensions can drive specific sub-sectors of the Nasdaq even when the broader tech market is flat.

The Role of Corporate Earnings
Ultimately, the Nasdaq’s health depends on the ability of its companies to grow their bottom lines. As long as technology remains the primary driver of global productivity, the companies within the Nasdaq are likely to remain at the forefront of wealth creation. The key for investors is to distinguish between “hype” and “sustainable growth.” Companies that can successfully integrate AI, protect their margins against inflation, and maintain a competitive “moat” will continue to support the index’s upward trajectory.
In conclusion, “how the Nasdaq is doing” is a multifaceted story. It is a story of technological triumph, macroeconomic challenges, and the shifting dynamics of global finance. While volatility is an inherent feature of the index, its long-term track record suggests that it remains the premier destination for growth-oriented capital. Investors who can look past the daily fluctuations and understand the fundamental drivers of the tech-heavy index are best positioned to navigate the complexities of the modern financial markets.
aViewFromTheCave is a participant in the Amazon Services LLC Associates Program, an affiliate advertising program designed to provide a means for sites to earn advertising fees by advertising and linking to Amazon.com. Amazon, the Amazon logo, AmazonSupply, and the AmazonSupply logo are trademarks of Amazon.com, Inc. or its affiliates. As an Amazon Associate we earn affiliate commissions from qualifying purchases.