
Understanding the Consumer Price Index (CPI) is fundamental for anyone navigating the complexities of modern finance. Whether you are an investor looking to protect your portfolio from the eroding effects of inflation, a business owner adjusting pricing strategies, or a professional seeking to understand macroeconomic trends, the CPI serves as the primary barometer for the cost of living. Often referred to as a “cost-of-living index,” the CPI measures the average change over time in the prices paid by urban consumers for a representative “market basket” of consumer goods and services.
Computing CPI is more than a mere mathematical exercise; it is an analytical process that reveals the health of an economy and the purchasing power of its currency. By mastering the calculation and the nuances behind the numbers, financial professionals can make more informed decisions regarding asset allocation, wage negotiations, and long-term financial planning.
The Mathematical Framework: The Core Formula of CPI
At its most basic level, the calculation of the Consumer Price Index is a comparison of the cost of a fixed set of goods and services across two different time periods: the base period and the current period. To compute the index, economists and financial analysts use a specific formula designed to normalize these costs into a readable index value.
The Basic CPI Formula
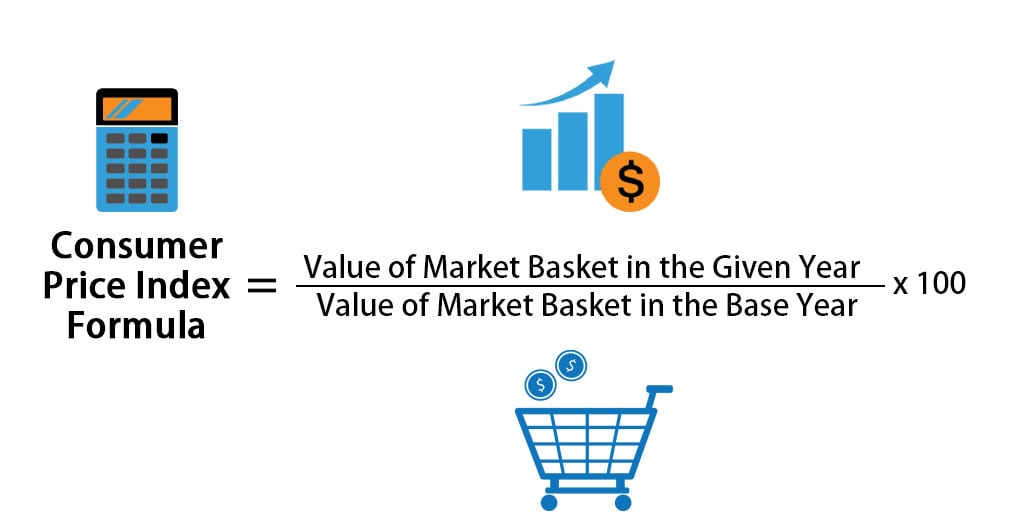
The standard formula for computing the Consumer Price Index is as follows:
CPI = (Price of Market Basket in Current Year / Price of Market Basket in Base Year) × 100
To use this formula effectively, one must understand its components. The “Market Basket” represents a collection of goods and services—ranging from milk and gasoline to rent and medical care—that reflects the typical spending habits of a consumer. The “Base Year” is a specific point in time chosen as a reference point. By convention, the base year is always assigned an index value of 100.
A Practical Illustration
Imagine a simplified economy where the market basket consists of only three items: bread, fuel, and electricity.
-
Establish the Base Year: Suppose the base year is 2020. In 2020, the total cost of this basket was $500.
-
Determine the Current Year Cost: In 2024, the cost of that exact same basket of goods has risen to $625 due to various economic pressures.
-
Apply the Formula: (625 / 500) × 100 = 125.
In this scenario, the CPI for 2024 is 125. This indicates a 25% increase in the price level compared to the base year. For a financial analyst, this number is a starting point for calculating the annual inflation rate and adjusting financial models to account for decreased purchasing power.
The Market Basket: Weighting and Categorization
Computing the CPI is not as simple as adding up prices. Not all items in a consumer’s budget carry the same weight. For instance, a 10% increase in the price of housing has a much more significant impact on a household budget than a 10% increase in the price of postage stamps. Therefore, the CPI is a weighted index.
Categorizing Consumer Spending
The Bureau of Labor Statistics (BLS) and similar global financial institutions categorize thousands of items into eight major groups. Understanding these categories is essential for identifying which sectors are driving inflation:
-
Housing: This is typically the largest component, including rent, owners’ equivalent rent, and fuels.
-
Food and Beverages: Includes groceries, dining out, and alcoholic beverages.
-
Transportation: Includes new and used vehicles, gasoline, and public transit fares.
-
Medical Care: Includes prescription drugs, hospital services, and insurance premiums.
-
Apparel: Covers clothing and footwear.
-
Recreation: Includes televisions, pets, and sports equipment.
-
Education and Communication: Includes tuition, postage, and telephone services.
-
Other Goods and Services: Includes tobacco, personal care products, and miscellaneous services.
The Importance of Weighting
Each of these categories is assigned a “weight” based on its relative importance in the average consumer’s budget. These weights are derived from extensive expenditure surveys. When computing the index, the price change for each item is multiplied by its weight before being aggregated into the final total.
For an investor, paying attention to these weights is crucial. If the CPI is rising primarily due to energy prices, the impact on a business with a high-energy manufacturing process will be far greater than on a service-based software firm. By dissecting the weights, you can perform a “bottom-up” analysis of inflationary pressures.
From Index to Inflation: Calculating the Rate of Change
While the CPI value itself is useful, financial professionals are often more interested in the “Inflation Rate,” which is the percentage change in the CPI over a specific period (usually a year or a month). This rate tells us how fast prices are rising or falling.
The Inflation Rate Formula

To compute the inflation rate between two periods, use the following formula:
Inflation Rate = [(CPI in New Period – CPI in Old Period) / CPI in Old Period] × 100
For example, if the CPI in January of last year was 280.5 and the CPI in January of this year is 294.2, the calculation would be:
[(294.2 – 280.5) / 280.5] × 100 = 4.88%
This result indicates that the cost of living increased by approximately 4.88% over the twelve-month period.
Headline vs. Core CPI
In financial reporting and central bank policy-making, you will frequently encounter the terms “Headline CPI” and “Core CPI.” Knowing the difference is vital for accurate financial forecasting.
-
Headline CPI: This is the “raw” CPI number that includes all items in the market basket. It is highly sensitive to fluctuations in the prices of food and energy.
-
Core CPI: This version excludes food and energy prices. Because food and energy are notoriously volatile and subject to temporary supply shocks (such as weather events or geopolitical conflicts), Core CPI is often considered a better measure of long-term, underlying inflation trends.
Investors often look to Core CPI to determine whether inflationary pressure is “sticky” or transitory, which in turn influences decisions on interest rates and bond yields.
Practical Applications in Business and Personal Finance
The computation of CPI is not merely for government reports; it has direct, tangible applications in the private sector and personal financial management. Mastery of this metric allows for better risk management and strategic positioning.
Real vs. Nominal Returns
One of the most critical applications of CPI is the calculation of real returns on investments. A “nominal” return is the raw percentage gain on an investment, while the “real” return is the gain adjusted for inflation.
Real Return = Nominal Return – Inflation Rate
If your stock portfolio gained 8% last year, but the CPI-calculated inflation rate was 5%, your real return was only 3%. Without computing the CPI-adjusted value, an investor might have a false sense of growth while their actual purchasing power is barely increasing. This is particularly important for fixed-income investors; if a bond pays 4% interest but inflation is 6%, the investor is effectively losing money in real terms.
Cost-of-Living Adjustments (COLA) and Contracts
In business finance, CPI is frequently used to index contracts. Many commercial leases, supply agreements, and employment contracts include “escalator clauses” tied to the CPI.
For example, a landlord might include a clause stating that the rent will increase annually based on the CPI-U (Consumer Price Index for All Urban Consumers). By understanding how to compute and track this index, a business can accurately budget for future expenses and ensure that their revenue streams keep pace with rising operational costs.
Hedging Strategies
For personal finance and institutional investing, the CPI informs hedging strategies. When the calculated CPI shows a consistent upward trend, sophisticated investors may move capital into “inflation hedges” such as Treasury Inflation-Protected Securities (TIPS), commodities, or real estate. TIPS are particularly unique because their principal value is directly adjusted based on the CPI, ensuring that the investor’s capital maintains its purchasing power regardless of how high inflation climbs.

Analyzing the Limitations: The Need for Nuance
While the CPI is a powerful tool, it is important to recognize its limitations to avoid misinterpretation. Economists identify several “biases” that can occur during the computation process:
-
Substitution Bias: When the price of one item (e.g., beef) rises, consumers often switch to a cheaper alternative (e.g., chicken). The standard CPI calculation assumes the market basket is fixed, which may overstate the actual increase in the cost of living because it doesn’t account for these shifts in consumer behavior.
-
Quality Bias: If a new smartphone costs $100 more than the previous model but offers significantly more features and better performance, the CPI might record a price increase. However, the consumer is receiving more value, which isn’t strictly “inflation.”
-
New Product Bias: The CPI market basket is updated periodically, but it may not immediately include new products that become essential to modern life, such as streaming services or advanced health technologies, until they have been in the market for some time.
Despite these nuances, the Consumer Price Index remains the most reliable and widely used metric for gauging inflation. By understanding the methodology behind its computation—from the selection of the market basket to the application of the weighted formula—you gain a clearer lens through which to view the global economy. In an era of shifting fiscal policies and market volatility, the ability to compute and interpret CPI is an indispensable skill for any financial professional or savvy investor.
aViewFromTheCave is a participant in the Amazon Services LLC Associates Program, an affiliate advertising program designed to provide a means for sites to earn advertising fees by advertising and linking to Amazon.com. Amazon, the Amazon logo, AmazonSupply, and the AmazonSupply logo are trademarks of Amazon.com, Inc. or its affiliates. As an Amazon Associate we earn affiliate commissions from qualifying purchases.