
When patients or medical students delve into the technical reports of a Positron Emission Tomography (PET) scan, they are often met with a flurry of complex terminology. Among the most critical metrics found in these oncology and neurology reports is the Standardized Uptake Value, commonly referred to as SUV. In the realm of diagnostic imaging technology, the SUV serves as the primary quantitative tool for assessing how tissues—particularly malignant ones—metabolize radiotracers. Understanding this metric requires a look into the intersection of nuclear physics, physiological data processing, and clinical software algorithms that drive modern diagnostic imaging suites.

The Technical Foundations of SUV Calculation
At its core, the Standardized Uptake Value is a ratio. It is designed to normalize the concentration of a radioactive tracer within a specific region of interest (ROI) against the distribution of that tracer throughout the entire body. Without this normalization, a PET scan would provide only visual qualitative data, which is often insufficient for monitoring the progression of diseases like cancer over time.
The Mathematical Formula and Normalization
The SUV calculation is defined by a relatively straightforward mathematical expression, though its execution relies on sophisticated software integration. The formula is:
SUV = (Radioactivity concentration in tissue [kBq/mL]) / (Injected dose [kBq] / Body weight [kg])
By incorporating the patient’s body weight and the total injected dose of the tracer (typically Fluorine-18 fluorodeoxyglucose, or FDG), the SUV allows radiologists to compare images taken at different times or on different scanner hardware. This mathematical standardization is what elevates PET scans from simple “pictures” to precise, data-driven diagnostic tools.
The Role of Body Surface Area and Lean Body Mass
While body weight is the most common denominator, modern imaging software often provides clinicians with the ability to adjust these calculations. Because adipose tissue does not metabolize glucose at the same rate as muscle or tumor tissue, high body fat percentages can artificially inflate SUV readings if weight is the only variable considered. Consequently, advanced diagnostic platforms now allow for the calculation of SUL (SUV normalized to Lean Body Mass), providing a more accurate representation of metabolic activity in patients with varying body compositions.
Software Processing and Hardware Limitations
The precision of an SUV reading is inextricably linked to the software processing power and the hardware limitations of the PET scanner. As diagnostic imaging technology evolves, the algorithms responsible for correcting errors in the raw data have become significantly more advanced, reducing noise and enhancing the reliability of the reported SUV.
Attenuation Correction and Data Acquisition
PET scanners detect the gamma rays emitted when positrons from the radiotracer collide with electrons in the body. However, as these rays travel through the patient’s tissues, they are partially absorbed or scattered—a phenomenon known as attenuation. Modern software suites utilize Computed Tomography (CT) data from PET/CT hybrid scanners to create an attenuation map. This map allows the system to mathematically “correct” the intensity of the signal, ensuring that deep-seated tumors are not underestimated simply due to their location within the body.

Time-of-Flight (TOF) Technology
One of the most significant advancements in PET scanner hardware is “Time-of-Flight” technology. By measuring the exact time difference between the detection of two photons, the software can pinpoint the origin of the decay event with much greater spatial accuracy. This enhancement leads to a higher signal-to-noise ratio, which directly improves the consistency of SUV measurements. For clinicians, this means that the SUV generated by a modern TOF-enabled scanner is inherently more reproducible than one generated by an older, non-TOF machine.
Clinical Interpretation of SUV Metrics
While the SUV is a product of sophisticated technology, its primary purpose is clinical utility. Oncologists and radiologists look at these numbers to determine how aggressively a tumor is behaving, how well a patient is responding to chemotherapy, and whether a growth is benign or malignant.
SUVmax, SUVmean, and SUVpeak
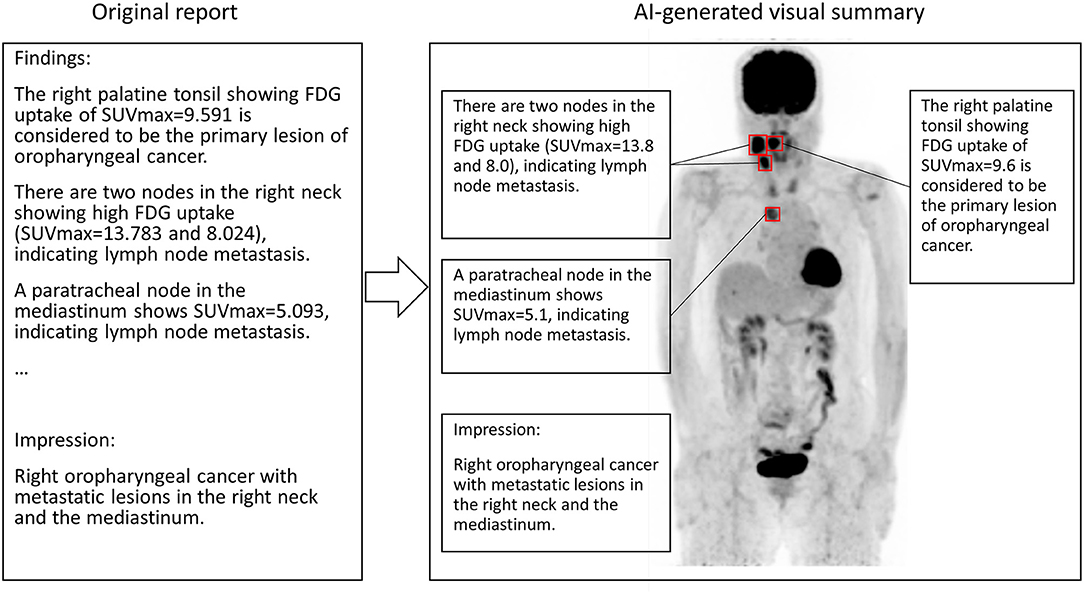
It is important to distinguish between the different ways SUV is reported. The most commonly cited figure is the SUVmax, which represents the single voxel (pixel) with the highest concentration of the radiotracer within the defined ROI. While easy to compute, it is sensitive to image noise.
To combat this, clinicians often look at the SUVpeak, which averages the uptake in a small cluster of voxels around the highest point, providing a more robust metric that is less influenced by random statistical fluctuations. SUVmean provides an average across the entire volume of the tumor, which is particularly useful for assessing the total metabolic burden of a malignancy rather than just its most active focal point.
Limitations and Variable Factors
Despite the technical elegance of the SUV, it is not an absolute diagnostic “truth.” The value can be influenced by several external factors:
- Blood Glucose Levels: Because FDG competes with glucose, a patient with high blood sugar will show lower radiotracer uptake, potentially leading to a “false negative” or a deceptively low SUV.
- Time Since Injection: The interval between the injection of the tracer and the start of the scan (the uptake period) must be strictly standardized. If a scan begins too early or too late, the SUV will not be comparable to previous baseline studies.
- Scanner Calibration: Even with rigorous software standardization, cross-calibration between different scanners—especially those from different manufacturers—remains a challenge. Institutions must conduct regular phantom studies to ensure that a unit of “kBq/mL” on one machine is equivalent to the same unit on another.
The Future of Quantitative Imaging and AI
The future of PET scanning lies in the fusion of artificial intelligence with quantitative metrics. As machine learning models become integrated into the diagnostic workflow, we are seeing a shift from simple SUV calculations to complex textural analyses.
AI-Enhanced Quantification
AI tools are currently being deployed to automate the segmentation of tumors. In the past, a radiologist had to manually draw a circle around a growth to calculate its SUV, introducing human error. Now, deep learning algorithms can identify the volume of a tumor with high precision in seconds. These AI systems can also perform “motion correction,” compensating for the patient’s breathing during the scan, which further stabilizes the SUV.
Texture Analysis and Radiomics
Beyond the single SUV number, there is a growing field called “Radiomics.” This involves using software to analyze the spatial distribution and heterogeneity of pixels within a PET image. While an SUV tells us how much tracer is being absorbed, texture analysis can tell us how varied that absorption is throughout the tumor. This level of granularity can provide insights into tumor biology, such as whether a tumor has areas of hypoxia (low oxygen) that might be resistant to standard treatments.
Conclusion
The Standardized Uptake Value is more than just a number on a medical report; it is a manifestation of the seamless integration of nuclear physics, advanced data algorithms, and precise hardware engineering. By normalizing physiological data, the SUV provides a common language for medical professionals to track the metabolic signatures of disease. As diagnostic software continues to evolve, incorporating AI-driven segmentation and advanced motion correction, the accuracy and clinical value of these measurements will only increase. For those navigating the technical aspects of medical imaging, understanding the SUV is the key to appreciating how technology translates complex subatomic events into actionable, life-saving medical data. The marriage of these digital tools with medical expertise remains the standard for modern, quantitative oncology.
aViewFromTheCave is a participant in the Amazon Services LLC Associates Program, an affiliate advertising program designed to provide a means for sites to earn advertising fees by advertising and linking to Amazon.com. Amazon, the Amazon logo, AmazonSupply, and the AmazonSupply logo are trademarks of Amazon.com, Inc. or its affiliates. As an Amazon Associate we earn affiliate commissions from qualifying purchases.