
In the rapidly evolving world of technology, from developing groundbreaking AI models to optimizing user interfaces and deploying cutting-edge software, decision-making is no longer solely reliant on intuition or guesswork. Instead, it’s driven by data. But how do tech professionals rigorously test their assumptions, validate new features, or compare the efficacy of different approaches? The answer lies in statistical hypothesis testing, a powerful framework built upon the twin pillars of the null and alternative hypotheses.
Understanding these fundamental concepts is not just an academic exercise; it’s a critical skill for anyone involved in data science, product management, software engineering, or UX design. It transforms ambiguous questions like “Is this new feature better?” into precise, testable propositions that can guide strategic choices and fuel innovation. This article will demystify the null and alternative hypotheses, exploring their roles, the framework in which they operate, their real-world applications across the tech landscape, and essential best practices for leveraging them effectively.
The Core Concepts: Pillars of Statistical Inference
At its heart, hypothesis testing is about challenging a prevailing belief or status quo with new evidence. To do this systematically, statisticians and data scientists use two complementary statements: the null hypothesis and the alternative hypothesis. These aren’t just arbitrary labels; they represent opposing views of reality that we seek to evaluate using data.
The Null Hypothesis (H₀): The Status Quo
The null hypothesis, denoted as H₀, is a statement that there is no effect, no difference, or no relationship between observed phenomena. It represents the default assumption, the status quo, or the conservative stance. In essence, it suggests that any observed variations or effects are purely due to random chance.
Consider these examples within a tech context:
-
Software Development: “The new algorithm has no significant impact on processing speed compared to the old algorithm.”
-
User Experience (UX): “The conversion rate of the new website layout is the same as the old layout.”
-
Machine Learning: “The accuracy of Model A is equal to the accuracy of Model B.”
-
Digital Security: “Implementing two-factor authentication has no effect on reducing the number of successful phishing attempts.”
The null hypothesis is what we assume to be true initially, and what we aim to either disprove or fail to disprove based on collected data. It’s the “innocent until proven guilty” statement in our statistical courtroom.
The Alternative Hypothesis (H₁ or Hₐ): The Claim of Change
The alternative hypothesis, denoted as H₁ or Hₐ, is the counter-statement to the null hypothesis. It’s the claim or assertion that we are trying to find evidence for. It suggests that there is an effect, a difference, or a relationship that is not due to random chance. This is often the researcher’s or product manager’s working hypothesis – what they hope to demonstrate.
Building on the previous examples, the alternative hypotheses would be:
-
Software Development: “The new algorithm significantly improves processing speed compared to the old algorithm.” (Or, “significantly changes processing speed” if testing for any difference).
-
User Experience (UX): “The conversion rate of the new website layout is different from (or higher than) the old layout.”
-
Machine Learning: “The accuracy of Model A is better than the accuracy of Model B.”
-
Digital Security: “Implementing two-factor authentication reduces the number of successful phishing attempts.”
The alternative hypothesis can be two-tailed (testing for any difference, e.g., “different from”) or one-tailed (testing for a specific direction, e.g., “higher than” or “lower than”). The choice depends on the specific question being asked and the nature of the expected effect.
Why We Need Both: The Dance of Evidence
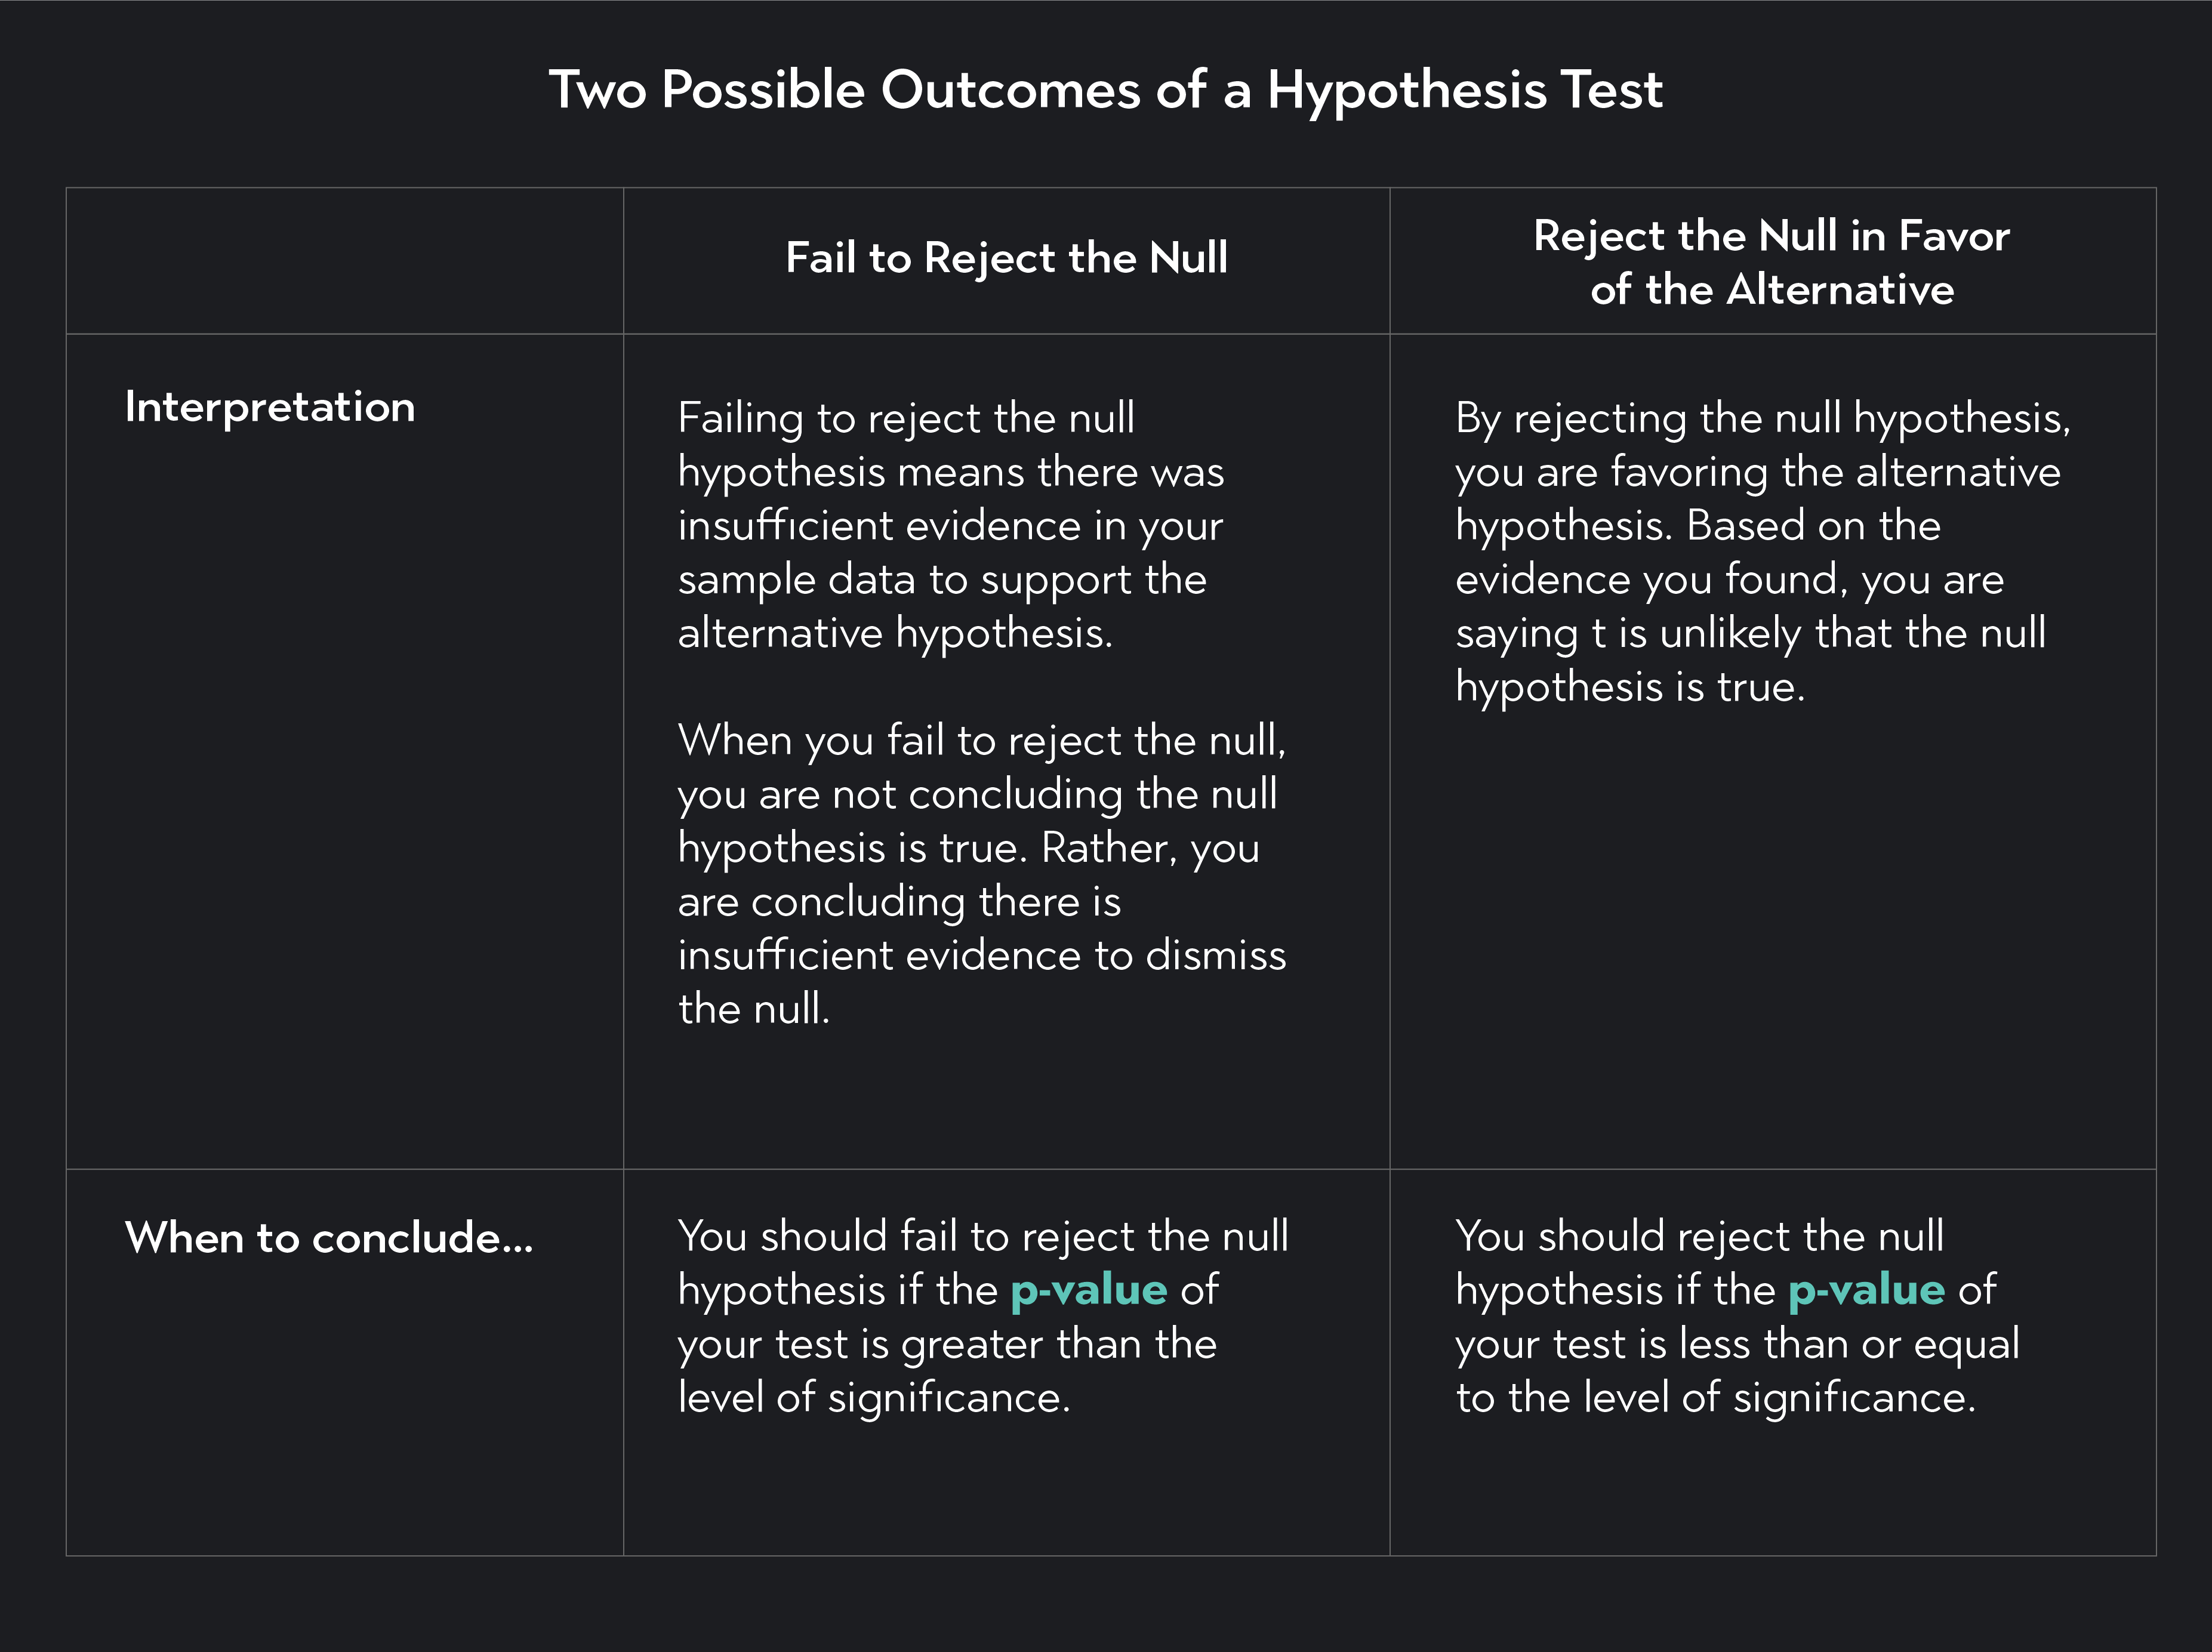
The interplay between the null and alternative hypotheses is crucial. We don’t directly “prove” the alternative hypothesis. Instead, the process involves attempting to gather enough evidence to reject the null hypothesis. If we reject the null, it implies that the alternative hypothesis is likely true. If we fail to reject the null hypothesis, it simply means we didn’t find sufficient evidence to disprove the status quo; it does not mean the null hypothesis is true, nor does it mean the alternative is false. It simply means our data wasn’t strong enough to support the alternative.
This distinction is subtle but vital. Imagine a tech company launching a new AI feature. The null hypothesis might be that the new feature has no measurable impact on user engagement compared to the previous version. The alternative hypothesis is that it does have an impact (or a positive impact). The company collects data. If the data strongly deviates from what would be expected if the null hypothesis were true, they might reject the null and conclude the new feature indeed influences engagement. If the data is close to what the null would predict, they fail to reject it, meaning there’s no strong evidence to claim an impact based on the current experiment.
The Hypothesis Testing Framework in Tech
Applying null and alternative hypotheses in a tech context follows a structured, systematic framework that transforms abstract ideas into actionable insights. This framework is the backbone of A/B testing, model validation, and other data-driven decision processes.
Formulating Hypotheses for Tech Challenges
The first step is to translate a business or technical question into precise, measurable statistical hypotheses. For instance, a product manager might ask: “Will adding a personalized recommendation engine increase the average session duration on our app?”
-
Business Question: Does the recommendation engine increase session duration?
-
Null Hypothesis (H₀): The personalized recommendation engine has no effect on the average session duration. (e.g., Average session duration with engine = Average session duration without engine).
-
Alternative Hypothesis (H₁): The personalized recommendation engine increases the average session duration. (e.g., Average session duration with engine > Average session duration without engine).
This specificity is crucial. Hypotheses must be clear, testable, and directly related to the metrics you intend to measure.
Data Collection and Experiment Design (A/B Testing)
Once hypotheses are defined, the next critical step is to design an experiment to collect relevant data. In tech, this often takes the form of A/B testing (or multivariate testing).
-
Randomization: Users are randomly assigned to a control group (seeing the current version) or one or more treatment groups (seeing the new feature or variation). This helps ensure that any observed differences are due to the change being tested, not pre-existing differences between user groups.
-
Metrics: Clearly defined Key Performance Indicators (KPIs) are essential. For our recommendation engine example, this would be “average session duration.” Other tech metrics include conversion rates, click-through rates, error rates, latency, or customer retention.
-
Sample Size: Determining an adequate sample size before starting the experiment is vital. Too small a sample might fail to detect a real effect (leading to a “Type II error”), while an excessively large sample wastes resources. Power analysis helps calculate the required sample size to detect an effect of a given magnitude with a certain probability.

Statistical Analysis and P-Values
After data collection, statistical tests are performed to analyze the results. The choice of test (e.g., t-test for comparing means, chi-squared test for comparing proportions, ANOVA for comparing multiple groups) depends on the type of data and the structure of the hypotheses. The primary output of most statistical tests is the P-value.
The P-value is the probability of observing data as extreme as, or more extreme than, what was actually observed, assuming that the null hypothesis is true. A small P-value suggests that the observed data would be very unlikely if the null hypothesis were correct, thus casting doubt on the null hypothesis.
Before running the experiment, a significance level (alpha, α) is set. This is the threshold for how much risk we’re willing to take in rejecting a true null hypothesis (a “Type I error”). Common alpha values are 0.05 (5%) or 0.01 (1%).
Making Decisions: Reject or Fail to Reject?
The final step is to compare the calculated P-value with the pre-defined significance level (α):
-
If P-value < α: We reject the null hypothesis. This means there is statistically significant evidence to support the alternative hypothesis. In our recommendation engine example, if P < 0.05, we’d conclude that the engine does significantly increase average session duration.
-
If P-value ≥ α: We fail to reject the null hypothesis. This means there is insufficient statistical evidence to support the alternative hypothesis. If P ≥ 0.05, we’d conclude that, based on our experiment, we cannot confidently say the engine increased session duration.
Crucially, “fail to reject” is not the same as “accept the null hypothesis.” It merely means the data doesn’t provide enough evidence to overturn the null’s claim. The effect might be too small to detect with the current sample size, or there genuinely might be no effect.
Real-World Applications Across the Tech Landscape
The utility of null and alternative hypotheses extends across virtually every domain within the tech industry, guiding product iterations, algorithm improvements, and marketing strategies.
Product Development and User Experience (UX)
Tech companies constantly iterate on their products and user experiences. Hypothesis testing is integral to this process:
-
Feature Rollouts: A/B testing a new feature (e.g., a simplified checkout flow) against the old one to see if it significantly increases conversion rates. H₀: New flow has no impact on conversion. H₁: New flow increases conversion.
-
UI/UX Changes: Comparing different button colors, navigation layouts, or content placements to optimize engagement or reduce bounce rates. H₀: Button color has no effect on click-through. H₁: Button color affects click-through.
-
Onboarding: Testing variations of an onboarding sequence to see which one leads to higher user activation.
Machine Learning and AI Model Optimization
In AI and machine learning, hypothesis testing helps validate model improvements and detect potential biases:
-
Model Comparison: Determining if a newly developed machine learning model (e.g., for fraud detection) performs significantly better than the existing production model in terms of accuracy, precision, or recall. H₀: Model A’s performance is equal to Model B’s. H₁: Model A’s performance is better.
-
Hyperparameter Tuning: Evaluating whether a particular set of hyperparameters yields a statistically significant improvement in model performance compared to another set.
-
Bias Detection: Testing if a model exhibits significantly different performance (e.g., higher error rates) across different demographic groups, aiding in fairness and ethical AI development. H₀: Model error rates are equal across groups. H₁: Model error rates differ across groups.
Digital Marketing and Growth Hacking
Tech companies rely heavily on digital channels for growth. Hypothesis testing allows for optimizing marketing efforts:
-
Ad Campaign Effectiveness: Testing different ad creatives, headlines, or targeting parameters to see which generates a significantly higher Click-Through Rate (CTR) or lower Cost Per Acquisition (CPA). H₀: Ad A and Ad B have the same CTR. H₁: Ad A has a higher CTR.
-
Landing Page Optimization: Comparing multiple versions of a landing page to find one that maximizes lead generation or product sign-ups.
-
Email Marketing: A/B testing subject lines, email content, or call-to-actions to improve open rates or conversion rates.
Infrastructure and Performance Tuning
Even at the backend, hypothesis testing plays a role in ensuring optimal performance and reliability:
-
Server Configuration: Evaluating if a new server configuration or database optimization significantly reduces API response times or increases system throughput. H₀: New config has no impact on response time. H₁: New config reduces response time.
-
Load Balancing: Testing different load balancing algorithms to see if one significantly improves resource utilization or latency under heavy load.
Common Pitfalls and Best Practices for Tech Professionals
While incredibly powerful, hypothesis testing can be misused, leading to erroneous conclusions. Tech professionals must be aware of common pitfalls and adhere to best practices.
Pitfalls to Avoid
-
P-hacking (Fishing for Significance): Running numerous tests and only reporting the “significant” ones, or continually tweaking hypotheses and data until a desired P-value is achieved. This inflates the chance of Type I errors.
-
Misinterpreting P-values: A P-value is not the probability that the null hypothesis is true, nor is it the probability that the alternative hypothesis is false. It’s the probability of the data given the null.
-
Ignoring Practical Significance: A statistically significant result might not be practically meaningful. A 0.1% increase in conversion might be statistically significant with a huge sample size, but negligible in business impact.
-
Insufficient Sample Sizes: Running experiments with too few participants can lead to low statistical power, meaning you might fail to detect a real effect (Type II error).
-
Not Defining Hypotheses Before the Experiment: Formulating hypotheses after seeing the data can introduce bias and invalidate the results.

Best Practices for Robust Hypothesis Testing
-
Clearly Define Your Question and Hypotheses: Start with a precise business problem and translate it into unambiguous H₀ and H₁.
-
Design Robust Experiments: Employ proper randomization, control groups, and clear metric definitions. Use tools and platforms designed for A/B testing (e.g., Optimizely, Google Optimize, internal experimentation platforms).
-
Choose Appropriate Statistical Tests: Select the right test based on your data type, distribution, and hypothesis structure. Consult with statisticians or data scientists if unsure.
-
Be Transparent About Methodology and Results: Document your hypotheses, experiment design, sample size calculations, and all results (significant or not).
-
Combine Statistical Results with Domain Expertise and Business Context: Statistical significance is a tool, not the sole determinant. Always interpret results within the broader context of your product, users, and business goals. A statistically significant result that alienates users or is too costly to implement might still be rejected.
In the dynamic landscape of technology, where every decision can have far-reaching implications, the ability to rigorously test assumptions and validate changes with data is paramount. The null and alternative hypotheses provide the foundational framework for this scientific approach. By mastering these concepts and adhering to sound testing practices, tech professionals can move beyond guesswork, drive innovation with confidence, and build products and services that truly resonate with users and achieve strategic objectives. It’s the difference between hoping for success and building it on a bedrock of validated insights.
aViewFromTheCave is a participant in the Amazon Services LLC Associates Program, an affiliate advertising program designed to provide a means for sites to earn advertising fees by advertising and linking to Amazon.com. Amazon, the Amazon logo, AmazonSupply, and the AmazonSupply logo are trademarks of Amazon.com, Inc. or its affiliates. As an Amazon Associate we earn affiliate commissions from qualifying purchases.