
In an increasingly data-driven world, understanding the relationships between different pieces of information is paramount for innovation and progress, especially within the technology sector. From refining algorithms to enhancing user experiences, the ability to discern how one factor influences another forms the bedrock of intelligent systems. At the heart of this understanding lies a fundamental statistical concept: bivariate analysis. Far from an obscure academic term, “bivariate” is a critical lens through which we can explore the intricate dance of data, providing actionable insights that power everything from predictive AI models to intuitive software designs.
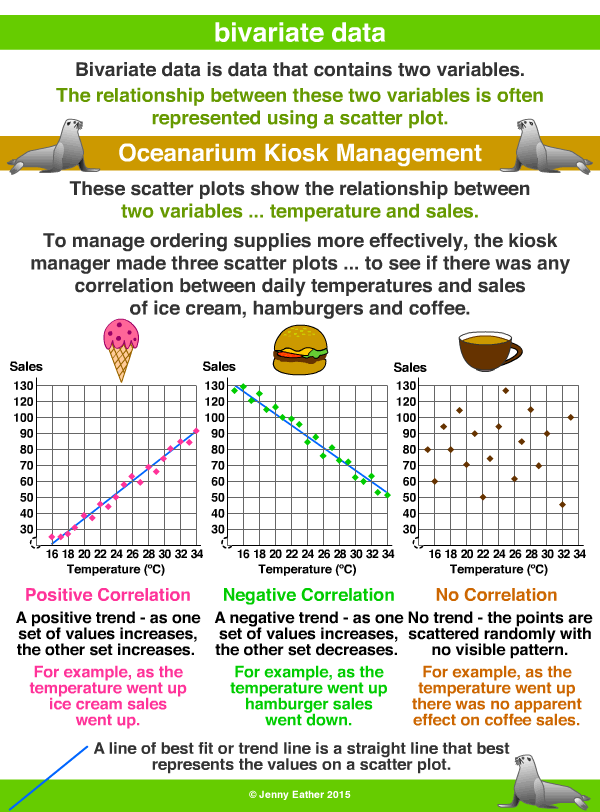
Put simply, bivariate refers to any situation involving two variables. When we engage in bivariate analysis, we are specifically examining the relationship, if any, between these two variables. Is there a correlation? Does a change in one variable seem to coincide with a change in the other? Are they independent? These are the questions that bivariate analysis seeks to answer, offering a clearer picture than examining variables in isolation. In the realm of technology, where complex systems are built upon layers of interconnected data, grasping bivariate relationships is not just advantageous—it’s essential.
The Foundation of Data Relationships in Tech
The digital age thrives on data. Every click, every input, every sensor reading generates data points that, when properly analyzed, can reveal patterns and insights. Before developers can build sophisticated AI, before product managers can optimize user flows, and before data scientists can construct complex predictive models, they must first understand the fundamental connections within their datasets. This is precisely where bivariate analysis lays its foundational stone, offering a clear, digestible method to begin unraveling the mysteries hidden within raw data.
Defining Bivariate Data
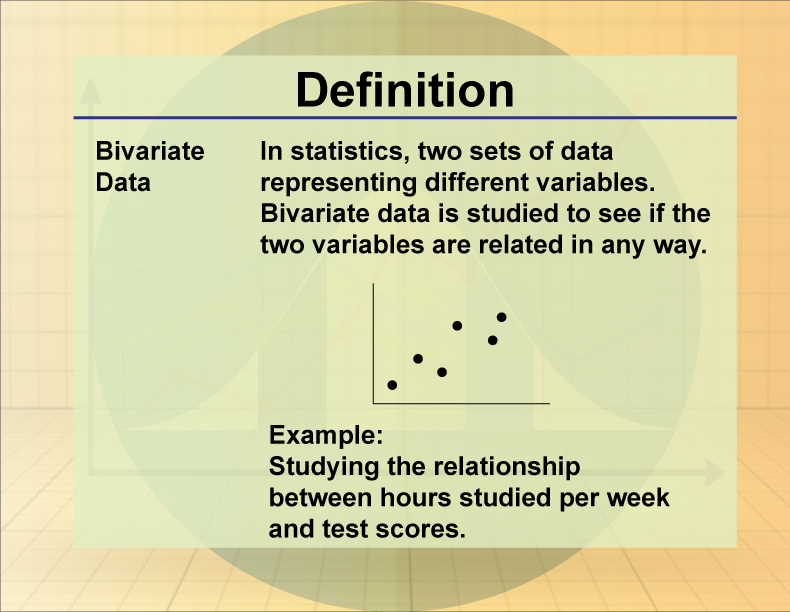
Bivariate data comprises pairs of measurements where each pair corresponds to a single subject, event, or observation. For example, in a tech context, if we measure the “number of active users” and the “daily revenue generated” for a mobile application, we are collecting bivariate data. Each day provides one pair of these two measurements. Other examples might include “processor speed” and “application launch time” for a new piece of software, or “lines of code” and “number of reported bugs” in a development project. The key is that for every instance, we have two specific, corresponding values that we want to examine together. This pairing is crucial because it allows us to investigate their interaction, rather than just their individual distributions.
Why Two Variables Matter
While univariate analysis (looking at one variable at a time) provides essential descriptive statistics like averages and distributions, it tells us nothing about how variables interact. Multivariate analysis, on the other hand, deals with three or more variables simultaneously, offering a more holistic but often more complex view. Bivariate analysis elegantly bridges this gap. It’s the simplest form of relational analysis, providing an accessible starting point for hypothesis testing and pattern discovery. For tech professionals, understanding why two variables matter boils down to causality, correlation, and prediction.
Imagine trying to improve a software product. If you only look at user satisfaction scores (one variable), you know if users are happy or not. But if you also look at the “time spent on a specific feature” (the second variable) in conjunction with satisfaction scores, you might discover that users who spend more time on Feature X are significantly less satisfied. This bivariate insight immediately points to a potential problem with Feature X, guiding developers and UX designers toward a specific area for improvement. Without this bivariate perspective, the link might remain undiscovered, or improvements might be attempted in less impactful areas. In essence, two variables allow us to move beyond mere description to understanding influence and interdependency, which is vital for informed decision-making in tech.
Bivariate Analysis in Software Development and AI
The applications of bivariate analysis are woven deeply into the fabric of modern technology, serving as an indispensable tool across various stages of software development, artificial intelligence model training, and product optimization. Its simplicity belies its power in revealing crucial insights that drive innovation and problem-solving.
Enhancing User Experience (UX) with Bivariate Insights
In the competitive landscape of applications and digital platforms, user experience (UX) is king. Bivariate analysis plays a pivotal role in understanding user behavior and preferences, allowing designers and product managers to make data-backed decisions. For instance, by analyzing the bivariate relationship between “time spent on a specific page” and “conversion rate” (e.g., signing up for a service, making a purchase), teams can identify friction points in the user journey. A high time spent but low conversion might indicate confusion, whereas a low time spent and low conversion could signal disinterest or poor navigation. Similarly, correlating “number of clicks on a button” with “user engagement scores” can reveal which UI elements are intuitive and enjoyable, and which are frustrating. These direct relationships help iterate on designs, streamline workflows, and ultimately create more satisfying and effective user experiences.
Feature Engineering and Model Performance
At the core of building robust artificial intelligence and machine learning models lies feature engineering—the process of selecting, transforming, and creating features from raw data to improve model performance. Bivariate analysis is a fundamental step in this process. Before feeding data into complex algorithms, data scientists often examine the relationship between each potential feature and the target variable (the variable the model is trying to predict). For example, if building a model to predict user churn, a data scientist might analyze the bivariate relationship between “frequency of app usage” and “churn likelihood,” or “number of customer support interactions” and “churn likelihood.” A strong correlation suggests that the feature is highly predictive and valuable for the model. Conversely, features showing little or no bivariate relationship with the target variable might be discarded or transformed, reducing model complexity and preventing noise. This targeted approach significantly enhances model accuracy and efficiency, making AI systems more intelligent and reliable.
Quality Assurance and Bug Detection
Ensuring the quality and reliability of software is paramount. Bivariate analysis offers a pragmatic approach to quality assurance (QA) and early bug detection. Consider the relationship between “number of code commits” and “number of bugs reported” within a specific module. A sudden spike in reported bugs following a period of high commit activity could indicate a rushed development cycle or a problematic new feature introduction. Teams can also analyze the bivariate relationship between “hardware specifications” (e.g., RAM, CPU) and “application crash frequency.” If crashes are disproportionately high on devices with lower RAM, it suggests a memory optimization issue. By continuously monitoring and visualizing these bivariate relationships, QA teams can proactively identify potential issues, pinpoint their probable causes, and allocate resources more effectively for testing and debugging, leading to more stable and robust software products.
Common Techniques for Bivariate Exploration
To effectively uncover the relationships between two variables in the tech context, a range of analytical techniques are employed. These methods provide both visual and statistical insights, allowing tech professionals to interpret data clearly and make informed decisions.

Visualization: Scatter Plots and Heatmaps
Visual tools are often the first line of defense in bivariate analysis, offering immediate, intuitive insights. The scatter plot is arguably the most fundamental visualization for two continuous variables. Each point on a scatter plot represents a pair of values (x, y) for an individual observation. For example, plotting “processor clock speed” against “application load time” would immediately show if faster processors generally lead to quicker load times. The pattern of the scattered points reveals the nature, direction, and strength of the relationship—whether it’s linear, non-linear, positive, negative, or non-existent.
Heatmaps, on the other hand, are excellent for visualizing relationships between two categorical variables or for showing the correlation matrix of multiple variables where each cell displays the correlation coefficient for a pair of variables. In a tech context, a heatmap could illustrate the relationship between “browser type” and “error rate,” using color intensity to denote the frequency or severity of errors. This quickly highlights which browsers might be more prone to issues with a particular application, guiding development priorities.
Correlation and Regression Analysis
While visualizations offer qualitative insights, correlation analysis provides a quantitative measure of the strength and direction of a linear relationship between two continuous variables. The Pearson correlation coefficient (r) ranges from -1 to +1. A value close to +1 indicates a strong positive linear relationship (as one variable increases, the other tends to increase), a value near -1 indicates a strong negative linear relationship (as one increases, the other tends to decrease), and a value near 0 suggests no linear relationship. For instance, a strong positive correlation between “time spent in-app” and “user retention rate” would be a valuable insight for product growth teams.
Regression analysis, particularly simple linear regression, takes this a step further. While correlation measures the strength and direction, regression attempts to model the relationship between two variables by fitting a line to the observed data. One variable (the independent or predictor variable) is used to predict the other (the dependent or response variable). In tech, this could involve predicting “server load” based on “number of concurrent users,” allowing infrastructure teams to scale resources proactively. Regression provides an equation that can be used for forecasting and understanding the magnitude of change in the dependent variable for a unit change in the independent variable.
Beyond Simple Relationships: Contingency Tables
When dealing with two categorical variables, contingency tables (also known as cross-tabulations) are the primary tool for bivariate analysis. These tables display the frequency distribution of the variables in a matrix format, where rows represent categories of one variable and columns represent categories of the other. For example, a tech company might create a contingency table of “user operating system” (iOS, Android, Web) versus “feature adoption” (adopted, not adopted). By examining the counts within each cell, and often performing a chi-square test, analysts can determine if there’s a statistically significant relationship between the choice of OS and the likelihood of adopting a specific feature. This helps in tailoring feature rollouts or marketing efforts to specific user segments based on their platform preferences.
The Evolution from Bivariate to Multivariate Analysis
While bivariate analysis is a powerful starting point, the complexity of modern technology often necessitates a more expansive view. Bivariate insights serve as crucial building blocks, enabling tech professionals to progressively tackle the multi-faceted nature of data through multivariate techniques. It’s a natural progression in the data science workflow, moving from understanding simple pairs to unraveling intricate networks of interdependencies.
Building Blocks for Complex AI Models
Modern Artificial Intelligence, particularly in areas like deep learning and sophisticated predictive analytics, rarely operates on just two variables. Instead, AI models are designed to process and learn from hundreds, thousands, or even millions of features simultaneously. However, the journey to multivariate mastery often begins with bivariate understanding. By first identifying strong bivariate relationships—for instance, between individual features and a target outcome—data scientists can perform initial feature selection, understand potential collinearity between features, and develop intuition about the data’s structure. This foundational understanding helps in pruning irrelevant features, creating new, more powerful composite features (feature engineering), and diagnosing issues within more complex models. Bivariate insights can inform hyperparameter tuning, simplify model architectures, and make complex AI systems more interpretable by highlighting the most impactful individual relationships before all variables are thrown into the predictive blender.
The Data Science Workflow
In a typical data science project, bivariate analysis fits snugly into the exploratory data analysis (EDA) phase. After data cleaning and initial univariate summaries, EDA often progresses to examining relationships between pairs of variables. This phase is less about formal hypothesis testing and more about discovery—uncovering interesting patterns, potential issues, and generating hypotheses that can later be tested with more rigorous statistical methods or modeled with machine learning algorithms.
A data scientist might start by creating scatter plots and calculating correlations for all relevant pairs of continuous variables. They would then use contingency tables and chi-square tests for categorical pairs. These bivariate insights guide subsequent steps:
-
Feature Selection: Deciding which variables are most relevant for a model.
-
Hypothesis Generation: Formulating specific questions to investigate further.
-
Data Transformation: Identifying non-linear relationships that might require transformations (e.g., log transforms) before being used in linear models.
-
Anomaly Detection: Outliers in bivariate plots can indicate data quality issues or interesting edge cases.
Thus, bivariate analysis isn’t an isolated technique but an indispensable component of the iterative and comprehensive data science workflow, enabling a gradual build-up from simple observations to sophisticated predictive and prescriptive analytics.
Leveraging Bivariate Understanding for Tech Innovation
In conclusion, “what is bivariate” is far more than a statistical definition; it is an essential concept that empowers tech professionals across all domains. From the nuanced art of user experience design to the precise science of artificial intelligence, understanding the relationships between two variables provides clarity, efficiency, and a tangible pathway to innovation.
By effectively employing bivariate analysis, tech companies can:
-
Optimize Product Development: Pinpoint specific features that drive user engagement or dissatisfaction, leading to targeted improvements.
-
Enhance AI Model Accuracy: Select the most predictive features, reducing noise and complexity for more robust algorithms.
-
Improve Operational Efficiency: Identify correlations between system metrics to preemptively address performance bottlenecks or detect potential bugs.
-
Drive Strategic Decisions: Inform business strategy with data-backed insights into market trends, user behavior, and competitive advantages.
As technology continues to evolve at a relentless pace, the ability to dissect and comprehend the complex interplay of data points will remain a cornerstone of success. Bivariate analysis, in its elegant simplicity, offers a powerful initial step in this journey, transforming raw data into actionable knowledge that fuels the next wave of technological breakthroughs. Embracing this fundamental analytical tool is not just about understanding data; it’s about building smarter, more responsive, and ultimately more impactful technology for the future.
aViewFromTheCave is a participant in the Amazon Services LLC Associates Program, an affiliate advertising program designed to provide a means for sites to earn advertising fees by advertising and linking to Amazon.com. Amazon, the Amazon logo, AmazonSupply, and the AmazonSupply logo are trademarks of Amazon.com, Inc. or its affiliates. As an Amazon Associate we earn affiliate commissions from qualifying purchases.