
The Electrocardiogram (ECG or EKG) stands as one of medicine’s most enduring and indispensable diagnostic tools. Far from a simple gadget, it represents a profound technological achievement, transforming our ability to non-invasively peer into the very electrical heart of human physiology. At its core, an ECG measures and records the electrical activity of the heart over a period, providing a graphic representation of the cardiac cycle. This seemingly straightforward measurement, however, unlocks a wealth of diagnostic information, making it a cornerstone in both emergency medicine and routine health monitoring. Understanding an ECG is to understand a sophisticated interplay of bio-electrical signals, advanced sensor technology, and increasingly, intelligent data processing, placing it squarely at the forefront of health technology.
The Core Technology: How ECGs Work
The human heart is not merely a muscle pump; it is an intricate electrical system, orchestrated by precise impulses that dictate its rhythmic contractions. An ECG machine, in essence, is a sophisticated sensor array designed to capture these minute electrical signals from the body’s surface.
Electrical Signals of the Heart
The heart’s electrical activity originates from specialized cells that generate and conduct electrical impulses. This process begins in the sinoatrial (SA) node, the heart’s natural pacemaker, which fires an impulse that spreads across the atria, causing them to contract (depolarization). This signal then travels to the atrioventricular (AV) node, where it pauses briefly before being rapidly conducted down the bundle of His, bundle branches, and Purkinje fibers to the ventricles, causing them to contract. Following contraction, the heart muscle cells recharge (repolarization) in preparation for the next beat. Each of these phases—depolarization and repolarization of the atria and ventricles—generates an electrical current that propagates through the body’s tissues and can be detected on the skin’s surface. The ECG technology capitalizes on this fundamental bio-electrical phenomenon.
Electrodes and Signal Acquisition
The process of capturing these signals begins with electrodes, small adhesive pads typically placed on specific locations on the chest, arms, and legs. These electrodes are not passive; they contain conductive gels that ensure good electrical contact with the skin, minimizing signal interference and optimizing signal transmission. Each electrode acts as an antenna, picking up the potential differences (voltages) generated by the heart’s electrical activity as it spreads through the body. Standard ECGs typically use 10 electrodes to derive 12 distinct “leads,” each lead representing a unique electrical perspective or “view” of the heart. The placement and number of electrodes are precisely calibrated to provide a comprehensive three-dimensional electrical picture of the heart’s function. The fidelity of signal acquisition is paramount; even tiny movements or poor skin contact can introduce artifacts, demonstrating the precision engineered into these devices.
Amplification and Digital Conversion
The electrical signals generated by the heart are remarkably small, often in the millivolt range. To make these signals usable for display and analysis, the raw electrical impulses picked up by the electrodes must undergo significant processing. The first step involves amplification: highly sensitive analog amplifiers boost these weak signals thousands of times, making them strong enough to be digitized. Following amplification, the analog signals are converted into digital data using an analog-to-digital converter (ADC). This digital conversion is a critical technological step, as it allows the ECG data to be processed, stored, transmitted, and analyzed by computer software. Modern ECG machines are essentially specialized computing devices, utilizing sophisticated algorithms to filter out noise (such as muscle tremors or power line interference) and present a clean, interpretable waveform on a screen or printout. This entire process, from electrode contact to digital display, occurs in real-time, showcasing the rapid data processing capabilities embedded within current ECG technology.
Interpreting the Rhythmic Language: What ECG Waveforms Reveal
The visual output of an ECG is a complex graph of waves, segments, and intervals. Each feature on this waveform correlates directly with a specific electrical event within the cardiac cycle, providing a rich dataset for diagnostic interpretation. Understanding these components is akin to deciphering the heart’s electrical language.
P Waves, QRS Complexes, and T Waves
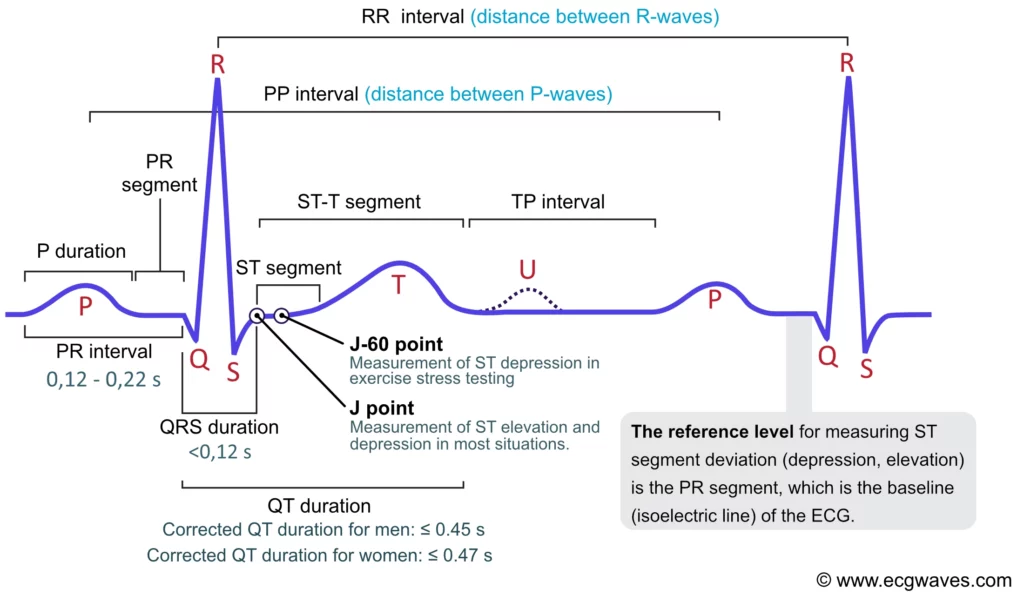
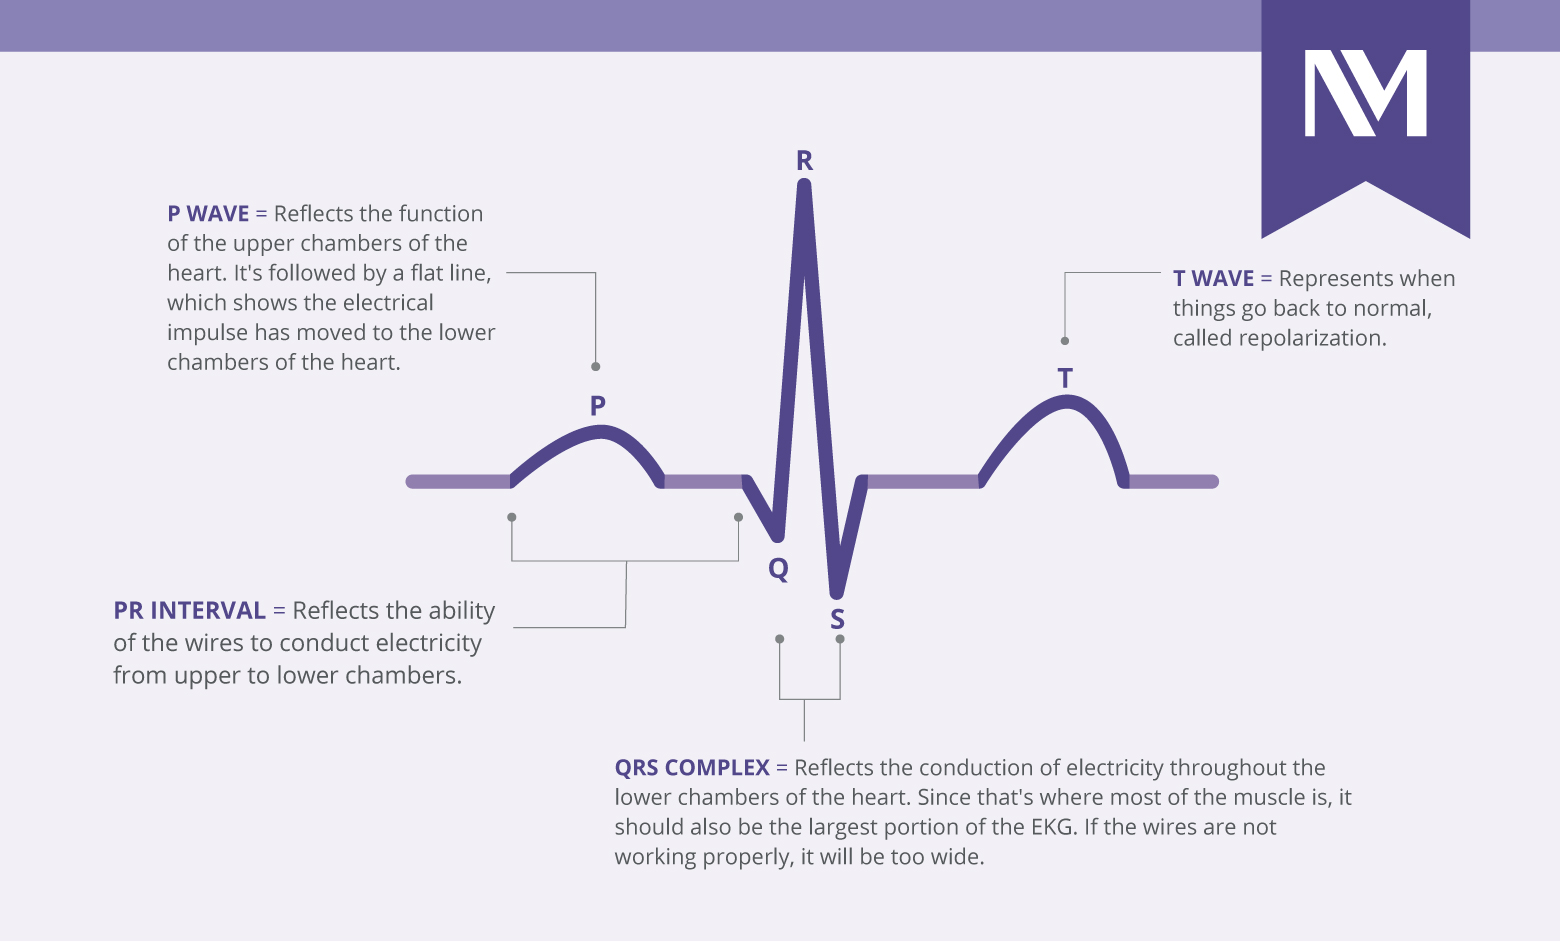
The most prominent features on an ECG strip are the P wave, QRS complex, and T wave, each representing a distinct electrical phase:
-
P Wave: This small, rounded wave represents atrial depolarization, the electrical impulse spreading through the atria, causing them to contract. A normal P wave indicates that the impulse originated in the SA node and spread correctly through the atria. Abnormalities in the P wave can suggest atrial enlargement or problems with atrial conduction.
-
QRS Complex: This larger, sharper complex signifies ventricular depolarization, the electrical impulse spreading through the ventricles, causing them to contract and pump blood. The QRS complex is typically the most prominent feature because the ventricular muscle mass is much larger than the atrial mass. Variations in the Q, R, and S waves can indicate a wide range of conditions, from myocardial infarction (heart attack) to bundle branch blocks.
-
T Wave: This wave represents ventricular repolarization, the electrical recovery of the ventricles before the next beat. The T wave is typically upright and rounded. Changes in its morphology, such as flattening, inversion, or peaking, can be critical indicators of conditions like ischemia (reduced blood flow) or electrolyte imbalances.
Intervals and Segments
Beyond individual waves, the time durations between waves (intervals) and the sections between waves (segments) provide crucial timing information about the heart’s electrical conduction system:
-
PR Interval: Measures the time from the beginning of atrial depolarization (P wave) to the beginning of ventricular depolarization (QRS complex). This interval reflects the time it takes for the electrical impulse to travel from the atria through the AV node to the ventricles. A prolonged PR interval can indicate an AV block, where conduction through the AV node is delayed.
-
QT Interval: Measures the time from the beginning of ventricular depolarization (QRS complex) to the end of ventricular repolarization (T wave). This interval represents the total time for ventricular activation and recovery. An abnormally prolonged or shortened QT interval can indicate a risk of serious ventricular arrhythmias.
-
ST Segment: The segment between the end of the QRS complex and the beginning of the T wave. This period represents the plateau phase of ventricular repolarization, where the ventricles are fully depolarized. The ST segment is normally isoelectric (at the baseline). Deviations (elevation or depression) from the baseline are critical diagnostic markers for myocardial ischemia or infarction.
Baseline and Amplitude
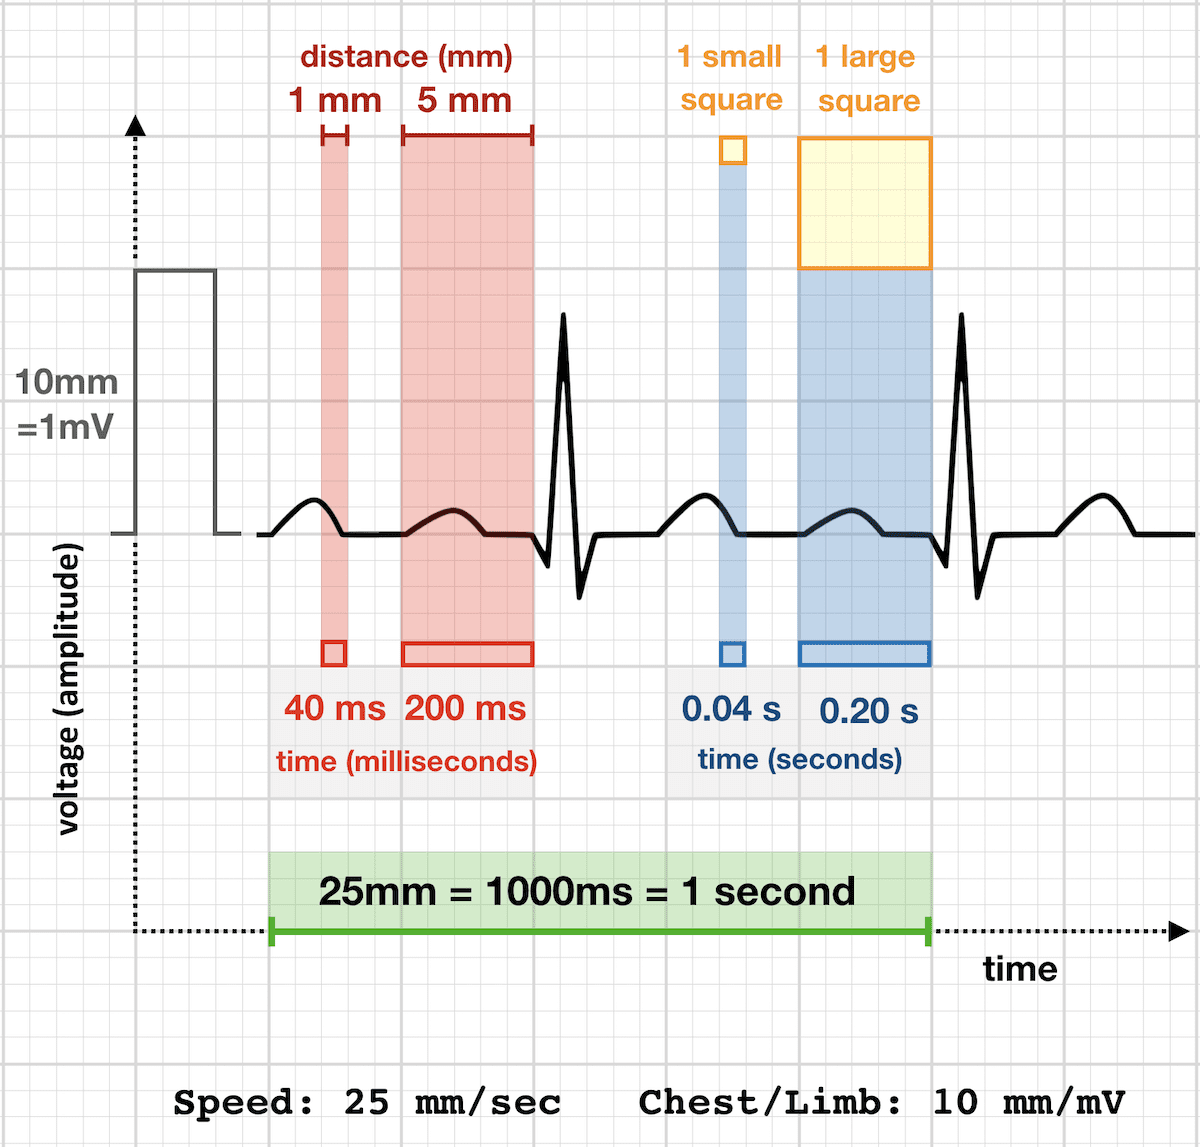
The horizontal baseline (isoelectric line) on the ECG tracing serves as the reference point for all electrical activity. Deviations from this baseline, particularly in the ST segment, are highly significant. The amplitude (height) of the waves indicates the strength of the electrical impulse. Abnormal amplitudes can suggest issues like ventricular hypertrophy (enlargement) or even fluid around the heart (pericardial effusion) that dampen electrical signals. Together, these waveform characteristics provide a dynamic, real-time snapshot of the heart’s electrical health, allowing clinicians to deduce its functional status and identify potential pathologies.
Beyond Basic Rhythms: Advanced Applications of ECG Technology
While foundational to understanding heart rhythm, the technological sophistication of the ECG allows it to detect far more than just regular or irregular beats. It serves as a powerful diagnostic platform for a multitude of cardiac conditions.
Detecting Arrhythmias and Conduction Abnormalities
The primary strength of an ECG lies in its ability to identify and characterize arrhythmias—any deviation from the normal heart rhythm. This includes:
-
Bradycardia and Tachycardia: Abnormally slow or fast heart rates.
-
Atrial Fibrillation (AFib): A common arrhythmia characterized by chaotic electrical activity in the atria, leading to irregular and often rapid ventricular responses. The absence of distinct P waves and an irregularly irregular rhythm on the ECG are tell-tale signs.
-
Ventricular Tachycardia (VT) and Ventricular Fibrillation (VFib): Life-threatening arrhythmias originating in the ventricles, often leading to hemodynamic collapse. ECG patterns are distinct and immediately recognizable, guiding emergency interventions.
-
Heart Blocks: Conditions where the electrical impulse from the atria to the ventricles is partially or completely blocked. Different degrees of AV block (first, second, and third-degree) each have characteristic ECG signatures involving the PR interval and the relationship between P waves and QRS complexes.
-
Bundle Branch Blocks: Impairment of conduction through one of the main electrical pathways within the ventricles, leading to widened QRS complexes and specific morphological changes.
Diagnosing Ischemia and Infarction
One of the most critical applications of ECG technology is in the rapid diagnosis of myocardial ischemia (reduced blood flow to the heart muscle) and myocardial infarction (heart attack, where heart muscle tissue dies due to prolonged ischemia). The ECG provides immediate, objective evidence:
-
ST Segment Elevation Myocardial Infarction (STEMI): Characterized by significant elevation of the ST segment, indicating acute, complete blockage of a coronary artery. This is a medical emergency requiring immediate intervention.
-
Non-ST Segment Elevation Myocardial Infarction (NSTEMI) and Unstable Angina: While not showing ST elevation, these conditions can present with ST segment depression, T-wave inversions, or other dynamic changes on the ECG, also indicative of myocardial ischemia or injury. The pattern of changes across different leads helps pinpoint the location of the affected area of the heart.
Assessing Structural Heart Disease
Although primarily an electrical assessment tool, the ECG can offer indirect clues about the heart’s physical structure:
-
Ventricular Hypertrophy: Enlargement of the heart ventricles, often due to chronic high blood pressure or valve disease, can manifest as increased amplitude of the QRS complexes in certain leads, along with other specific changes.
-
Atrial Enlargement: Similar to ventricular hypertrophy, enlarged atria can produce changes in the P wave morphology (e.g., taller or wider P waves).
-
Axis Deviation: The mean electrical axis of the heart can be calculated from the ECG, and deviations (left or right axis deviation) can suggest underlying conditions such as ventricular hypertrophy, conduction defects, or even pulmonary disease. While not a direct imaging technique, these electrical inferences guide further diagnostic steps.
The Evolution of ECG Technology: From Analog to AI
The journey of the ECG began with Willem Einthoven’s string galvanometer in the early 20th century, a bulky and complex apparatus. Today, it has evolved into a sleek, digital, and often connected device, showcasing incredible advancements in medical technology.
Wearable ECGs and Remote Monitoring
A significant leap in ECG technology has been its integration into everyday consumer gadgets, particularly smartwatches and wearable patches. Devices like the Apple Watch, Fitbit, and dedicated personal ECG monitors now offer single-lead ECG capabilities, allowing users to record their heart rhythm at home or on the go. This miniaturization and accessibility have democratized basic cardiac monitoring. Remote patient monitoring systems leverage these wearable ECGs, wirelessly transmitting data to healthcare providers. This paradigm shift enables continuous or on-demand monitoring, facilitating early detection of arrhythmias that might be intermittent and missed during a standard clinic visit. These devices represent a convergence of sensor technology, battery efficiency, wireless communication, and user-friendly app interfaces, pushing the boundaries of personal health tech.
AI and Machine Learning in ECG Analysis
The sheer volume of data generated by continuous ECG monitoring, coupled with the complexity of interpreting subtle patterns, has made ECG a prime candidate for artificial intelligence (AI) and machine learning (ML) applications. AI algorithms are now being trained on vast datasets of ECG recordings, enabling them to:
-
Automate Detection: Identify common arrhythmias like atrial fibrillation with high accuracy, often surpassing human detection speed.
-
Enhance Diagnostic Precision: Detect subtle indicators of disease (e.g., early signs of heart failure or valvular disease) that might be overlooked by the human eye.
-
Predict Future Events: Research is exploring AI’s ability to predict the risk of future cardiovascular events, such as heart attacks or strokes, based on nuanced ECG patterns.
-
Reduce Workload: Provide a first-pass analysis, flagging critical findings for clinicians and streamlining the diagnostic workflow in busy settings.
This integration of AI transforms the ECG from a mere recording device into an intelligent diagnostic assistant, augmenting human expertise and improving diagnostic efficiency.
Interoperability and Digital Health Ecosystems
Modern ECG machines are rarely standalone devices. They are integral components of larger digital health ecosystems. This involves:
-
Electronic Health Records (EHRs): ECG data is seamlessly integrated into a patient’s EHR, providing a comprehensive view of their cardiac history and facilitating longitudinal tracking.
-
Cloud-Based Storage and Analysis: ECG data can be securely uploaded to cloud platforms, enabling remote access for specialists and facilitating large-scale research.
-
Telemedicine Platforms: ECGs can be performed in remote clinics or homes, with the data transmitted for immediate expert review, expanding access to cardiac care.
-
Cybersecurity: As ECG data becomes more interconnected, robust digital security measures are paramount to protect patient privacy and data integrity, ensuring compliance with regulations like HIPAA. This technological shift underscores the importance of a secure and interoperable digital infrastructure for healthcare.
The Future of ECG: Smarter, More Accessible, and Predictive
The trajectory of ECG technology points towards an even more integrated, intelligent, and proactive role in healthcare. Its evolution is characterized by a drive for greater accuracy, broader accessibility, and the ability to predict health events before they become critical.
Personalized Cardiac Health Management
The future of ECG technology will increasingly focus on personalized health management. Continuous, AI-powered ECG monitoring, particularly through advanced wearables and implantable devices, will gather individualized baseline data. Deviations from a patient’s unique electrical fingerprint could trigger early alerts, enabling proactive interventions. This shift from reactive diagnostics to preventative and personalized cardiac care promises to revolutionize how individuals manage their heart health, moving beyond generic guidelines to tailored recommendations based on real-time physiological data.
Enhanced Diagnostic Capabilities
Future advancements will likely see ECG technology moving beyond surface-level electrical activity. Integration with other biosensors, advanced signal processing techniques (e.g., spatial vectorcardiography in a clinical setting), and multi-modal data fusion could allow ECG to infer even more subtle physiological states. Imagine an ECG not just detecting a heart attack but predicting its likelihood hours or days in advance by identifying imperceptible changes in repolarization patterns or autonomic nervous system balance. The advent of quantum sensing technologies or bio-resonant principles might even push the boundaries of what an ECG can measure, offering unprecedented insights into cellular-level cardiac function.
In conclusion, an ECG measures the electrical activity of the heart, but this seemingly simple function belies the depth of information it provides and the technological sophistication underpinning its operation. From detecting fundamental rhythms and life-threatening arrhythmias to identifying signs of ischemia and structural changes, the ECG remains a vital diagnostic tool. Its ongoing evolution, driven by miniaturization, AI integration, and seamless digital connectivity, ensures its continued relevance as a cornerstone of health technology, promising a future where cardiac health monitoring is smarter, more accessible, and profoundly predictive.
aViewFromTheCave is a participant in the Amazon Services LLC Associates Program, an affiliate advertising program designed to provide a means for sites to earn advertising fees by advertising and linking to Amazon.com. Amazon, the Amazon logo, AmazonSupply, and the AmazonSupply logo are trademarks of Amazon.com, Inc. or its affiliates. As an Amazon Associate we earn affiliate commissions from qualifying purchases.