
In the dynamic and often opaque world of finance, the pursuit of clarity, precision, and predictive power is relentless. Enter quantitative analysis – a methodology that transforms the art of financial decision-making into a science. At its core, quantitative analysis is the application of mathematical, statistical, and computational methods to financial data to understand past behavior, predict future outcomes, and make informed decisions. It’s the engine driving much of modern finance, from individual investment strategies to global economic forecasting and risk management.
Often associated with the enigmatic “quants” who wield complex algorithms, quantitative analysis is far more pervasive than just high-frequency trading desks. It permeates every aspect of financial activity, offering a framework for objectivity in a realm traditionally influenced by intuition and sentiment. By systematically dissecting market data, economic indicators, and company financials, quantitative analysis unearths patterns, correlations, and causal relationships that might otherwise remain hidden, providing a robust foundation for strategic action.

The Foundation of Data-Driven Finance
At its heart, quantitative analysis is about objectivity. It replaces gut feelings and speculative theories with hard numbers and empirical evidence. This disciplined approach enables financial professionals to navigate the complexities of markets with greater confidence and accuracy.
Defining Quantitative Analysis
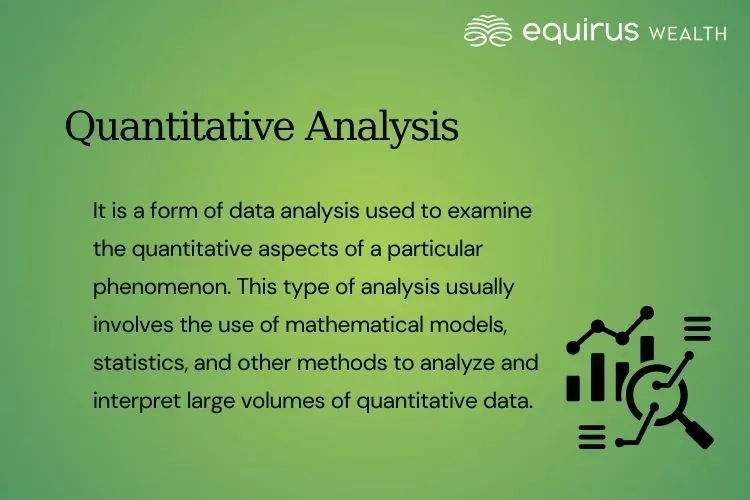
Quantitative analysis (QA), also known as “quant” analysis, is a methodical approach that uses mathematical models, statistical inference, and computational techniques to process and interpret large financial datasets. Its primary goal is to derive measurable insights and objective conclusions that can inform financial strategies, investments, and risk assessments. Unlike qualitative analysis, which relies on subjective factors like management quality or brand reputation, QA focuses exclusively on measurable quantities, such as stock prices, trading volumes, interest rates, and economic indicators. This scientific rigor allows for the systematic testing of hypotheses and the development of predictive models.
From Raw Data to Actionable Insights
The journey of quantitative analysis begins with vast amounts of raw data. This can include historical stock prices, macroeconomic indicators (GDP, inflation rates), company financial statements, currency exchange rates, bond yields, and even alternative data sources like satellite imagery or social media sentiment. The challenge lies not just in collecting this data, but in transforming it into meaningful, actionable insights.
This transformation involves several stages: data cleaning and preprocessing to remove errors and inconsistencies, exploratory data analysis to identify initial patterns and anomalies, and then the application of sophisticated statistical and mathematical models. These models are designed to identify underlying relationships, forecast future trends, and quantify uncertainties. The ultimate output is often a specific recommendation: a buy/sell signal for a stock, an optimal portfolio allocation, a risk exposure assessment, or a forecast of a particular economic variable.
Key Principles and Methodologies
Quantitative analysis rests on several fundamental principles and methodologies. Statistical modeling is paramount, involving techniques such as regression analysis, time series analysis, and hypothesis testing to identify relationships between variables and predict future values. Econometrics, a specialized branch, applies statistical methods to economic data to test theories and forecast economic trends.
Optimization techniques are crucial for tasks like portfolio construction, where the goal is to maximize returns for a given level of risk, or minimize risk for a target return. Probability theory and stochastic calculus are vital for modeling asset prices and understanding the random, unpredictable nature of financial markets, particularly in derivatives pricing. Furthermore, computational methods, ranging from basic spreadsheets to advanced algorithms run on high-performance computing clusters, are essential for handling the sheer volume and complexity of financial data.
Core Applications in the Financial World
The utility of quantitative analysis spans across virtually every facet of the financial industry, providing critical insights and competitive advantages.
Investment Management and Strategy
Perhaps the most visible application of quantitative analysis is in investment management. “Quants” develop models to identify undervalued assets, predict market movements, and construct optimized portfolios. This includes:
-
Algorithmic Trading: Programs that execute trades automatically based on predefined criteria, often at high speeds.
-
High-Frequency Trading (HFT): A subset of algorithmic trading that executes an enormous number of orders at extremely high speeds, leveraging minor price discrepancies.
-
Portfolio Optimization: Using mathematical models to select the best mix of assets to achieve specific financial goals, balancing risk and return.
-
Factor Investing: Identifying specific characteristics (factors like value, growth, momentum, quality) that have historically driven superior returns and building portfolios around them.
-
Derivatives Pricing: Complex mathematical models (e.g., Black-Scholes model) are used to price options, futures, and other derivatives.
These applications allow fund managers to move beyond traditional fundamental or technical analysis, relying instead on data-driven approaches to generate alpha.
Risk Management and Compliance
For any financial institution, managing risk is paramount. Quantitative analysis provides the tools to measure, monitor, and mitigate various types of financial risk:
-
Market Risk: The risk of losses due to adverse movements in market prices (e.g., interest rates, exchange rates, equity prices). Techniques like Value at Risk (VaR) and Conditional VaR (CVaR) quantify potential losses over specific periods.
-
Credit Risk: The risk that a borrower will default on their obligations. Models assess the probability of default, loss given default, and exposure at default for loans and bonds.
-
Operational Risk: The risk of losses resulting from inadequate or failed internal processes, people, and systems, or from external events. Quantitative methods can help estimate the frequency and severity of such events.
-
Stress Testing: Simulating extreme market conditions to assess the resilience of portfolios and financial institutions.
-
Regulatory Compliance: Ensuring adherence to financial regulations (e.g., Basel Accords for banks) often requires sophisticated quantitative models for capital adequacy calculations and reporting.
Business Finance and Valuation
Beyond trading and portfolio management, quantitative analysis is crucial for corporate financial decisions and asset valuation:
-
Financial Modeling: Creating detailed financial models for forecasting revenue, expenses, cash flows, and profitability to support strategic planning, budgeting, and investment decisions (e.g., capital budgeting).
-
Mergers and Acquisitions (M&A): Valuing target companies using discounted cash flow (DCF) models, comparable company analysis, and precedent transaction analysis, all of which rely heavily on quantitative inputs and assumptions.
-
Asset Valuation: Determining the fair value of various assets, from real estate to intellectual property, using quantitative methods.
-
Forecasting: Predicting future business performance based on historical data and economic trends to aid in resource allocation and strategic positioning.
Economic Forecasting and Market Analysis
At a macro level, quantitative analysis is indispensable for understanding and predicting broader economic trends:
-
Macroeconomic Models: Developing econometric models to forecast GDP growth, inflation rates, unemployment figures, and interest rate movements.
-
Market Sentiment Analysis: Using natural language processing (NLP) to analyze news articles, social media, and earnings call transcripts to gauge market sentiment and predict its impact on asset prices.
-
Trade Flow Analysis: Studying international trade data to understand economic interdependencies and predict global economic shifts.
-
Commodity Price Prediction: Developing models to forecast prices of oil, gold, agricultural products, and other commodities based on supply, demand, and geopolitical factors.
The Tools and Technologies Empowering Quants
The sophistication of quantitative analysis is inextricably linked to the advanced tools and technologies available to financial professionals. These instruments allow for the processing of massive datasets and the execution of complex algorithms at unprecedented speeds.
Programming Languages for Financial Modeling
Modern quantitative analysis heavily relies on powerful programming languages that offer robust statistical capabilities and efficient data manipulation.
-
Python: Dominates the quant finance landscape due to its extensive libraries (NumPy for numerical operations, Pandas for data manipulation, SciPy for scientific computing, Scikit-learn for machine learning, Matplotlib and Seaborn for visualization). Its readability and versatility make it ideal for everything from data cleaning to building complex trading algorithms.
-
R: A statistical programming language, R is a powerhouse for statistical analysis, graphical representation, and predictive modeling. It’s particularly favored for academic research and advanced statistical applications in finance.
-
MATLAB: Widely used in engineering and scientific fields, MATLAB also finds applications in finance, especially for complex numerical simulations, signal processing, and modeling sophisticated financial instruments.
-
C++: Often used for high-frequency trading systems where speed and performance are critical, as it offers unparalleled control over hardware and memory.
Advanced Financial Software and Platforms
Beyond general-purpose programming languages, specialized software and platforms are essential for financial professionals:
-
Bloomberg Terminal and Refinitiv Eikon: Industry-standard platforms providing real-time market data, news, analytics, and trading tools, which are indispensable for quants needing instant access to vast amounts of information.
-
Proprietary Trading Platforms: Developed in-house by large financial institutions, these platforms are optimized for specific trading strategies, offering superior speed and customization.
-
Econometric Software: Programs like EViews, SAS, and STATA are designed for sophisticated statistical and econometric modeling, often used by economists and researchers.
-
Financial Modeling Software: Tools like Microsoft Excel (with powerful add-ins), @RISK for Monte Carlo simulations, and specialized financial planning software facilitate budgeting, forecasting, and scenario analysis.
The Rise of AI and Machine Learning in Finance
The advent of artificial intelligence (AI) and machine learning (ML) has brought a new paradigm to quantitative analysis, enabling more sophisticated pattern recognition and prediction than ever before.
-
Predictive Models: ML algorithms like neural networks, random forests, and support vector machines can learn complex, non-linear relationships in financial data to predict stock prices, credit defaults, or market volatility with greater accuracy.
-
Pattern Recognition: AI can identify subtle patterns and anomalies in market data that are imperceptible to human analysts, potentially uncovering arbitrage opportunities or early warning signs of market shifts.
-
Natural Language Processing (NLP): Used to analyze unstructured text data from news articles, social media, regulatory filings, and earnings call transcripts to gauge market sentiment, identify emerging risks, and extract valuable insights that influence asset prices.
-
Reinforcement Learning: Advanced AI techniques are being explored for optimal trading strategies, where algorithms learn through trial and error in simulated market environments.
The Benefits and Challenges of Quantitative Analysis
While quantitative analysis offers powerful advantages, it is not without its limitations and complexities. A balanced understanding of both is crucial for its effective application.
Advantages: Objectivity, Efficiency, and Scale
The primary benefit of quantitative analysis is its objectivity. By relying on data and mathematical models, it largely eliminates emotional biases (like fear and greed) that often cloud human judgment in financial decisions. This leads to more disciplined and rational strategies.
Efficiency is another significant advantage. Quantitative models can process and analyze vast quantities of data in fractions of a second, a feat impossible for human analysts. This speed is critical in fast-moving markets, enabling the exploitation of fleeting opportunities.
Finally, scale allows quantitative methods to identify complex patterns across massive datasets that would be unmanageable manually. This capability is essential for managing large investment portfolios, assessing systemic risks, and conducting comprehensive market analyses across numerous assets and markets simultaneously. The ability to backtest strategies against historical data also provides a rigorous empirical validation process.
Limitations and Criticisms
Despite its strengths, quantitative analysis faces several inherent challenges:
-
Model Risk: All models are simplifications of reality. If a model is poorly constructed, based on flawed assumptions, or miscalibrated, it can lead to significant errors and substantial financial losses. The 2008 financial crisis highlighted how reliance on faulty models (e.g., for mortgage-backed securities) can have catastrophic consequences.
-
Data Dependency: The accuracy of quantitative analysis is entirely dependent on the quality and completeness of the input data. “Garbage in, garbage out” is a fundamental truth; incomplete, inaccurate, or biased data will inevitably lead to flawed conclusions.
-
“Black Swan” Events: Quantitative models are typically built on historical data and assume that past patterns will offer some indication of future behavior. However, they often struggle to account for truly unprecedented “black swan” events – rare, high-impact occurrences that lie outside typical statistical distributions and historical precedents.
-
Over-fitting: A common risk where a model is too closely tailored to historical data, capturing noise as well as signal, and therefore performs poorly when applied to new, unseen data.
-
Difficulty with Qualitative Factors: Quantitative analysis struggles to incorporate qualitative elements effectively, such as management quality, geopolitical stability, brand perception, or regulatory changes, which can be crucial drivers of financial performance.
The Human Element: Bridging the Gap
Given these limitations, the human element remains indispensable. Quantitative analysis is a powerful tool, but it requires intelligent oversight. Financial professionals must:
-
Interpret Model Outputs: Understand what the model is truly saying, its assumptions, and its limitations, rather than blindly following its recommendations.
-
Validate Models: Continuously test and refine models against new data and evolving market conditions.
-
Exercise Judgment: Integrate quantitative insights with qualitative information and expert judgment, especially during periods of market stress or unprecedented events.
-
Address Ethical Considerations: Ensure that models are fair, transparent, and do not inadvertently perpetuate biases, especially as AI plays a larger role in financial decisions. The ultimate responsibility for financial decisions still rests with human decision-makers.
The Future of Quantitative Analysis in Finance
The landscape of quantitative finance is continuously evolving, driven by technological advancements and the increasing availability of diverse data sources.
Expanding Data Sources
The future will see quantitative analysis leveraging an even wider array of data. Beyond traditional market and financial data, “alternative data” is gaining prominence. This includes satellite imagery to track economic activity, anonymized credit card transaction data to gauge consumer spending, social media sentiment for market mood, and even internet search trends to predict product demand. The ability to integrate and analyze these disparate data streams will unlock new insights and predictive power.
Increased Automation and Democratization
As AI and machine learning tools become more accessible and user-friendly, the reach of quantitative analysis will broaden. We can expect increased automation in tasks ranging from data collection and cleaning to model deployment and even basic strategy execution. This democratization of quantitative tools means that sophisticated analyses, once exclusive to large institutions with dedicated quant teams, will become more accessible to smaller investment firms, individual traders, and even everyday investors through advanced financial tools and robo-advisors.

Ethical AI and Robust Regulation
With the growing power of quantitative models, particularly those driven by AI, comes an increased focus on ethics and regulation. There will be a stronger emphasis on developing “explainable AI” (XAI) models that can transparently show how they arrived at their conclusions, rather than operating as “black boxes.” Regulators will likely develop more stringent guidelines to ensure fairness, prevent algorithmic biases, and maintain market stability, especially in areas like credit scoring, loan approvals, and automated trading systems. The future of quantitative analysis in finance will be defined by its ability to harness immense data and computational power while maintaining transparency, responsibility, and an acute awareness of its inherent limitations.
In conclusion, quantitative analysis is the backbone of modern finance, transforming complex financial challenges into solvable mathematical problems. By embracing its power while remaining vigilant about its limitations, financial professionals can navigate the intricacies of global markets with unparalleled precision and insight, steering the future of money in an increasingly data-driven world.
aViewFromTheCave is a participant in the Amazon Services LLC Associates Program, an affiliate advertising program designed to provide a means for sites to earn advertising fees by advertising and linking to Amazon.com. Amazon, the Amazon logo, AmazonSupply, and the AmazonSupply logo are trademarks of Amazon.com, Inc. or its affiliates. As an Amazon Associate we earn affiliate commissions from qualifying purchases.