
In the vast and often complex world of finance, understanding a company’s performance is paramount for investors, analysts, and even the general public. Among the multitude of financial metrics available, Earnings Per Share (EPS) stands out as one of the most frequently cited and crucial indicators. It’s a simple number on the surface, yet it encapsulates a powerful story about a company’s profitability and its ability to generate wealth for its shareholders. For anyone navigating investment decisions, grasping the nuances of EPS is not just beneficial—it’s essential for making informed choices. This article will delve into what EPS truly signifies, how it’s calculated, why it holds such importance, and how to interpret it within the broader financial landscape.
Understanding the Fundamentals of EPS
At its core, Earnings Per Share is a measure that tells you how much profit a company makes for each outstanding share of its common stock. It’s a direct translation of a company’s total earnings into a per-share basis, making it highly relatable for individual investors who typically own shares rather than the entire enterprise.
Defining Earnings Per Share (EPS)
EPS is essentially a portion of a company’s net income that is allocated to each outstanding share of common stock. It serves as a direct indicator of a company’s profitability from the perspective of its shareholders. A higher EPS generally suggests that a company is more profitable and, by extension, potentially more attractive to investors. Conversely, a declining EPS can signal financial distress or operational challenges, prompting deeper scrutiny from the market. It’s a barometer of success, showing how much profit is being generated relative to the number of shares in circulation.
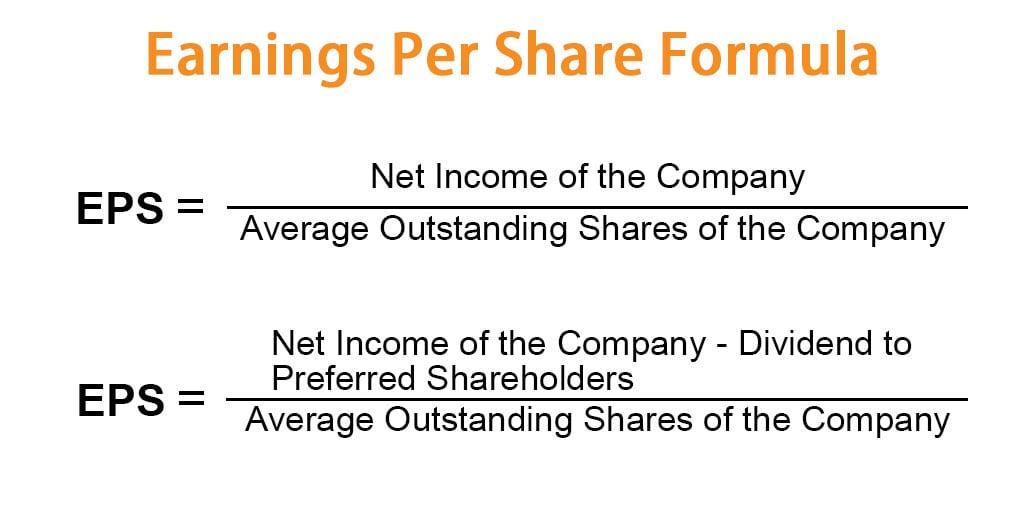
The Basic EPS Formula
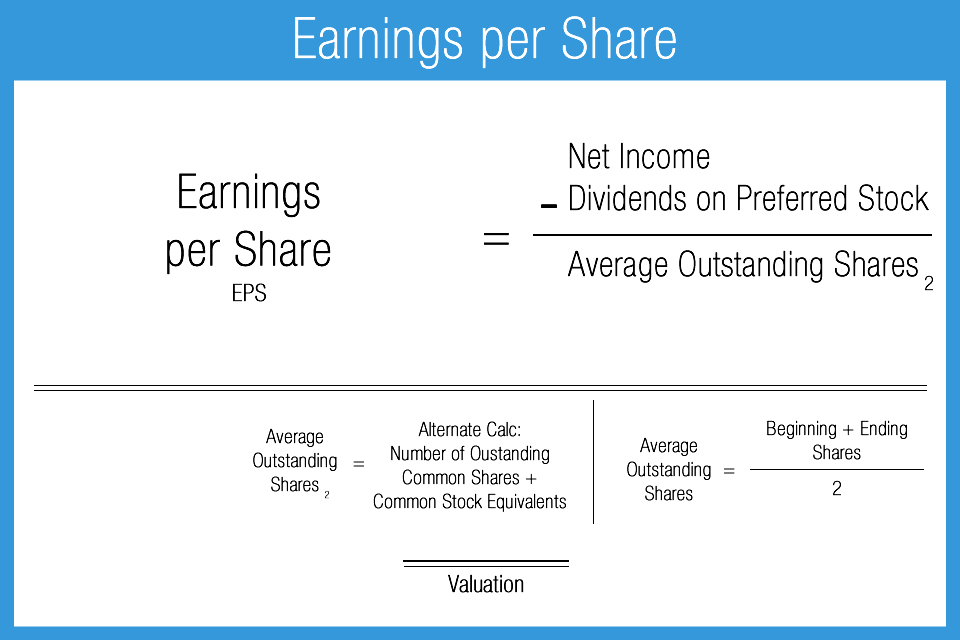
The calculation of basic EPS is relatively straightforward and is derived from a company’s income statement. The formula is as follows:
Basic EPS = (Net Income – Preferred Dividends) / Weighted Average Common Shares Outstanding
Let’s break down each component:
-
Net Income: This is the company’s total profit after all expenses, including taxes and interest, have been deducted from revenue. It’s the “bottom line” of the income statement.
-
Preferred Dividends: If a company has preferred stock, it typically pays fixed dividends to preferred shareholders before any profits are distributed to common shareholders. These dividends are subtracted from net income because they are not available to common shareholders.
-
Weighted Average Common Shares Outstanding: This represents the average number of common shares held by investors during a specific reporting period. Using a weighted average accounts for any changes in the number of shares (e.g., through stock issuance or buybacks) over the period, providing a more accurate per-share figure.
Differentiating Basic vs. Diluted EPS
While basic EPS provides a clear snapshot of current profitability, it’s crucial to also consider diluted EPS, especially for companies with complex capital structures.
-
Basic EPS only considers the common shares currently outstanding.
-
Diluted EPS, on the other hand, takes a more conservative approach. It calculates EPS by assuming that all convertible securities (such as stock options, warrants, convertible bonds, and convertible preferred stock) are exercised or converted into common shares. This “dilution” increases the total number of shares outstanding, thus typically lowering the EPS figure.
Diluted EPS is important because it reflects the potential future impact on per-share earnings if all these convertible instruments were to be exercised. It offers a more realistic view of the company’s earning power if all potential common shares were to materialize, giving investors a “worst-case scenario” understanding of their stake in the company’s profits. Serious investors and analysts often prioritize diluted EPS as it provides a more comprehensive and cautious perspective on a company’s earning capacity.
Why EPS Matters to Investors and Analysts
EPS is far more than just a number; it’s a critical lens through which investors and analysts evaluate a company’s financial health, growth trajectory, and overall attractiveness as an investment. Its prominence in financial reporting is no accident.
A Key Indicator of Profitability and Financial Health
A rising EPS over consecutive quarters or years is a strong signal of a company’s increasing profitability and efficient management. It suggests that the company is effectively growing its earnings relative to its share count, which is a fundamental indicator of robust financial health. Conversely, a consistent decline in EPS can indicate underlying issues such as declining sales, increasing costs, or poor operational efficiency, signaling potential trouble ahead. By tracking EPS trends, investors can quickly gauge the momentum of a company’s earnings power.
EPS in Valuation Metrics (e.g., P/E Ratio)
One of the most common applications of EPS is its role in calculating valuation ratios, most notably the Price-to-Earnings (P/E) ratio. The P/E ratio is derived by dividing a company’s current share price by its EPS.
P/E Ratio = Share Price / Earnings Per Share
The P/E ratio is a widely used metric to assess whether a stock is overvalued, undervalued, or fairly valued relative to its earnings. A high P/E ratio might suggest that investors expect higher earnings growth in the future, or that the stock is currently expensive. A low P/E ratio, conversely, might indicate that the stock is undervalued or that investors expect slower growth. Understanding EPS is therefore crucial for interpreting P/E ratios and making comparative judgments across different companies and industries. It helps investors determine how much they are paying for each dollar of a company’s earnings.
Identifying Growth and Decline
For growth-oriented investors, EPS growth is a primary focus. Companies that consistently deliver strong EPS growth often see their stock prices appreciate over time, assuming other factors remain favorable. This growth can come from increased revenue, improved profit margins, or even strategic share buybacks (which reduce the number of shares outstanding, thereby increasing EPS even if net income remains constant).
Monitoring EPS trends allows investors to identify companies that are expanding their profitability. A healthy company will typically show a positive and accelerating EPS growth rate. Conversely, a stagnant or declining EPS can be a red flag, prompting investors to investigate the underlying causes. Is it a temporary setback, or indicative of a more structural problem within the business or its industry? The answer often guides investment decisions.
Factors Influencing Earnings Per Share
While the formula for EPS is straightforward, the components that feed into it are subject to a myriad of influences. Understanding these factors provides a deeper insight into why EPS might fluctuate and helps in making more nuanced interpretations.
Net Income Fluctuation
The most direct impact on EPS comes from changes in a company’s net income. Net income is influenced by several critical factors:
-
Revenue Growth: Higher sales generally lead to higher net income, assuming costs are controlled.
-
Operating Costs: Efficient management of expenses like cost of goods sold, salaries, and marketing can boost net income.
-
Interest Expense: High debt levels can lead to significant interest payments, reducing net income.
-
Tax Rates: Changes in corporate tax rates directly affect the after-tax profit.
-
One-time Events: Extraordinary gains or losses (e.g., sale of an asset, restructuring charges) can significantly impact net income for a particular period, creating spikes or dips in EPS that might not be representative of core operations. It’s important to identify and adjust for these non-recurring items when analyzing trends.
Share Count Changes
The denominator in the EPS formula—weighted average common shares outstanding—is another dynamic variable that can significantly alter EPS, even if net income remains constant.
-
Share Buybacks (Repurchases): When a company buys back its own shares from the open market, it reduces the number of outstanding shares. This action, all else being equal, increases EPS because the same net income is now distributed among fewer shares. Share buybacks are often viewed positively by investors as a sign that management believes the stock is undervalued or has no better investment opportunities.
-
Stock Issuances: Conversely, when a company issues new shares (e.g., to raise capital, for employee stock options, or through acquisitions), the number of outstanding shares increases. This dilutes existing shareholders’ ownership and typically decreases EPS, as the net income is spread over more shares.
-
Stock Splits and Reverse Splits: These corporate actions change the number of shares outstanding without affecting the total market capitalization or a shareholder’s total stake. A stock split increases the number of shares and decreases the share price proportionally, while a reverse split does the opposite. While they affect the per-share price and share count, they don’t fundamentally change the company’s overall earnings or value.
Preferred Dividends and Dilutive Securities
As mentioned, preferred dividends reduce the income available to common shareholders, directly impacting the numerator of the basic EPS formula. The existence of dilutive securities also plays a crucial role, particularly when considering diluted EPS. These securities, if converted, would increase the share count and thus dilute the per-share earnings. Companies with a large number of outstanding options, warrants, or convertible debt may have a significantly lower diluted EPS compared to their basic EPS, indicating potential future dilution for common shareholders.
Interpreting and Applying EPS in Investment Decisions
While EPS is a powerful tool, its true value lies in how it’s interpreted and integrated with other financial analysis. Using EPS in isolation can lead to misleading conclusions; context and comparison are key.
Comparing EPS Across Companies and Industries
Directly comparing the EPS of two different companies can be insightful but also misleading without proper context. A company with a higher EPS is not automatically “better” than one with a lower EPS. Several factors can skew direct comparisons:
-
Industry Norms: Different industries have varying capital requirements, profit margins, and growth rates, which naturally affect EPS. A tech startup might have negative EPS for years while a mature utility company has stable, albeit low, EPS.
-
Company Size and Capital Structure: Larger companies often have higher net incomes, but they might also have a significantly higher number of shares outstanding. Companies with different levels of debt or preferred stock will also have different impacts on their EPS.
-
Accounting Practices: While standardized, accounting practices can still vary in how certain items are treated, impacting reported net income.
Therefore, it’s often more useful to compare a company’s EPS against its historical performance, against its direct competitors within the same industry, or against industry averages.
EPS in Conjunction with Other Financial Ratios
No single financial metric tells the whole story, and EPS is no exception. For a comprehensive analysis, EPS should always be considered alongside a suite of other financial ratios:
-
Revenue Growth: High EPS growth without corresponding revenue growth might indicate cost-cutting or share buybacks, which aren’t sustainable long-term growth drivers.
-
Profit Margins (Gross, Operating, Net): These ratios reveal how efficiently a company converts revenue into profit. A rising EPS coupled with improving margins is a very strong sign.
-
Cash Flow from Operations: This metric shows the actual cash a company generates from its core business, which can sometimes differ significantly from net income (an accounting measure). Strong cash flow supports sustainable EPS.
-
Debt Levels: High debt can make a company vulnerable, even if its EPS looks good.
-
Price-to-Earnings Growth (PEG) Ratio: This ratio combines P/E with the expected earnings growth rate, offering a more nuanced view of valuation for growth stocks. PEG = P/E Ratio / Annual EPS Growth Rate.
By looking at these metrics together, investors can build a holistic picture of a company’s financial health, operational efficiency, and growth prospects.
The Role of Analyst Estimates and Guidance
Publicly traded companies often provide EPS guidance for future quarters or fiscal years, offering their own projections based on internal forecasts. Additionally, financial analysts publish their own EPS estimates, based on their research and models.
-
Company Guidance: Management’s guidance provides insight into their expectations for the business.
-
Analyst Estimates: The consensus of analyst estimates reflects market expectations.
When a company reports actual EPS that “beats” analyst expectations, it often leads to a positive reaction in its stock price. Conversely, “missing” estimates can cause the stock price to decline, sometimes sharply, regardless of whether the actual EPS was positive or negative. This highlights the psychological and expectation-driven aspects of the stock market and the importance of EPS in managing investor sentiment.
Potential Pitfalls and Limitations of EPS
Despite its widespread use and undeniable importance, EPS is not without its limitations and potential pitfalls. Savvy investors understand these drawbacks and look beyond the headline number to avoid misinterpretations.
EPS Manipulation and Accounting Practices
While legitimate variations exist in how companies manage their finances, some practices can make EPS appear better than the underlying reality.
-
Aggressive Accounting: Companies might use aggressive revenue recognition policies or capitalize expenses that should be expensed, artificially inflating net income and thus EPS.
-
Non-Recurring Items: As discussed, one-time gains can temporarily boost EPS, making a company look more profitable than it is on an ongoing basis. It’s crucial to analyze “adjusted EPS” or “non-GAAP EPS” figures, which exclude these one-time items, to get a clearer picture of core earnings. However, investors must also scrutinize how these adjustments are made, as companies sometimes use them to obscure weaknesses.
-
Share Buybacks to Mask Poor Performance: While share buybacks can be a legitimate way to return value, some companies might initiate them primarily to boost EPS when net income growth is stagnant or declining, giving a false impression of improved profitability per share.
EPS vs. Cash Flow
EPS is an accrual accounting measure, meaning it records revenues when earned and expenses when incurred, regardless of when cash actually changes hands. This can create a disconnect between reported earnings and actual cash flow. A company can report strong EPS but have weak cash flow from operations, which could indicate problems with accounts receivable collection, inventory management, or high capital expenditures. Ultimately, cash is king; a company needs sufficient cash flow to pay dividends, reduce debt, and fund growth initiatives. Therefore, investors should always compare EPS with cash flow metrics (like operating cash flow and free cash flow) to ensure the reported profits are translating into actual cash generation.
The Importance of Qualitative Factors
Financial metrics, including EPS, provide a quantitative view of a company. However, they don’t capture qualitative aspects that are equally vital to a company’s long-term success and investment appeal. These include:
-
Quality of Management: A strong, ethical, and visionary management team is crucial.
-
Competitive Landscape: A company’s moat, market position, and ability to fend off competitors.
-
Industry Trends: Is the industry growing, stagnating, or declining? Is the company well-positioned for future trends?
-
Brand Strength and Customer Loyalty: Intangible assets that are not reflected in EPS.
-
Innovation and Research & Development: Future growth depends on these, but they often depress current EPS.
Ignoring these qualitative factors and relying solely on EPS or other numbers can lead to incomplete assessments and poor investment decisions.

Conclusion
Earnings Per Share is undeniably one of the most fundamental and widely used metrics in financial analysis, serving as a powerful lens through which to view a company’s profitability from a shareholder’s perspective. It offers a quick and easy way to gauge a company’s earning power, forms the bedrock of popular valuation metrics like the P/E ratio, and helps investors track growth trajectories or identify potential declines.
However, its true utility emerges not in isolation, but when it is understood within its full context. Savvy investors know that EPS must be analyzed in conjunction with other financial indicators such as revenue growth, profit margins, and cash flow, and critically evaluated against industry benchmarks and historical trends. Furthermore, one must remain vigilant against potential manipulations and acknowledge the limitations of EPS as an accrual accounting measure.
Ultimately, “What does Earnings Per Share mean?” means a great deal for your financial literacy and investment journey. Mastering this metric is a crucial step toward making more informed, insightful, and strategic investment decisions, allowing you to discern the true financial health and potential of the companies you choose to back. By combining rigorous quantitative analysis with a keen eye for qualitative factors, investors can unlock the deeper narrative behind the numbers and build a more robust and successful portfolio.
aViewFromTheCave is a participant in the Amazon Services LLC Associates Program, an affiliate advertising program designed to provide a means for sites to earn advertising fees by advertising and linking to Amazon.com. Amazon, the Amazon logo, AmazonSupply, and the AmazonSupply logo are trademarks of Amazon.com, Inc. or its affiliates. As an Amazon Associate we earn affiliate commissions from qualifying purchases.