
In the world of finance, the term “bond” is often thrown around alongside stocks, dividends, and portfolios. For the novice investor, a bond is frequently described as a “loan to a government or corporation,” but this abstract definition often leaves one asking a more literal question: What does a bond actually look like?
To understand what a bond looks like, we must look at it through three different lenses: the historical physical artifact, the modern digital entry, and the underlying legal contract. Whether you are viewing a dusty paper certificate from the 1920s or a line item in a high-tech brokerage app, the “look” of a bond represents a promise of future cash flows and a cornerstone of global capital markets.

From Paper to Pixels: The Physical Evolution of a Bond
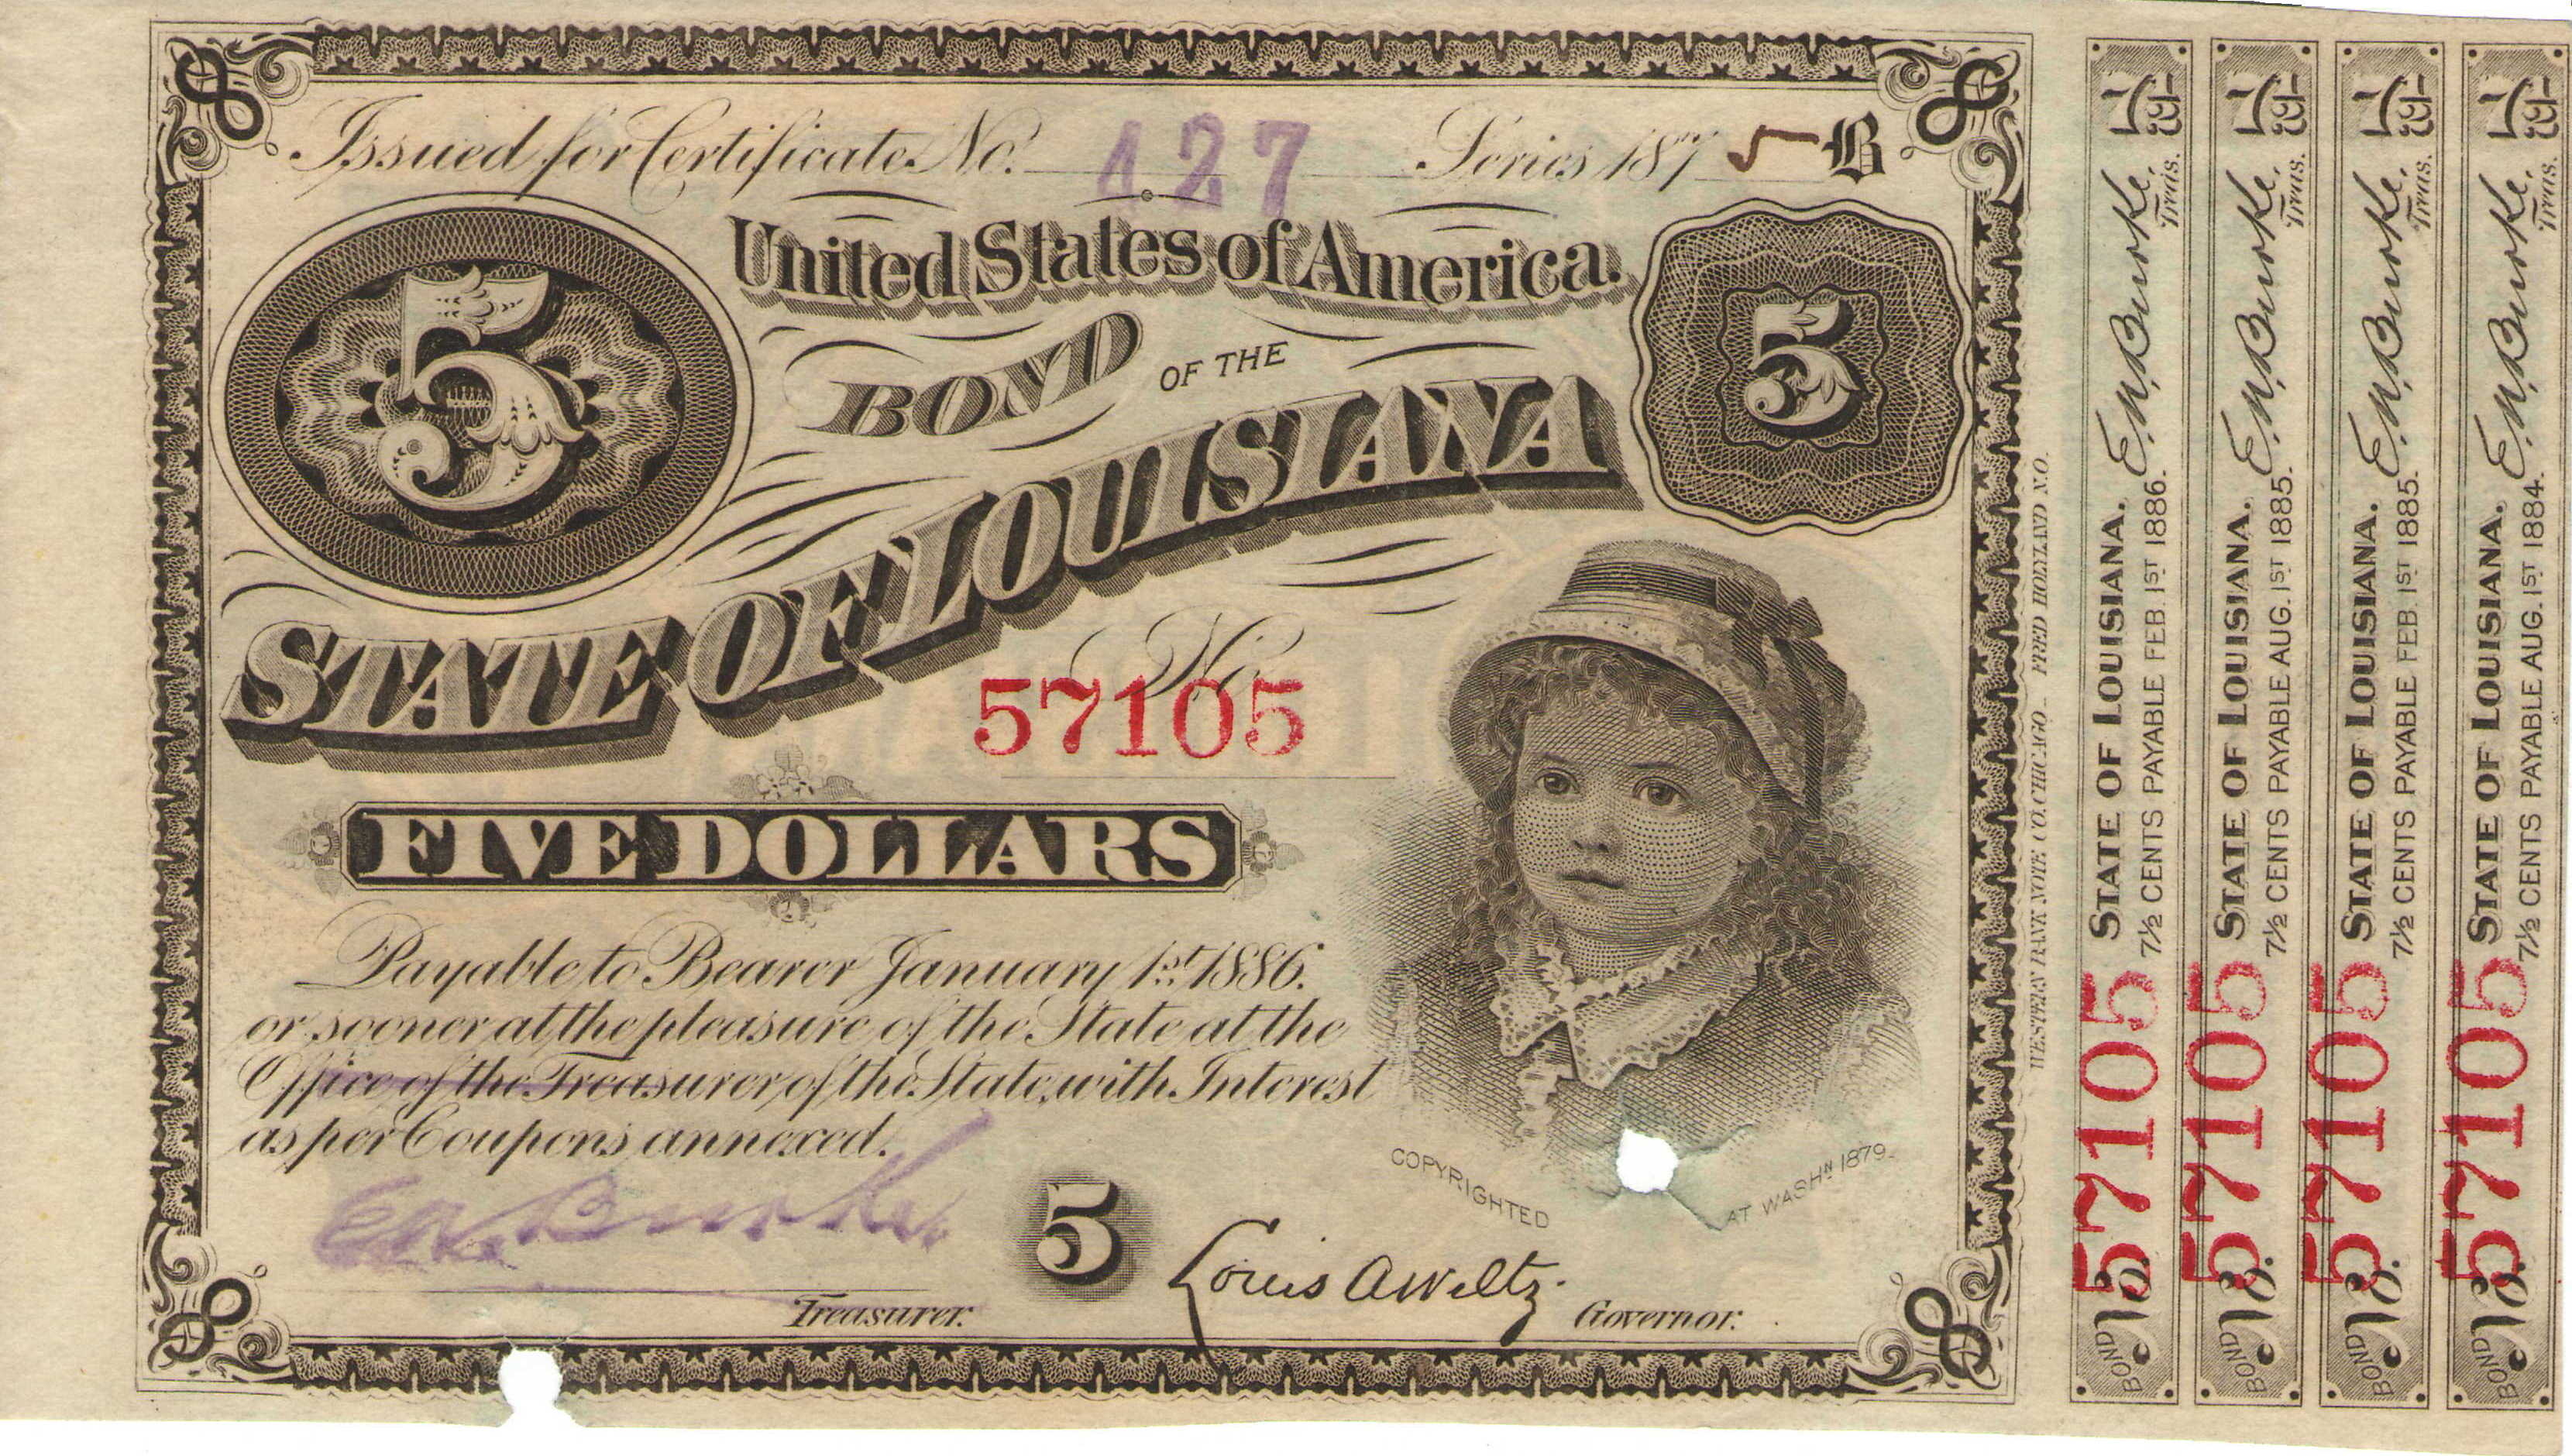
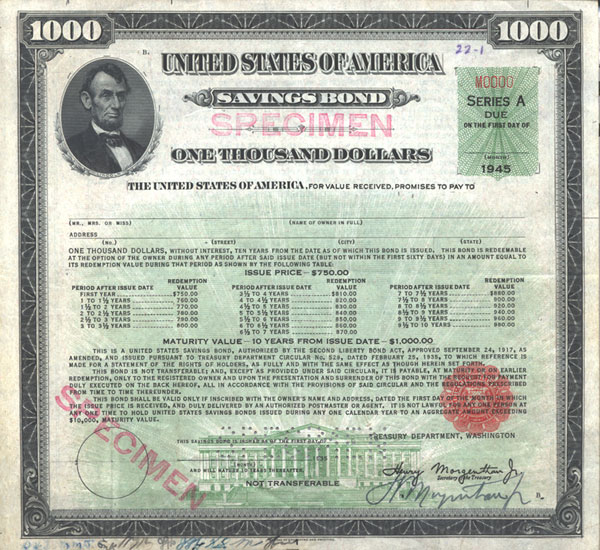
Historically, a bond was a physical piece of paper, often quite large and ornately designed. These documents were more than just receipts; they were “bearer instruments,” meaning whoever held the physical paper owned the debt. If you lost the paper, you lost the investment.
The Era of Bearer Bonds and Physical Certificates
In the 19th and early 20th centuries, bonds were masterpieces of engraving. To prevent counterfeiting, they featured intricate borders, vignettes of industrial scenes (like trains or factories), and official wax seals. The most iconic visual feature of these historic bonds was the “coupon.”
Attached to the bottom or sides of the main certificate were rows of small, perforated rectangles. These were the actual interest payments. Twice a year, the investor would physically “clip a coupon” and take it to a bank to exchange it for cash. This is where the modern financial term “coupon rate” originates. When you ask what a bond looked like in 1950, the answer is a heavy, parchment-like document with dozens of tiny, detachable squares.
The Transition to Book-Entry Form
Today, if you buy a U.S. Treasury bond or a corporate bond from Apple, you will never see a physical certificate. In the late 20th century, the financial world moved to “book-entry” form. This transition was driven by the sheer volume of trades, which made the physical transport of paper bonds impossible to manage.
Now, a bond “looks” like a digital entry in a centralized ledger. When you view your portfolio online, a bond appears as a row of data. It shows the issuer’s name, the CUSIP number (a unique identifier for North American financial instruments), the face value, and the current market price. While less romantic than an engraved certificate, this digital format is infinitely more secure and efficient, allowing for the instantaneous transfer of billions of dollars across the globe.
Anatomy of a Bond: What’s Inside the Contract?
While the physical appearance has shifted from paper to digital code, the conceptual “look” of a bond remains constant. Every bond is defined by a specific set of characteristics that dictate its value and risk profile. To understand what a bond “is,” one must look at its internal anatomy.
The Principal and Par Value
The most prominent “feature” of a bond is its par value, also known as the face value or principal. This is the amount of money the issuer agrees to pay the investor back when the bond matures. Most corporate and municipal bonds are issued in increments of $1,000.
It is important to note that the par value is not necessarily what the bond “looks like” in terms of price on the open market. Bonds can trade at a “premium” (above par) or a “discount” (below par), depending on how current interest rates compare to the bond’s fixed interest rate. However, at the end of the bond’s life, the par value is the visual “anchor” of the contract.
The Coupon Rate and Payment Schedule
The second vital component is the coupon rate. This is the annual interest rate the issuer pays to the bondholder. For example, a bond with a $1,000 par value and a 5% coupon rate will pay $50 a year.
In a modern digital statement, this looks like a periodic deposit into your brokerage account. Most bonds pay semi-annually, meaning that $50 would be split into two $25 payments. The “look” of this in a financial tool is often a projected income calendar, showing exactly when these cash flows will arrive over the next several years.
Maturity Date and Term Length
Every bond has a finite lifespan. The maturity date is the specific day the “loan” ends and the issuer returns the principal to the investor. Bonds are categorized by their “look” in terms of time:
-
Short-term: Maturing in 1–3 years.
-
Intermediate-term: Maturing in 4–10 years.
-
Long-term: Maturing in 10–30 years (or more).
The further away the maturity date, the more “volatile” the bond’s price usually looks on a chart. This is because there is more time for interest rates to change, which impacts the bond’s current market value.
What a Bond Looks Like in a Modern Investment Portfolio
For the contemporary investor, a bond is rarely a standalone item. Instead, it is a component of a broader wealth management strategy. How a bond “looks” in your portfolio depends heavily on how you choose to own it.
Individual Bonds vs. Bond ETFs and Mutual Funds
If you buy an individual bond, it looks like a specific debt obligation. You see the exact company you are lending to and the exact date you get your money back. However, for many retail investors, a bond looks like a “ticker symbol” for an Exchange-Traded Fund (ETF) or a Mutual Fund.
In an ETF like the BND (Vanguard Total Bond Market), the bond doesn’t look like a single loan; it looks like a basket of thousands of different loans. You don’t have a single maturity date; instead, you have an “average effective maturity.” This visual representation in your portfolio focuses on yield and diversification rather than the specific terms of one agreement.
Visualizing Risk and Credit Ratings
When looking at a bond through a financial tool, one of the most important “visuals” is the credit rating. Provided by agencies like Standard & Poor’s, Moody’s, or Fitch, these ratings are shorthand for the bond’s quality.
-
AAA to BBB-: These are “Investment Grade” bonds. They look like safe, reliable sources of income.
-
BB+ to D: These are “High Yield” or “Junk” bonds. They look like higher-risk opportunities where the chance of the issuer defaulting is significantly greater.
On a professional terminal, this might be color-coded. A sea of green might represent high-grade government debt, while yellow or red alerts indicate distressed corporate debt.
The Role of Bonds in a Diversified Financial Strategy
The ultimate reason we care about what a bond looks like is because of the role it plays in wealth preservation. While stocks are the “engines” of growth in a portfolio, bonds are often described as the “ballast” that keeps the ship steady during a storm.
Income Generation and Capital Preservation
For retirees or those seeking steady cash flow, a bond looks like a “salary” from their investments. Because the payments are fixed and legally mandated (unlike stock dividends, which a company can cancel at any time), they provide a level of predictability that is essential for budgeting and financial planning.
Furthermore, because a bondholder is a creditor, they have a higher claim on a company’s assets than a shareholder does. In the visual hierarchy of a company’s capital structure, bonds sit at the top. If a company goes bankrupt, the bondholders are paid first from the remaining assets, while stockholders often receive nothing.
Bonds as a Hedge Against Market Volatility
When the stock market “looks” ugly—characterized by red charts and sharp downward trends—bonds often look like a sanctuary. There is an inverse relationship that frequently (though not always) exists between stocks and bonds. When investors are scared of the stock market, they “flight to quality,” buying government bonds. This increased demand drives bond prices up.
In a well-balanced portfolio, the steady “look” of bond prices helps offset the erratic swings of equity prices. This “negative correlation” is the fundamental logic behind the classic 60/40 portfolio (60% stocks, 40% bonds).
Conclusion: The Evolving Face of Fixed Income
So, what does a bond look like? It is a shapeshifter. To a historian, it is a beautiful, engraved piece of 19th-century art. To a modern day-trader, it is a CUSIP number and a yield percentage on a high-resolution monitor. To a retiree, it is the comfort of a predictable direct deposit arriving every six months.
Ultimately, a bond looks like a contract. It is a visual representation of trust between a lender and a borrower. Whether it is written on parchment or encrypted in a blockchain, the core “look” of a bond remains its promise: “I owe you this much, I will pay you this much interest, and I will return your money on this date.” Understanding this anatomy is the first step toward mastering the world of fixed-income investing and building a resilient financial future.
aViewFromTheCave is a participant in the Amazon Services LLC Associates Program, an affiliate advertising program designed to provide a means for sites to earn advertising fees by advertising and linking to Amazon.com. Amazon, the Amazon logo, AmazonSupply, and the AmazonSupply logo are trademarks of Amazon.com, Inc. or its affiliates. As an Amazon Associate we earn affiliate commissions from qualifying purchases.