
In the rapidly evolving landscape of technology, data is often described as the new oil. However, raw data is useless without the tools to refine it into actionable insights. For software engineers, data scientists, and AI researchers, the “p-value” is one of the most critical instruments in the statistical toolkit. Whether you are optimizing a machine learning model, conducting A/B tests on a new app interface, or validating the security of an encryption protocol, understanding the p-value is essential for distinguishing between a genuine breakthrough and mere coincidence.

At its core, a p-value helps us answer a fundamental question in technology: “Is this result real, or did it happen by chance?” As we integrate more automated decision-making into our software stacks, the ability to quantify uncertainty becomes the difference between a high-performing product and a failed experiment.
The Foundations: Understanding P-Values in the Digital Age
To understand the p-value, one must first understand the framework of hypothesis testing. In the tech world, we are constantly making claims: “This new compression algorithm is faster,” or “This AI model is more accurate than the previous version.” To prove these claims, we use two opposing ideas: the Null Hypothesis ($H0$) and the Alternative Hypothesis ($Ha$).
Defining the P-Value for Technologists
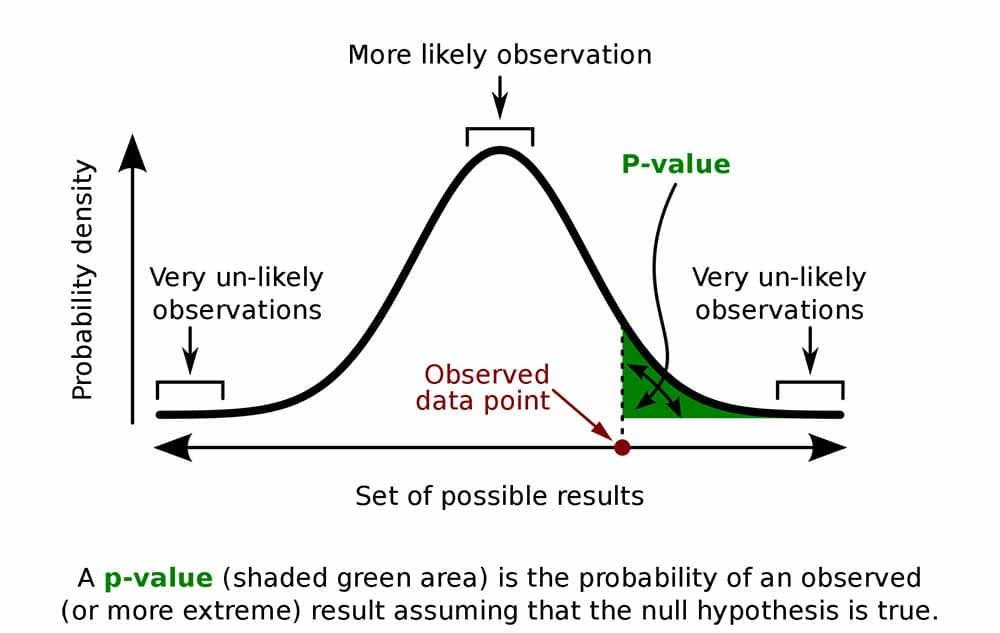
The p-value, or probability value, is a number between 0 and 1 that represents the probability of obtaining results at least as extreme as the ones observed, assuming that the null hypothesis is true. In simpler terms, if we assume that our new software update actually did nothing to improve performance, the p-value tells us how likely it is that we would see the improved speed anyway just due to random fluctuations in the server environment.
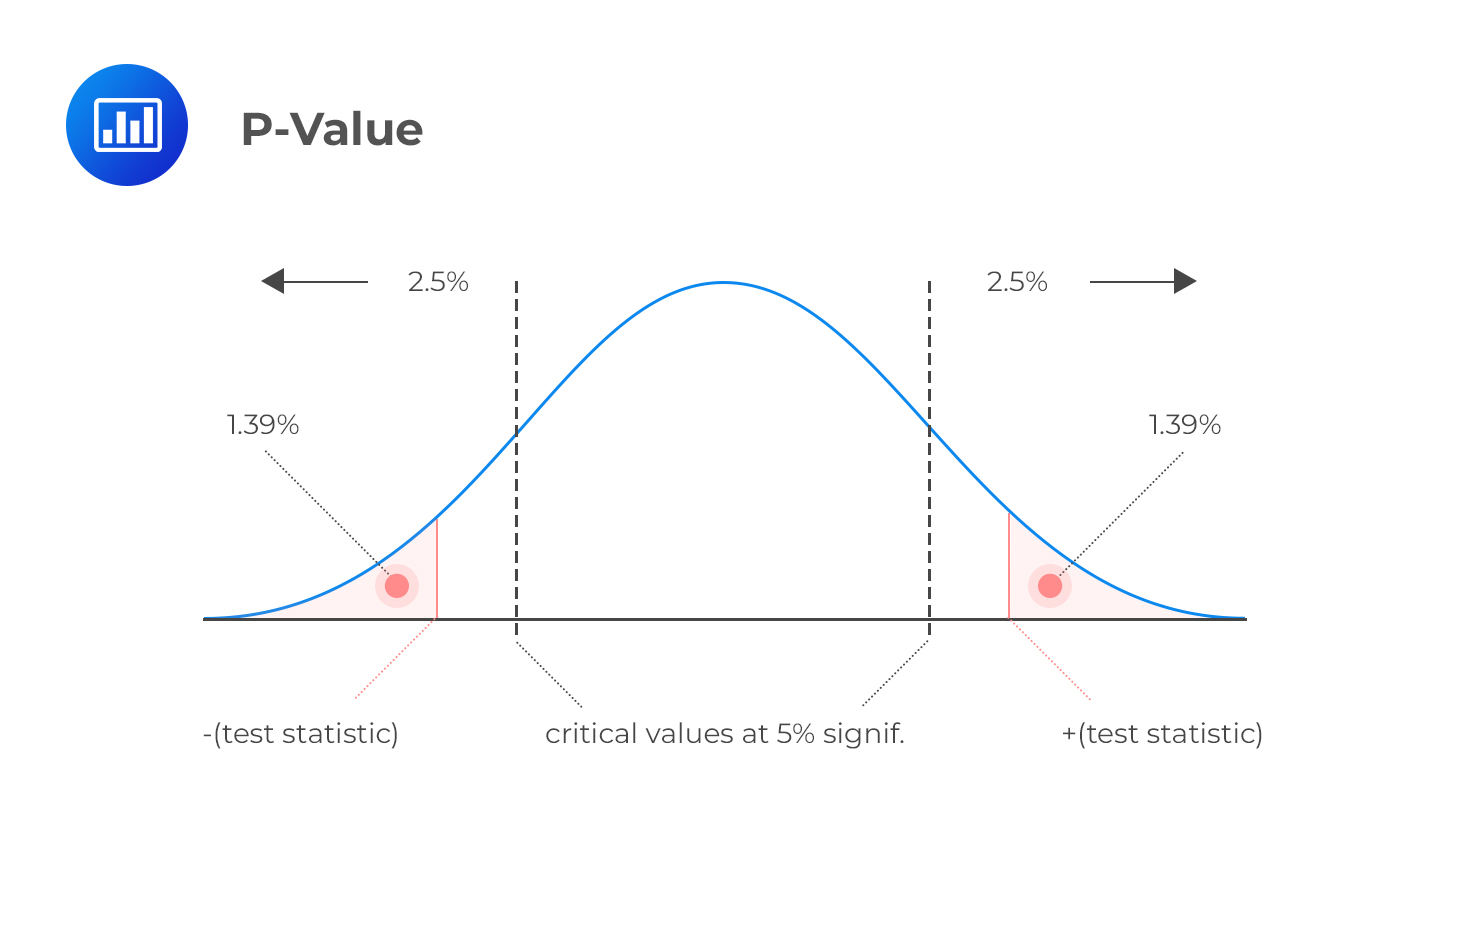
A low p-value (typically $leq 0.05$) indicates that the observed data is unlikely to have occurred under the null hypothesis, leading researchers to “reject” the null hypothesis in favor of the alternative. In the context of technology trends, this suggests that a specific change—be it a code refactor or a new hardware configuration—has a statistically significant effect.
The Role of the Null Hypothesis in Algorithmic Testing
In algorithmic development, the null hypothesis is the “status quo.” It assumes that any difference in performance between two versions of an algorithm is due to noise. For example, if you are testing a new cybersecurity filter designed to detect phishing, the null hypothesis states that the new filter performs exactly the same as the old one.
The p-value acts as the gatekeeper. By calculating it, developers can determine if the “signal” (the improved detection rate) is strong enough to overcome the “noise” (random variations in the data). Without this statistical rigor, tech companies would risk deploying “improvements” that are actually non-existent, leading to wasted resources and technical debt.
P-Values in Software Engineering: Mastering A/B Testing
One of the most practical applications of p-values in the tech industry is A/B testing (or split testing). Modern software development relies heavily on iterative design, where two versions of a digital product—Version A (the control) and Version B (the variant)—are shown to users to see which one performs better according to a specific metric, such as click-through rate or user retention.
Validating UI/UX Changes with Statistical Significance
When a product manager at a social media company wants to change the color of a “Sign Up” button to increase conversions, they don’t just guess. They run an A/B test. If Version B sees a 2% increase in sign-ups, the team must determine if that 2% is a result of the color change or just a random surge in traffic that day.
This is where the p-value comes in. By setting a significance level (alpha), usually 0.05, the team establishes a threshold for risk. If the p-value of the test is 0.03, it is below the 0.05 threshold, meaning there is only a 3% chance that the 2% increase happened by luck. This gives the engineering team the confidence to roll out the change to millions of users.
Avoiding the Pitfalls of False Positives in Product Iteration
In the fast-paced world of software startups, there is often a rush to find “winners.” However, relying on p-values without proper context can lead to “Type I Errors”—false positives. This occurs when a p-value suggests a significant result that doesn’t actually exist in reality.
In tech, this often happens through “p-hacking” or “data dredging,” where teams run hundreds of tests simultaneously and only report the ones that happen to yield a low p-value. To combat this, sophisticated data teams use Bonferroni corrections or other statistical adjustments to ensure that their software iterations are based on robust, repeatable evidence rather than statistical anomalies.
The Role of P-Values in Artificial Intelligence and Machine Learning
As we move into the era of Generative AI and Large Language Models (LLMs), p-values have taken on a new level of importance. Training a neural network involves thousands of variables, and determining which features actually contribute to the model’s predictive power is a massive computational challenge.
Feature Selection and Statistical Significance
In machine learning, “feature selection” is the process of identifying the most relevant inputs for a model. If a data scientist is building a predictive maintenance tool for an IoT (Internet of Things) network, they might have data on temperature, vibration, humidity, and even the time of day.
By using p-values during the exploratory data analysis (EDA) phase, the developer can test the relationship between each input and the target outcome (e.g., machine failure). If the p-value for “humidity” is 0.65, it suggests that humidity has no statistically significant impact on machine failure in this specific dataset. Removing these insignificant features simplifies the model, reduces training time, and prevents “overfitting”—a common problem where an AI model learns the noise in the data rather than the actual patterns.
Evaluating Model Performance Beyond Accuracy
When comparing two different AI architectures, developers often look at “accuracy.” However, accuracy can be misleading, especially with imbalanced datasets. Statistical significance testing, powered by p-values, allows researchers to compare models more deeply.
For instance, using a t-test or a McNemar’s test, an AI engineer can determine if the difference in error rates between a Transformer model and a Recurrent Neural Network (RNN) is statistically significant. In peer-reviewed AI research, providing p-values is a requirement to prove that a new software tool truly represents an advancement in the state-of-the-art (SOTA).
Best Practices for Tech Professionals: Interpreting Significance
While the p-value is a powerful tool, it is frequently misunderstood. For tech professionals, the goal isn’t just to calculate a number, but to interpret it in a way that drives smart business and technical decisions.
The Difference Between Statistical and Practical Significance
One of the most important lessons for any software developer is that statistical significance does not always mean practical significance. With “Big Data,” even the smallest, most trivial differences can result in a very low p-value.
Imagine an app with 100 million users. A change in the code that improves load times by 0.001 milliseconds might produce a p-value of 0.0001. Statistically, the result is “highly significant.” However, from a technical and user-experience perspective, 0.001 milliseconds is imperceptible. In this case, the cost of deploying the change and the risk of introducing new bugs might outweigh the negligible performance gain. Tech leaders must balance the p-value with “effect size” to determine if a change is worth the engineering effort.
Moving Beyond $p < 0.05$: Modern Alternatives
In recent years, the tech community has begun to move beyond a binary “significant vs. not significant” view of p-values. Modern data science platforms are increasingly incorporating Bayesian statistics and confidence intervals to provide a more nuanced view of uncertainty.
Instead of just asking “Is this p-value less than 0.05?”, senior architects are asking: “What is the range of possible outcomes?” Confidence intervals provide a range of values within which the true effect likely lies, offering more context than a p-value alone. Furthermore, Bayesian A/B testing allows companies to update their probability of success in real-time as more user data flows in, a technique used extensively by tech giants like Google and Spotify to optimize their recommendation engines.
Conclusion: The P-Value as a Strategic Asset
In the world of technology, where every click is tracked and every millisecond is measured, the p-value serves as a critical filter. It protects software systems from being swayed by random noise and ensures that AI models are built on a foundation of verifiable truth.
Whether you are a developer debugging a performance issue, a data scientist selecting features for a model, or a product owner deciding on a new feature, the p-value provides the mathematical rigor necessary to scale with confidence. By mastering this statistical concept, tech professionals can navigate the complexities of data-driven development, ensuring that their innovations are not just “lucky,” but truly revolutionary.
aViewFromTheCave is a participant in the Amazon Services LLC Associates Program, an affiliate advertising program designed to provide a means for sites to earn advertising fees by advertising and linking to Amazon.com. Amazon, the Amazon logo, AmazonSupply, and the AmazonSupply logo are trademarks of Amazon.com, Inc. or its affiliates. As an Amazon Associate we earn affiliate commissions from qualifying purchases.