
In the intricate world of personal and business finance, numbers tell a story. Among these, percentages play a remarkably central role, serving as the universal language for comparing values, tracking growth, measuring change, and evaluating performance. From understanding a discount on your favorite purchase to dissecting complex investment returns or assessing a company’s profitability, the ability to “get the percentage of” isn’t just a mathematical trick; it’s a foundational skill for astute financial decision-making. This article will demystify percentage calculations, equipping you with the knowledge to confidently apply them across various financial scenarios, ensuring you’re always in control of your financial narrative.

The Ubiquitous Role of Percentages in Finance
Percentages are more than just a fraction of 100; they are a powerful tool for standardization and comparison, making disparate figures relatable and comprehensible. Their pervasive presence in financial discourse highlights their importance.
Understanding the Core Concept
At its heart, a percentage represents a part of a whole, expressed as a fraction of 100. The basic formula is elegantly simple:
Percentage = (Part / Whole) x 100
For instance, if you spent $30 out of a $200 budget, your spending represents (30 / 200) x 100 = 15% of your budget. This simple calculation underpins a vast array of financial analyses. Understanding this fundamental relationship allows you to contextualize any numerical value within its broader financial framework. It helps answer questions like: “What portion of my income goes to rent?” or “What share of the market does our new product command?”
Why Percentages Matter for Financial Literacy
Financial literacy is the bedrock of economic well-being, and a robust understanding of percentages is a cornerstone of this foundation. They provide clarity and perspective that raw numbers often obscure. Without percentages, comparing a $50 discount on a $200 item to a $100 discount on a $1000 item would be less intuitive. With percentages, we immediately see 25% versus 10%, revealing which deal offers a greater relative saving. For individuals, percentages empower informed choices regarding spending, saving, and investing. For businesses, they drive strategic decisions, operational adjustments, and competitive positioning. They allow for consistent benchmarks, enabling you to gauge your financial progress against targets, industry standards, or historical performance.
Practical Applications in Personal Finance
For many, the most frequent encounters with percentages occur in the realm of personal finance. Mastering these applications can lead to significant savings and better financial control.
Calculating Discounts and Savings
One of the most common applications is calculating discounts. Whether it’s a 20% off sale or a 5% cashback offer, understanding how to quickly determine the actual savings and the final price is invaluable.
-
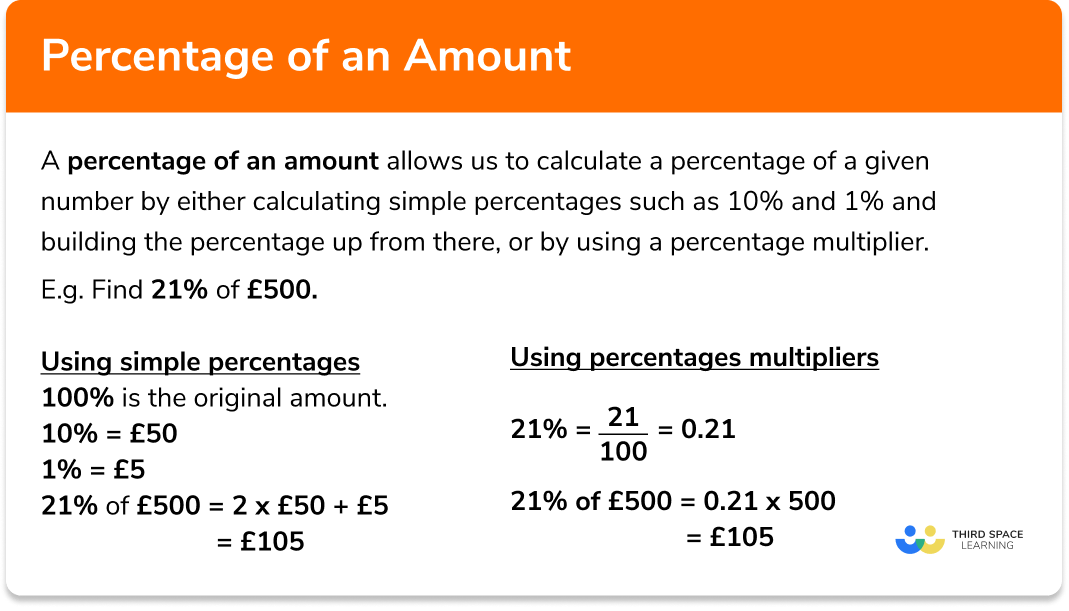
To calculate the discount amount: Multiply the original price by the percentage discount (as a decimal).
- Example: An item costs $150 with a 20% discount. Discount amount = $150 x 0.20 = $30.
-
To calculate the final price: Subtract the discount amount from the original price, or multiply the original price by (1 – discount percentage as a decimal).
- Example: Final price = $150 – $30 = $120, or $150 x (1 – 0.20) = $150 x 0.80 = $120.
Similarly, cashback rewards or service charge tips rely on the same percentage calculation methods, enabling you to manage your transactions with precision.
Understanding Interest Rates (Loans and Savings)
Interest rates are percentages that dictate the cost of borrowing money or the earnings from saving it. Mortgages, car loans, credit cards, and savings accounts all revolve around interest rate calculations.
-
Simple Interest: Interest = Principal x Rate x Time.
- Example: A $1,000 loan at 5% annual simple interest for 2 years. Interest = $1,000 x 0.05 x 2 = $100.
-
Compound Interest: This is where interest earns interest, leading to exponential growth. While the formula for future value with compound interest (FV = P(1+r)^n) can seem complex, understanding the percentage aspect of the annual interest rate (r) is key to grasping how your money grows or how your debt accumulates. A higher percentage rate means faster growth for savings and faster accumulation for debt.
Budgeting and Expense Allocation
Effective budgeting is about allocating your income across various categories. Percentages help visualize this distribution, making it easier to identify areas of overspending or opportunities for saving. Many budgeting rules, like the popular 50/30/20 rule (50% for needs, 30% for wants, 20% for savings/debt repayment), are expressed in percentages.
-
Example: If your monthly take-home pay is $4,000:
-
Needs (50%) = $4,000 x 0.50 = $2,000
-
Wants (30%) = $4,000 x 0.30 = $1,200
-
Savings/Debt (20%) = $4,000 x 0.20 = $800
-
Calculating the percentage of your income spent on housing, food, transportation, or entertainment provides critical insights into your financial habits and helps you make adjustments to align with your financial goals.
Percentages in Investing and Wealth Building
For those looking to grow their wealth, percentages are fundamental to understanding performance, risk, and portfolio diversification.
Measuring Investment Returns (ROI)
The Return on Investment (ROI) is a crucial metric for evaluating the profitability of an investment. It’s almost always expressed as a percentage.
-
ROI Formula: ROI = [(Current Value of Investment – Cost of Investment) / Cost of Investment] x 100
- Example: You invest $1,000 in a stock that grows to $1,200. ROI = [($1,200 – $1,000) / $1,000] x 100 = 20%.
Understanding ROI helps investors compare different investment opportunities and assess how efficiently their capital is being used. A 20% return in one year is generally more favorable than a 5% return, and percentages provide this clear comparative metric.
Analyzing Portfolio Allocation
Diversification is key to managing investment risk, and this is achieved by allocating your investment capital across different asset classes (stocks, bonds, real estate, etc.) or sectors. Portfolio allocation is typically described in percentages.
-
Example: An investor might have a portfolio allocation of 60% stocks, 30% bonds, and 10% real estate.
-
If their total portfolio is worth $100,000:
-
Stocks = $100,000 x 0.60 = $60,000
-
Bonds = $100,000 x 0.30 = $30,000
-
Real Estate = $100,000 x 0.10 = $10,000
-
-
Regularly checking your portfolio’s current percentage allocation against your target allocation is vital for rebalancing and maintaining your desired risk profile.
Understanding Compounding Growth
While related to interest, compounding growth extends to overall investment performance. When your investment returns themselves start earning returns, that’s compounding in action. The percentage return achieved each period compounds on the growing principal, leading to significant wealth accumulation over time. Even small percentage differences in annual returns can lead to vastly different outcomes over decades, underscoring the power of understanding how percentages amplify wealth.
Business Finance and Operational Insights
In the corporate world, percentages are indispensable for analyzing performance, identifying trends, and making strategic business decisions.
Profit Margins and Revenue Share
Businesses heavily rely on percentages to gauge their financial health and efficiency.
-
Gross Profit Margin: (Gross Profit / Revenue) x 100. This tells you the percentage of revenue left after deducting the cost of goods sold.
-
Net Profit Margin: (Net Profit / Revenue) x 100. This indicates the percentage of revenue left after all expenses, including taxes, have been deducted.
These margins are critical for comparing a company’s profitability against competitors or industry averages. Similarly, “revenue share” often refers to the percentage of total sales attributed to a specific product, service, or market segment, guiding marketing and product development strategies.
Financial Ratios for Business Health
Financial ratios, almost all of which are expressed as percentages, offer a snapshot of a company’s liquidity, solvency, efficiency, and profitability.
-
Current Ratio: (Current Assets / Current Liabilities) (often expressed as a decimal, but interpreted for its percentage implications). While not strictly a percentage, it shows how many times current assets cover current liabilities.
-
Debt-to-Equity Ratio: (Total Debt / Shareholder Equity). Often expressed as a decimal, but a ratio of 1.0 means debt equals equity (100%), providing insights into financial leverage.
-
Return on Equity (ROE): (Net Income / Shareholder Equity) x 100. This percentage reveals how much profit a company generates for each dollar of shareholder equity, a key measure of management effectiveness.
These ratios are vital for investors, creditors, and management to assess a company’s financial stability and operational effectiveness.
Sales Growth and Market Share
Businesses are constantly tracking growth metrics, and percentages are the standard way to express them.
-
Sales Growth Rate: [(Current Period Sales – Prior Period Sales) / Prior Period Sales] x 100. This percentage indicates how much a company’s sales have increased or decreased over a period.
-
Market Share: (Company’s Sales / Total Market Sales) x 100. This percentage shows a company’s proportion of the total sales within its industry, a crucial indicator of competitive standing.
These percentage-based metrics are essential for setting targets, evaluating marketing campaigns, and informing expansion strategies.
Tools and Tips for Accurate Percentage Calculations
While the underlying math is straightforward, practical application often benefits from the right tools and a disciplined approach.
Manual Calculation Formulas
For quick mental math or when a calculator isn’t handy, understanding the basic formulas is paramount:
-
Finding a percentage of a number: Multiply the number by the decimal equivalent of the percentage (e.g., 25% of 200 = 200 * 0.25 = 50).
-
Finding what percentage one number is of another: Divide the ‘part’ by the ‘whole’ and multiply by 100 (e.g., 50 is what percentage of 200? (50 / 200) * 100 = 25%).
-
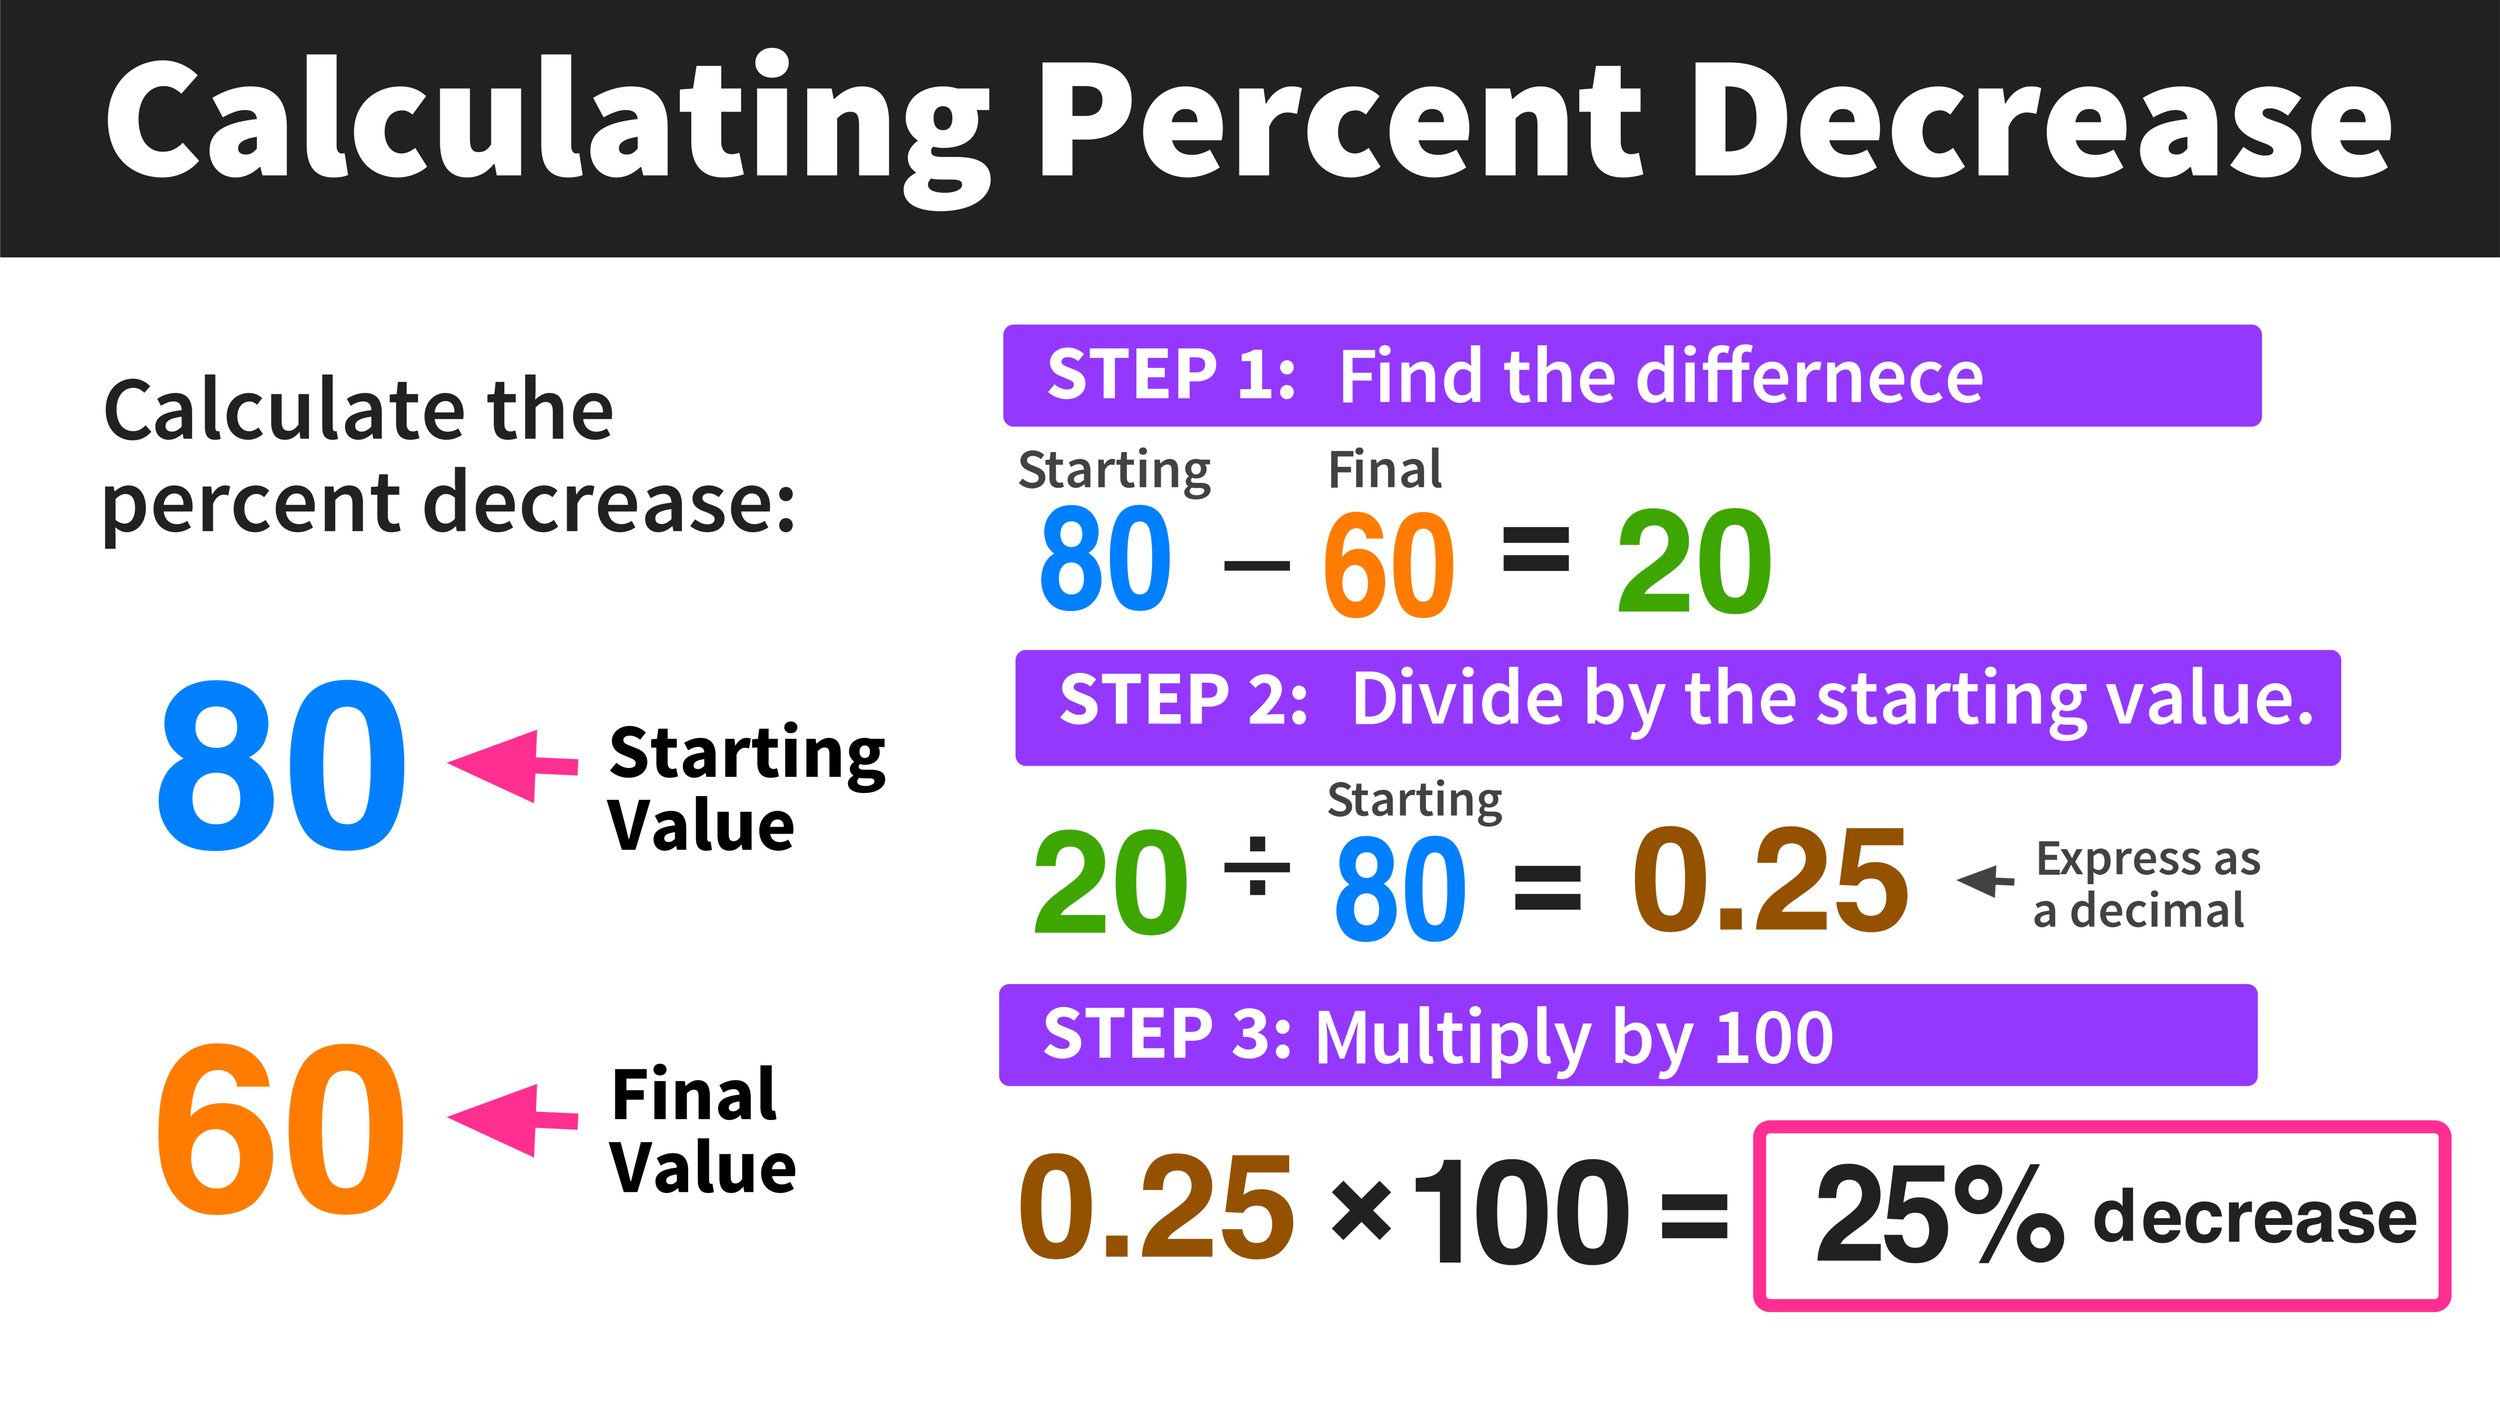
Calculating percentage increase/decrease: [(New Value – Old Value) / Old Value] x 100. Remember to subtract the smaller value from the larger value for the numerator to get a positive change.
Practicing these basic computations will build your confidence and speed.
Leveraging Spreadsheets and Financial Calculators
For more complex calculations, especially in budgeting, investing, or business analysis, digital tools are indispensable.
-
Spreadsheets (Excel, Google Sheets): These are perhaps the most powerful tools. They allow you to set up formulas once and apply them to vast datasets. Functions like
=PERCENTAGE(), or simply formatting cells as percentages, streamline the process. They’re perfect for tracking budgets, calculating ROIs across multiple investments, or generating financial statements. -
Online Financial Calculators: Websites often provide specialized calculators for mortgage payments, compound interest, loan amortizations, and investment growth. These tools simplify complex formulas, requiring only basic inputs to yield sophisticated percentage-based results.
-
Smartphone Calculator Apps: Most modern calculators have a ‘%’ button, which can quickly perform common percentage operations like finding a percentage of a number or adding/subtracting a percentage.
Avoiding Common Mistakes
Even with simple concepts, errors can occur. Be mindful of:
-
Converting percentages to decimals correctly: Always divide the percentage by 100 before multiplying (e.g., 5% becomes 0.05).
-
Identifying the ‘whole’ correctly: Ensure you’re dividing by the correct base amount, especially in percentage change calculations where the ‘old value’ is crucial.
-
Understanding what the percentage represents: Is it a discount, a tax, a growth rate, or a proportion? The context dictates the interpretation and subsequent actions.
-
The difference between percentage points and percentage change: A rise from 10% to 12% is a 2 percentage point increase, but a (2/10)*100 = 20% *percentage change*.
In conclusion, the ability to “get the percentage of” is a fundamental financial superpower. It empowers you to navigate the complexities of personal finance, make informed investment decisions, and gain deep insights into business performance. By understanding the core concept, applying it across various financial contexts, and utilizing the right tools, you can transform raw numbers into meaningful intelligence, paving the way for greater financial clarity and success.
aViewFromTheCave is a participant in the Amazon Services LLC Associates Program, an affiliate advertising program designed to provide a means for sites to earn advertising fees by advertising and linking to Amazon.com. Amazon, the Amazon logo, AmazonSupply, and the AmazonSupply logo are trademarks of Amazon.com, Inc. or its affiliates. As an Amazon Associate we earn affiliate commissions from qualifying purchases.