
In the intricate world of finance, numbers speak a universal language. Among the most crucial and frequently encountered numerical concepts is the percentage. From personal budgeting and understanding investment returns to dissecting business financial statements and navigating tax implications, mastering how to find the percentage of an amount is not merely a mathematical exercise—it’s a fundamental skill for financial literacy and empowerment. This article will demystify percentages, providing a comprehensive guide to their calculation and illustrating their indispensable role across various financial landscapes. Whether you’re a budding investor, a meticulous budgeter, or simply someone looking to make more informed financial decisions, a solid grasp of percentages will serve as an invaluable tool in your financial arsenal.
The Foundational Understanding of Percentages
Before diving into complex financial scenarios, it’s essential to establish a robust understanding of what percentages are and the simple formula that underpins all their applications. A percentage is more than just a number followed by a ‘%’ sign; it’s a powerful way to express proportions and comparisons.
What Exactly is a Percentage?
The word “percentage” derives from the Latin “per centum,” meaning “by the hundred.” Fundamentally, a percentage is a way of expressing a number as a fraction of 100. It’s a dimensionless number used to express a proportion or a part of a whole. For instance, if you say “50% of your income,” it means 50 parts out of every 100 parts of your income, which simplifies to half. This standardization to a base of 100 makes comparing different quantities straightforward, even if their original total amounts are vastly different. It allows for quick, intuitive understanding of relative values, which is incredibly useful in financial contexts where diverse sums of money are constantly being evaluated.
Why Percentages Matter in Finance
Percentages are the bedrock of countless financial calculations and analyses. They provide a standardized metric to compare financial performance, assess risk, understand growth, and quantify shares. Imagine trying to compare the performance of two different investments—one that started with $1,000 and gained $100, and another that started with $10,000 and gained $500. Without percentages, it would be difficult to discern which performed relatively better. The first gained 10% ($100/$1000 * 100), while the second gained 5% ($500/$10000 * 100). The first investment, despite a smaller absolute gain, shows a higher percentage return, indicating better relative performance. This single example illustrates why percentages are crucial for clear, concise financial communication and decision-making across personal finance, investing, business, and economics.
The Core Formula: Part / Whole x 100
At the heart of every percentage calculation lies a simple, universal formula. To find what percentage one amount (the “part”) is of another amount (the “whole”), you divide the part by the whole and then multiply the result by 100.
Formula: (Part / Whole) × 100 = Percentage
Let’s break it down:
-
Part: This is the specific amount or quantity you are interested in expressing as a percentage.
-
Whole: This is the total, original, or base amount that the “part” is a component of.
-
Division (Part / Whole): This step converts the fraction into a decimal.
-
Multiplication by 100: This step converts the decimal into a percentage.
Example (Non-Financial): If you scored 45 points on a test out of a possible 50 points, what percentage did you score?
-
Part = 45
-
Whole = 50
-
Calculation: (45 / 50) × 100 = 0.9 × 100 = 90%
You scored 90% on the test. This fundamental principle applies universally, whether you’re calculating a test score or a discount on a new car.
Practical Applications in Personal Finance
Percentages are an everyday reality in personal finance. From the moment you check your bank balance to planning for retirement, percentages provide the context and clarity needed to manage your money effectively.
Calculating Discounts and Savings
One of the most common applications of percentages is in understanding discounts. Retailers frequently advertise sales as percentages off the original price.
Example: You see a jacket originally priced at $200 with a “25% off” tag.
To find the discount amount:
-
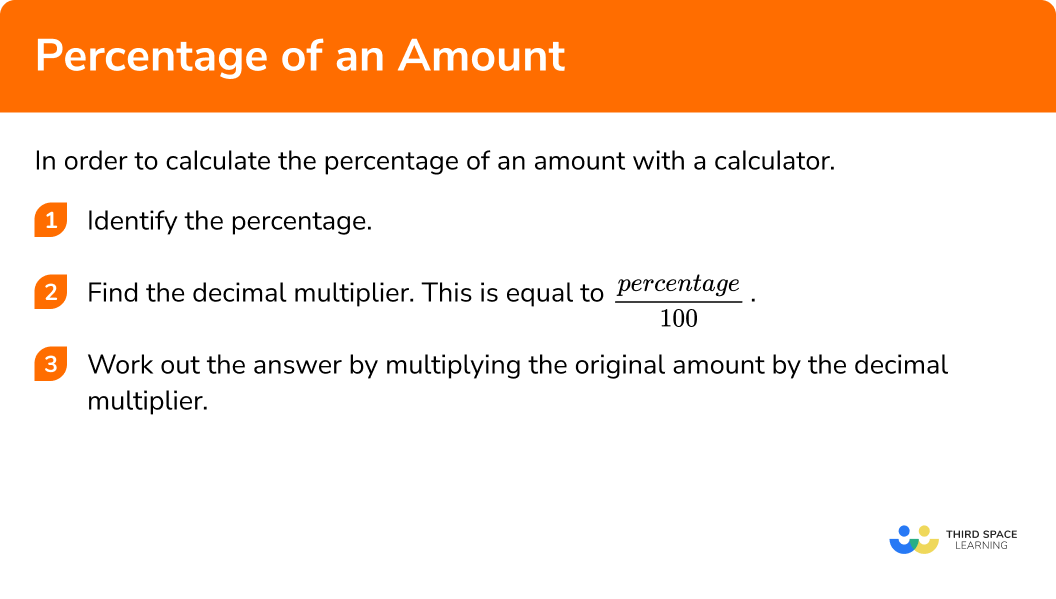
Discount Amount = Original Price × Percentage Discount (as a decimal)
-
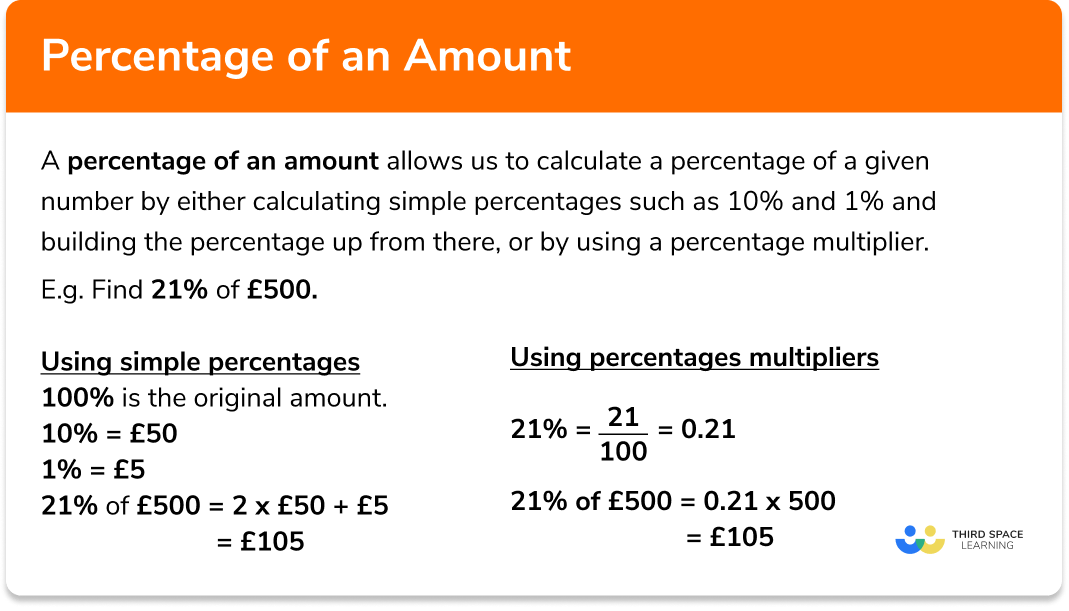
Discount Amount = $200 × 0.25 (since 25% = 25/100 = 0.25)
-
Discount Amount = $50
To find the final price:
-
Final Price = Original Price – Discount Amount
-
Final Price = $200 – $50 = $150
Alternatively, if 25% is off, you’re paying 75% of the original price: $200 × 0.75 = $150. Understanding this allows you to quickly assess the true cost and savings.
Understanding Interest Rates (Loans & Savings)
Interest is the cost of borrowing money or the reward for saving it, almost always expressed as a percentage.
Example (Simple Interest): You take out a $10,000 loan with a simple annual interest rate of 5%.
To find the annual interest payment:
-
Annual Interest = Principal Amount × Interest Rate (as a decimal)
-
Annual Interest = $10,000 × 0.05
-
Annual Interest = $500
If the loan term is 3 years, the total simple interest would be $500 × 3 = $1,500. This is a simplified example; most loans involve compound interest, where interest is calculated on the initial principal and also on the accumulated interest from previous periods. While the calculation becomes more complex, the core percentage concept remains. Similarly, savings accounts accrue interest, helping your money grow.
Budgeting and Expense Analysis
Budgeting involves allocating your income to various expenses and savings goals. Percentages are vital for understanding where your money goes and ensuring you stay within financial targets.
Example: Your monthly take-home income is $4,000. You spend $1,200 on rent.
To find the percentage of income spent on rent:
-
Percentage = (Rent Expense / Total Income) × 100
-
Percentage = ($1,200 / $4,000) × 100 = 0.30 × 100 = 30%
This percentage allows you to compare your rent burden against common financial guidelines, like the 30% rule for housing costs. Similarly, you can calculate what percentage of your income goes to groceries, transportation, or entertainment, helping you identify areas for potential savings.
Taxes and Deductions

Taxes are an unavoidable part of financial life, and they are predominantly percentage-based. Sales tax, income tax, property tax—all leverage percentages.
Example (Sales Tax): You buy an item for $50 in a state with a 7% sales tax.
To find the sales tax amount:
-
Sales Tax Amount = Item Price × Sales Tax Rate (as a decimal)
-
Sales Tax Amount = $50 × 0.07
-
Sales Tax Amount = $3.50
Total cost = $50 + $3.50 = $53.50.
For income tax, your tax bracket defines the percentage of your income (or portions of it) that you owe to the government. Understanding how deductions reduce your taxable income, often as a percentage of your total income, is key to effective tax planning.
Percentages in Investment and Business Finance
Beyond personal spending, percentages form the backbone of investment analysis and business performance evaluation. They allow for standardized comparisons and insights into growth, profitability, and financial health.
Investment Returns and Growth
When you invest, whether in stocks, bonds, or real estate, you’re primarily interested in the return on your investment, which is almost always expressed as a percentage.
Example (Return on Investment – ROI): You invest $5,000 in a stock and sell it for $6,000.
-
Profit = Selling Price – Initial Investment = $6,000 – $5,000 = $1,000
-
ROI = (Profit / Initial Investment) × 100
-
ROI = ($1,000 / $5,000) × 100 = 0.20 × 100 = 20%
This 20% ROI tells you that for every dollar invested, you made 20 cents profit. This metric is crucial for comparing the effectiveness of different investment opportunities, regardless of the initial capital involved. Compound annual growth rate (CAGR), while more complex, also uses percentages to show the smooth, annualized growth rate over multiple periods.
Profit Margins and Business Performance
For businesses, percentages are critical for assessing profitability and operational efficiency. Key metrics like gross profit margin and net profit margin are expressed as percentages.
Gross Profit Margin: This indicates how much profit a company makes from its sales after accounting for the direct costs of producing its goods or services.
- Formula: (Gross Profit / Revenue) × 100
Net Profit Margin: This shows the percentage of revenue left after all expenses, including taxes and interest, have been deducted. It’s a key indicator of a company’s overall profitability.
- Formula: (Net Profit / Revenue) × 100
A business with a 15% net profit margin means that for every dollar of sales, 15 cents are left as profit after all costs are covered. These percentages are vital for investors to gauge a company’s financial health and for management to identify areas for improvement.
Financial Ratios for Business Analysis
Financial ratios are powerful analytical tools that use percentages to compare different items on a company’s financial statements, providing insights into liquidity, solvency, efficiency, and profitability. For example:
-
Debt-to-Equity Ratio: Often expressed as a percentage, it indicates the proportion of equity and debt used to finance a company’s assets. A high percentage can signal higher risk.
-
Current Ratio: While not strictly a percentage, it’s often discussed in terms of proportions (e.g., 2:1 ratio), providing a quick measure of a company’s ability to cover its short-term liabilities with its short-term assets.
These ratios enable analysts and investors to perform “apples-to-apples” comparisons between companies of different sizes or within the same industry, highlighting strengths and weaknesses that absolute numbers alone cannot.
Inflation and Purchasing Power
Inflation, defined as the rate at which the general level of prices for goods and services is rising, and consequently, the purchasing power of currency is falling, is always expressed as a percentage.
Example: If the annual inflation rate is 3%, it means that, on average, goods and services cost 3% more than they did a year ago.
Understanding inflation helps individuals and businesses plan for future costs and investment returns. A salary increase of 2% in a 3% inflation environment actually means a decrease in real purchasing power. This percentage-based metric is crucial for long-term financial planning and preserving wealth.
Advanced Tips and Common Pitfalls
While the core percentage formula is straightforward, nuances exist that can lead to misinterpretations if not handled carefully. Being aware of these can prevent costly errors and enhance your financial acumen.
The Importance of the “Whole”: Identifying the Base Amount
A common mistake is incorrectly identifying the “whole” or the base amount in a percentage calculation. The percentage will always be relative to the base you choose.
Example: A stock price drops from $100 to $80. This is a 20% decrease (($100-$80)/$100 * 100).
If it then increases from $80 back to $100, the increase is 25% (($100-$80)/$80 * 100).
Notice how the “whole” changes—it’s the original amount from which the change occurred. Failing to correctly identify the base can lead to significant miscalculations, especially in investment performance or budgeting analysis.
Percentage Increase vs. Percentage Decrease
The calculation for percentage change involves comparing a “new” value to an “old” value.
-
Percentage Increase: ((New Value – Old Value) / Old Value) × 100
-
Percentage Decrease: ((Old Value – New Value) / Old Value) × 100
It’s crucial that the denominator (the “whole”) is always the original or starting value. This ensures consistency and accuracy in measuring the magnitude of change.
Cumulative Percentages and Misinterpretations
It’s a common misconception that successive percentage changes can simply be added or subtracted. This is incorrect because the base amount changes with each successive percentage.
Example: A product is priced at $100. It’s first discounted by 10%, then an additional 10% discount is applied to the sale price.
-
First discount: $100 – (10% of $100) = $100 – $10 = $90
-
Second discount: $90 – (10% of $90) = $90 – $9 = $81
The total discount is $19, not $20 (10% + 10%). The combined discount is 19% ($19/$100 * 100). This is a critical concept in understanding investment growth, inflation effects, or stacked discounts in retail.
Leveraging Financial Tools
While mental math and basic calculators are useful, financial tools can simplify complex percentage calculations and minimize errors.
-
Spreadsheets (Excel, Google Sheets): These are invaluable for budgeting, financial modeling, and investment tracking. They allow you to set up formulas once and apply them to large datasets.
-
Online Percentage Calculators: Many websites offer free tools for quick calculations.
-
Financial Calculators/Apps: Dedicated financial calculators can handle more complex scenarios like compound interest, loan amortizations, and future value calculations, which rely heavily on percentages.
Learning to use these tools effectively will significantly enhance your financial analysis capabilities.
Conclusion
Understanding how to find the percentage of an amount is not merely an academic exercise; it is a vital skill for navigating the complexities of the financial world. From making informed personal budgeting decisions to evaluating investment opportunities and comprehending economic indicators, percentages provide the standardized language necessary for clear and effective financial analysis. By mastering the core formula, recognizing its diverse applications across personal and business finance, and being aware of common pitfalls, you equip yourself with the confidence to interpret financial data accurately. As you continue your financial journey, consistent practice and the judicious use of available tools will solidify your understanding, empowering you to make smarter, more strategic financial choices that contribute to your long-term prosperity. Embrace percentages as your trusted financial compass, guiding you toward greater financial literacy and success.
aViewFromTheCave is a participant in the Amazon Services LLC Associates Program, an affiliate advertising program designed to provide a means for sites to earn advertising fees by advertising and linking to Amazon.com. Amazon, the Amazon logo, AmazonSupply, and the AmazonSupply logo are trademarks of Amazon.com, Inc. or its affiliates. As an Amazon Associate we earn affiliate commissions from qualifying purchases.