
In the realm of personal finance, investment analysis, and corporate accounting, the ability to quantify change is fundamental to making informed decisions. While nominal figures tell you how much money has moved, percentages tell you the story behind those numbers. Finding the percent decrease between two values is a critical skill for anyone looking to track budget optimizations, evaluate investment losses, or measure the efficiency of cost-cutting measures in a business environment.
Understanding percent decrease allows you to move beyond simple subtraction. It provides a relative scale that makes data points comparable across different timeframes and asset classes. Whether you are calculating the drop in a stock’s price during a market correction or measuring the impact of a new savings strategy on your monthly overhead, mastering this calculation is a prerequisite for financial literacy.
The Mathematical Foundation of Percent Decrease
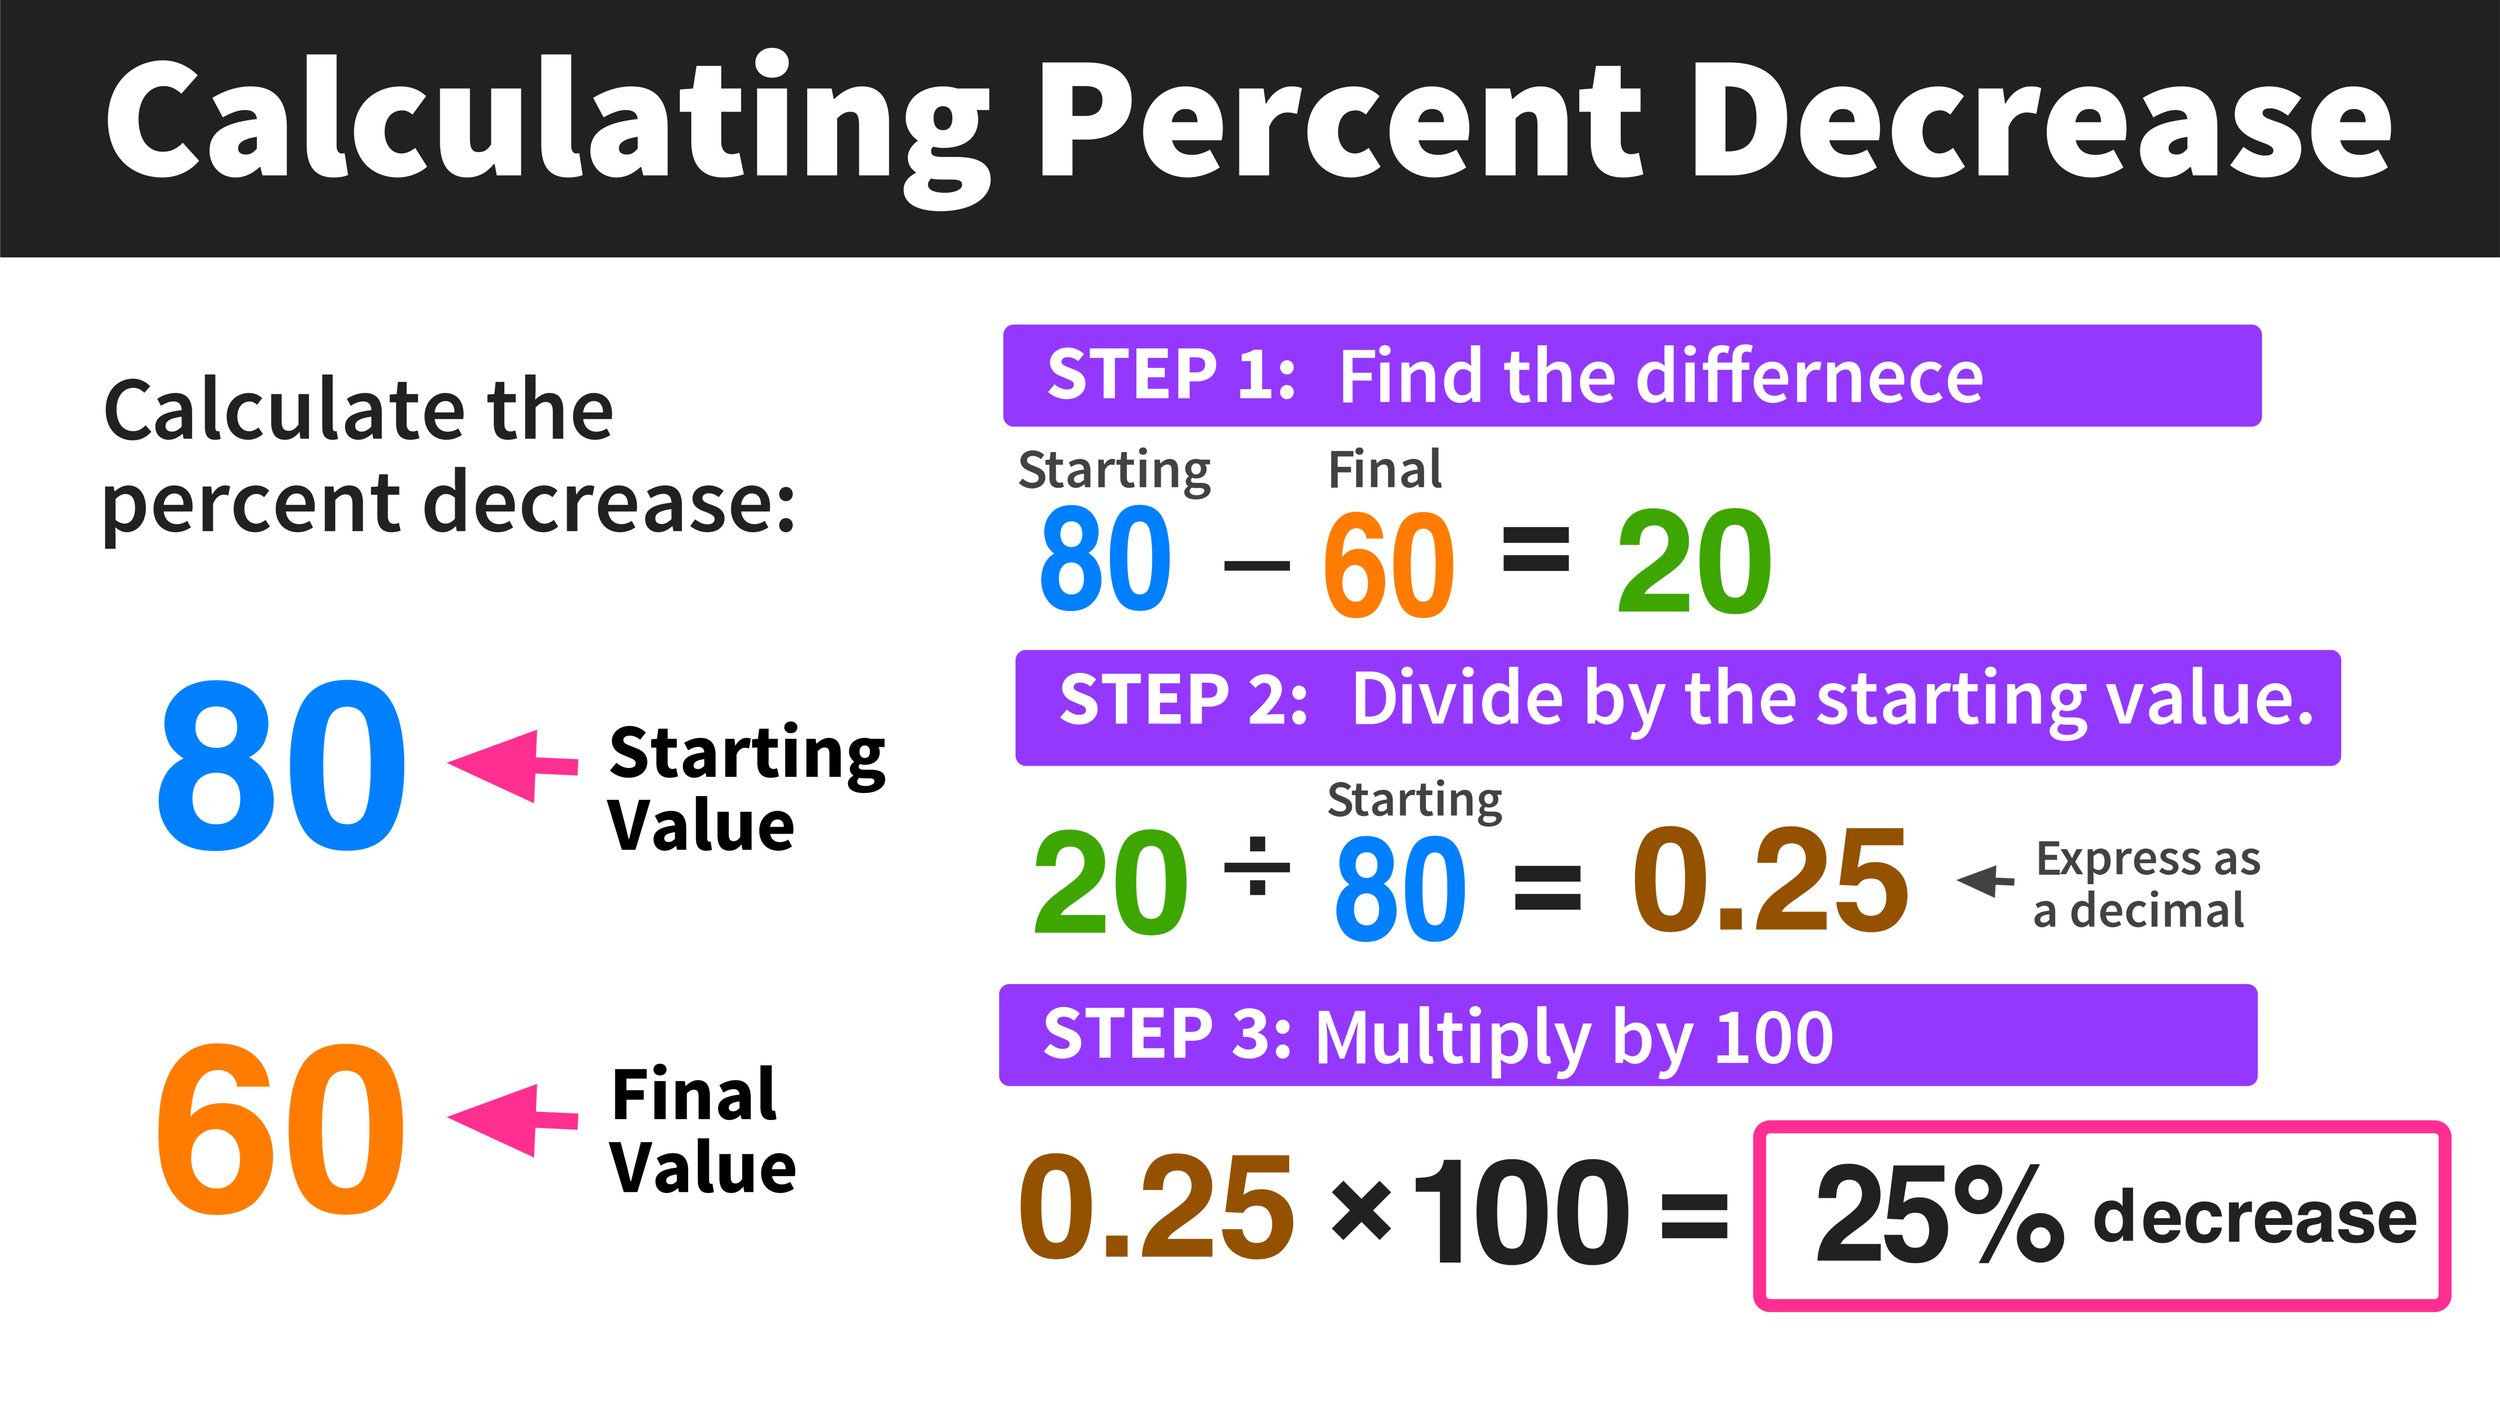
To calculate the percent decrease between two numbers, you must follow a logical sequence that isolates the change relative to the starting point. The mathematical formula is straightforward, but its application requires a clear understanding of which number serves as the “base.”
The Percent Decrease Formula
The standard formula for percent decrease is:
((Original Value – New Value) / Original Value) × 100
To arrive at the correct percentage, follow these three steps:
-
Find the absolute difference: Subtract the new, lower value from the original, higher value. This gives you the total amount of the decrease in nominal terms.
-
Divide by the original value: Take the difference found in step one and divide it by the starting number. This is the most crucial step; many errors occur when users divide by the new number instead of the original. This division produces a decimal.
-
Convert to a percentage: Multiply the resulting decimal by 100.
For example, if your monthly business expenses dropped from $5,000 to $4,200, the calculation would look like this:
-
$5,000 – $4,200 = $800 (The nominal decrease)
-
$800 / $5,000 = 0.16
-
0.16 × 100 = 16%
Why the “Original Value” Matters
In finance, the original value represents your baseline or your “at-risk” capital. When calculating a decrease, we are interested in knowing what portion of the initial investment or budget has been lost or removed. Using the new value as the denominator would skew the results, making the percentage appear larger than it actually is. This distinction is vital for maintaining accurate records and ensuring that your financial reporting remains consistent with industry standards.
Percent Decrease in Investment Portfolios and Market Analysis
For investors, the percent decrease is more than just a number; it is a measure of volatility and risk. In the context of the stock market, percent decreases are frequently referred to as “drawdowns.” Understanding these figures helps investors manage their emotional responses to market fluctuations and plan their long-term strategies.
Understanding Drawdowns and Volatility
A drawdown is the peak-to-trough decline during a specific period for an investment or portfolio. If your portfolio value was $100,000 at its height and fell to $80,000 during a market dip, you have experienced a 20% decrease.
Financial analysts use percent decrease to compare the volatility of different assets. For instance, a blue-chip stock might experience a 5% decrease during a week of market turbulence, while a high-growth tech stock might see a 15% decrease. By converting these nominal drops into percentages, an investor can clearly see which asset carries a higher risk profile relative to its price point.
The Math of Recovery: The Asymmetric Nature of Percentages
One of the most important concepts in finance is the realization that percent decreases and percent increases are not symmetrical. If an investment loses 50% of its value, it does not need a 50% increase to get back to the break-even point; it needs a 100% increase.
Consider this: An investment of $100 drops by 20%. The new value is $80. To return to $100, the $80 investment must gain $20. However, $20 is 25% of $80. Therefore, a 20% decrease requires a 25% increase just to recover the initial capital. This mathematical reality highlights why minimizing percent decreases—through diversification and stop-loss orders—is often more important for long-term wealth accumulation than chasing high-percentage gains.

Strategic Applications in Personal Finance and Budgeting
On a personal level, calculating percent decrease is the primary method for evaluating the success of a financial plan. When you set a goal to “spend less,” the percent decrease provides the metric for your progress.
Optimizing Household Expenses
When auditing a personal budget, you might identify “leaks”—unnecessary subscriptions, high utility bills, or excessive dining out. If you manage to reduce your monthly grocery bill from $800 to $600 through meal planning and bulk purchasing, you have achieved a 25% decrease.
This percentage is a powerful motivational tool. It allows you to see the efficiency of your efforts. While a $200 saving is significant, knowing that you have cut a specific category by a full quarter of its original cost provides a clearer sense of victory and helps you decide where to focus your efforts next. If another category, such as entertainment, only saw a 5% decrease despite similar effort, you know that your “Return on Effort” is higher in the grocery category.
Debt Reduction and Interest Savings
Percent decrease is also applicable to debt management. If you are aggressively paying down a credit card balance, you can track the percent decrease of your total debt over time. Furthermore, if you refinance a loan from an 8% interest rate to a 5% interest rate, you aren’t just saving three percentage points; you are looking at a 37.5% decrease in the interest rate itself. This massive reduction in the cost of borrowing can save thousands of dollars over the life of a loan, illustrating how small nominal changes can represent massive percentage shifts in financial obligations.
Corporate Finance: Driving Efficiency Through Data
In a business context, the percent decrease is a Key Performance Indicator (KPI) used to measure operational efficiency, cost management, and market share shifts. CFOs and business owners rely on these calculations to report to stakeholders and adjust corporate strategy.
Reducing Cost of Goods Sold (COGS) and Overhead
Profitability is driven by two main factors: increasing revenue or decreasing costs. When a company negotiates better rates with suppliers or implements automation to reduce labor costs, they measure the success of these initiatives via percent decrease in COGS. A 2% decrease in production costs for a multi-million dollar manufacturing firm can translate into hundreds of thousands of dollars in added net profit.
Similarly, monitoring the percent decrease in “churn rate” (the rate at which customers stop doing business with an entity) is vital for subscription-based businesses. If a company reduces its churn rate from 10% to 8%, that is a 20% decrease in customer loss, which significantly increases the Lifetime Value (LTV) of the customer base.
Inventory Management and Waste Reduction
Businesses that carry physical products use percent decrease to track inventory turnover and waste. A decrease in “shrinkage” (lost or stolen inventory) directly impacts the bottom line. By calculating the percent decrease in waste after implementing new inventory tracking software, a business can justify the software’s ROI. If waste fell from 4% of total inventory to 3%, the company has achieved a 25% reduction in loss, demonstrating the effectiveness of the digital tool.
Leveraging Digital Tools for Automated Calculations
While understanding the manual formula is essential for conceptual clarity, modern financial management relies on digital tools to handle these calculations at scale. Whether you are using a spreadsheet or specialized accounting software, automation ensures accuracy and saves time.
Using Microsoft Excel and Google Sheets
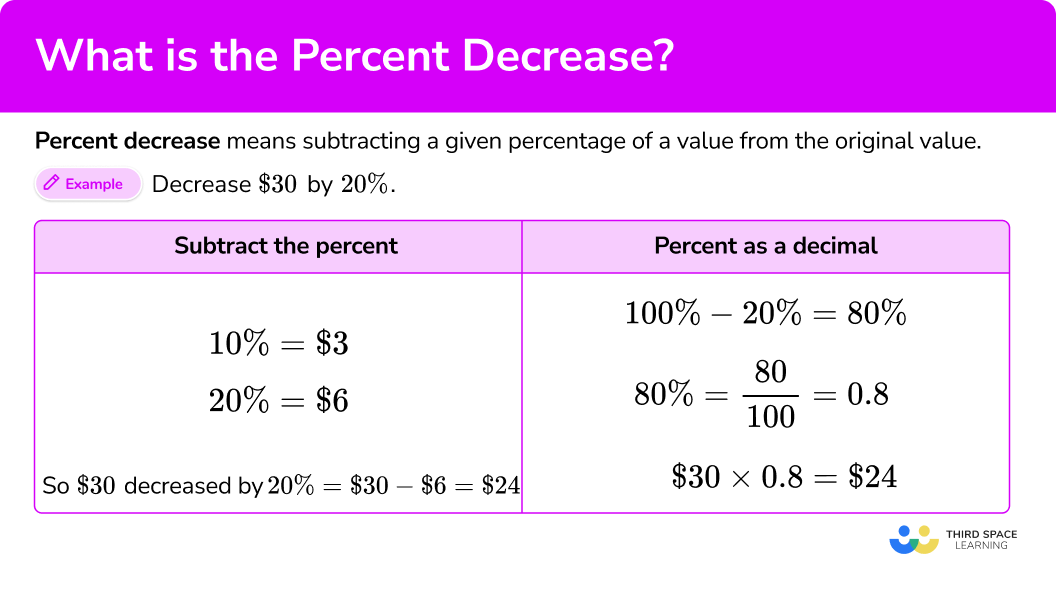
In a spreadsheet environment, you don’t need to perform the subtraction and division separately. You can use a single formula to find the percent decrease between two cells. If your original value is in cell A1 and your new value is in cell B1, the formula is:
=(A1-B1)/A1
After entering this formula, you simply format the cell as a “Percentage” using the toolbar. This is particularly useful when tracking monthly financial statements where you want to compare the current month’s performance against the previous month across dozens of different line items simultaneously.
The Role of Financial Calculators and Apps
For on-the-go analysis, various financial apps and specialized calculators offer “Delta %” functions. These are used by real estate investors to quickly calculate the drop in property prices or by currency traders to monitor pips and percentage shifts in exchange rates. By inputting the “Before” and “After” values, these tools provide instant data, allowing for rapid-fire decision-making in fast-moving markets.
In conclusion, the ability to find the percent decrease between two numbers is a cornerstone of financial intelligence. It transforms raw data into actionable insights, allowing individuals and businesses to measure progress, evaluate risk, and optimize performance. By mastering both the manual calculation and the digital tools available, you gain a sharper perspective on your financial trajectory, ensuring that every dollar saved or lost is understood in its proper context.
aViewFromTheCave is a participant in the Amazon Services LLC Associates Program, an affiliate advertising program designed to provide a means for sites to earn advertising fees by advertising and linking to Amazon.com. Amazon, the Amazon logo, AmazonSupply, and the AmazonSupply logo are trademarks of Amazon.com, Inc. or its affiliates. As an Amazon Associate we earn affiliate commissions from qualifying purchases.