
In the dynamic world of finance, be it personal wealth management, investment analysis, or corporate strategy, the concept of “growth” is paramount. But growth isn’t just about things getting bigger; it’s about understanding the rate at which they are expanding or contracting. This is where percent growth comes in. Far more insightful than raw numbers alone, percent growth provides a standardized, comparable metric that allows you to assess performance, identify trends, and make informed decisions across diverse financial contexts.
From tracking the performance of your investment portfolio to evaluating a company’s revenue trajectory, or even understanding the impact of inflation on your purchasing power, knowing how to accurately calculate percent growth is a fundamental financial skill. It empowers you to move beyond superficial observations and delve into the true momentum of financial changes. This guide will demystify the process, providing you with the tools and understanding to confidently calculate and interpret percent growth in any financial scenario.
The Fundamentals of Percent Growth Calculation
At its core, calculating percent growth is a straightforward process that compares a new value to an old value to determine the relative change. This relative change is then expressed as a percentage, offering a universal language for growth or decline.
Understanding the Basic Formula
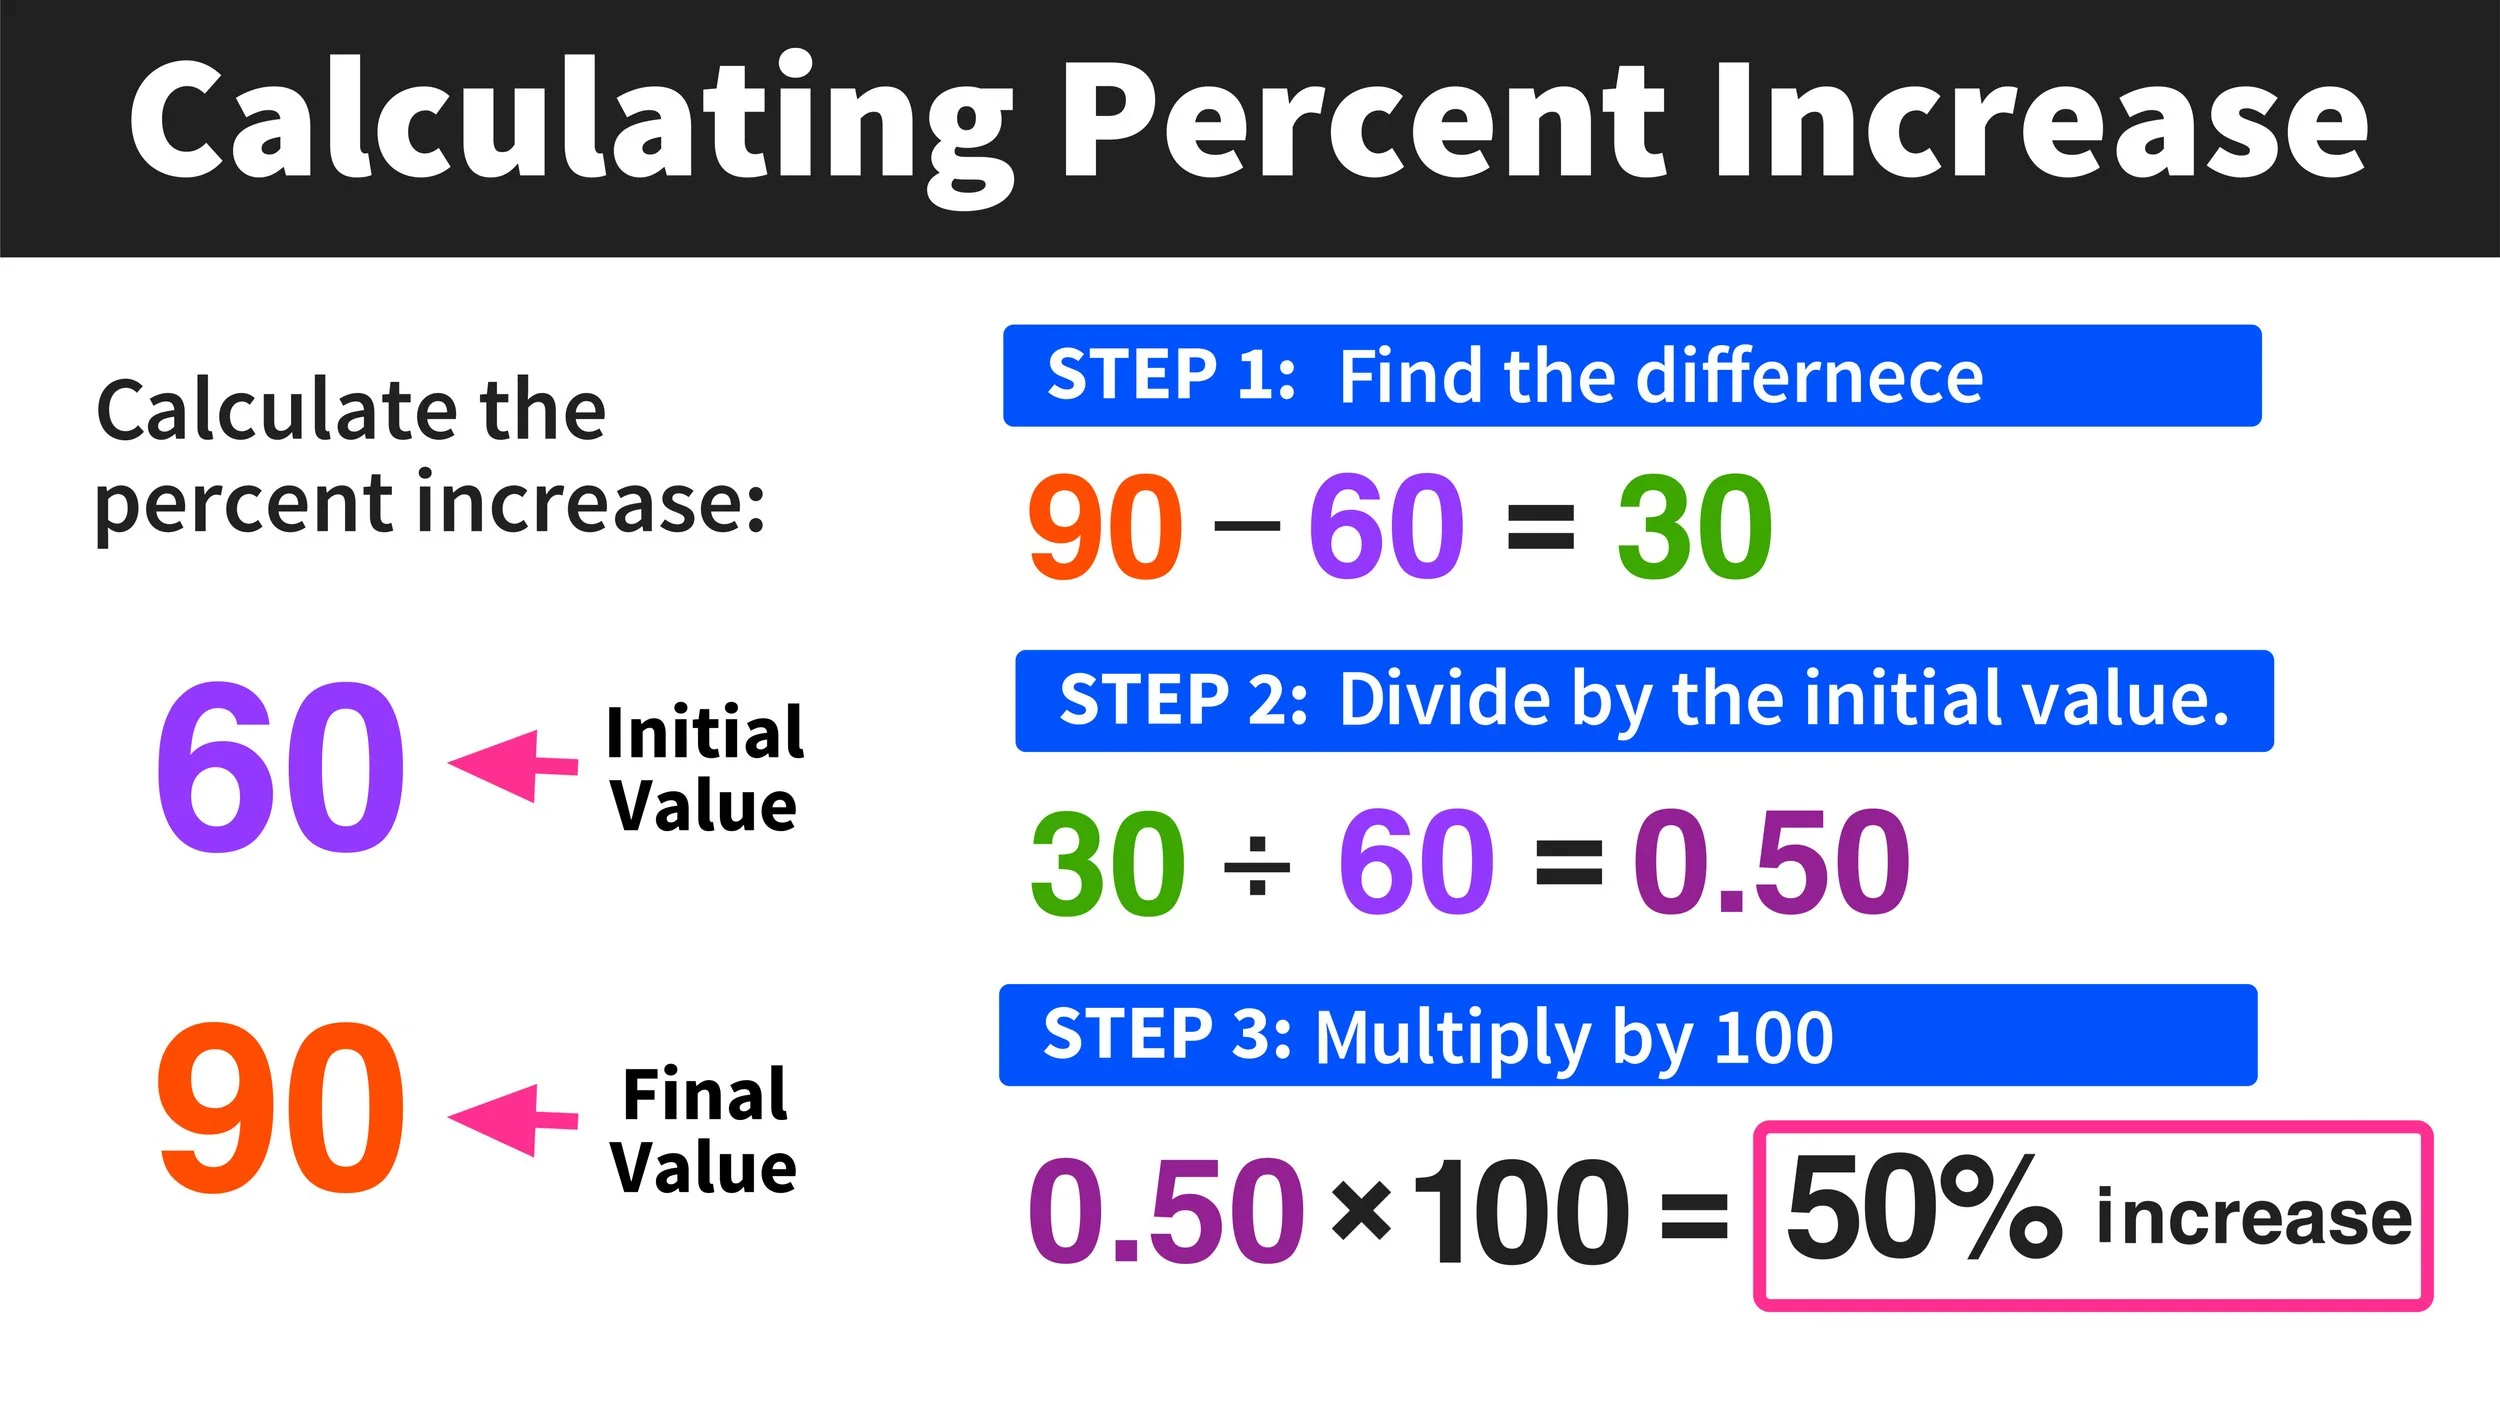
The foundational formula for percent growth is simple yet powerful:
Percent Growth = ((New Value – Old Value) / Old Value) * 100%
Let’s break down each component:
-
New Value (or Current Value): This is the more recent or end-period figure you are analyzing. For example, the current price of a stock, your portfolio balance today, or a company’s latest quarterly revenue.
-
Old Value (or Original/Base Value): This is the earlier or starting-period figure against which you are comparing the new value. It acts as the baseline for your calculation. For example, the stock price when you bought it, your portfolio balance at the start of the year, or the company’s revenue from the previous quarter.
-
Difference (New Value – Old Value): This part of the formula calculates the absolute change between the two periods. A positive difference indicates an increase, while a negative difference signifies a decrease.
-
Dividing by Old Value: By dividing the difference by the old value, you are determining the proportional change relative to the starting point. This is crucial because a $100 increase means very different things if the original value was $100 (100% growth) versus $1,000,000 (0.01% growth).
-
Multiplying by 100%: This final step converts the decimal proportion into a percentage, making it easily understandable and comparable.
Example:
Imagine you bought a stock for $50 per share (Old Value). A year later, it’s trading at $65 per share (New Value).
Percent Growth = (($65 – $50) / $50) * 100%
Percent Growth = ($15 / $50) * 100%
Percent Growth = 0.30 * 100%
Percent Growth = 30%
This tells you your stock has grown by 30% over that period.
Interpreting Positive and Negative Growth
The sign of your percent growth figure provides critical insight into the direction of change:
-
Positive Percent Growth: A result greater than 0% indicates an increase or expansion. The asset, metric, or value has grown from its original state. For instance, a 15% revenue growth means the company earned 15% more than in the previous period.
-
Negative Percent Growth: A result less than 0% (e.g., -5%, -20%) indicates a decrease, contraction, or decline. This means the asset, metric, or value has shrunk. A -10% portfolio growth means your investments lost 10% of their value. When calculating a decrease, it’s often referred to as “percent decrease” but uses the exact same formula.
-
Zero Percent Growth: A 0% result means there has been no change whatsoever between the new and old values. The value remained stagnant.
Understanding these interpretations is as important as the calculation itself, as it provides immediate context for the financial data you are analyzing.
Practical Applications in Personal Finance and Investing
For individuals, percent growth is an indispensable tool for navigating the complexities of personal finance and investment decisions. It allows for clear, data-driven assessments of financial health and progress towards goals.
Tracking Investment Returns
One of the most common applications of percent growth is in evaluating the performance of your investments.
-
Calculating Portfolio Growth: You can calculate the percent growth of your entire investment portfolio over various periods (monthly, quarterly, annually). This involves comparing the total value of your portfolio at the end of a period to its value at the beginning, factoring in any contributions or withdrawals made during that time (though for simpler “pure growth” calculations, you’d isolate the market movement). For example, if your portfolio was worth $100,000 on January 1st and $112,000 on December 31st (assuming no additional deposits or withdrawals), that’s a 12% annual return.
-
Comparing Different Investments: Percent growth allows you to compare the performance of dissimilar investments on an equal footing. Did Stock A grow by 20% while Fund B grew by 15% in the same period? This relative measure helps you identify which investments are delivering better returns, aiding in asset allocation decisions.
-
Annualized vs. Cumulative Growth: For investments held over multiple years, you might calculate cumulative growth (total growth over the entire period) or annualized growth (the average annual rate of return, often accounting for compounding). While the basic formula gives cumulative growth for a single period, advanced formulas are used for annualized returns, particularly when dealing with varying growth rates year-over-year.
Monitoring Personal Net Worth and Savings
Percent growth isn’t just for volatile markets; it’s a powerful metric for tracking your overall financial health.
-
How Your Wealth Grows (or Shrinks): By calculating the percent change in your net worth (assets minus liabilities) from one period to the next, you gain a clear picture of your financial trajectory. A consistent positive percent growth in net worth indicates effective financial management, saving, and investing.
-
Setting Financial Goals: Percent growth provides a quantifiable way to set and track progress towards financial goals. Want to grow your savings by 10% this year? You can use the percent growth calculation to monitor whether you’re on track to achieve that target through a combination of contributions and investment returns.
Analyzing Cost of Living Increases (Inflation)
Percent growth also helps you understand external economic factors that impact your money.
-
Inflation as “Negative” Purchasing Power Growth: Inflation, often expressed as a percentage, signifies the rate at which the general level of prices for goods and services is rising, and consequently, the purchasing power of currency is falling. If inflation is 3%, your money buys 3% less than it did a year ago. Understanding this helps you realize why your income needs to grow at least at the rate of inflation to maintain your standard of living.
-
Why Your Income Needs to Keep Up: By comparing your annual salary increase (percent growth in income) against the rate of inflation, you can determine if your real (inflation-adjusted) income is growing, stagnant, or declining. If your raise is 2% and inflation is 4%, your purchasing power has effectively decreased by 2%.
Business Finance and Performance Measurement
In the corporate world, percent growth metrics are the backbone of financial reporting, strategic planning, and investor relations. Businesses constantly analyze various aspects of their operations using these calculations to gauge health and potential.
Revenue and Profit Growth
These are perhaps the most closely watched metrics for any business.
-
Key Metrics for Business Health: Investors, analysts, and management meticulously track revenue growth (the growth in sales) and profit growth (the growth in net income). Healthy and consistent positive growth in these areas is often indicative of a well-performing, expanding business.
-
Quarter-over-Quarter, Year-over-Year Comparisons: Businesses typically report these figures over specific periods. Comparing this quarter’s revenue to last quarter’s (quarter-over-quarter growth) or this year’s to last year’s (year-over-year growth) provides crucial context for performance trends. Significant changes in these percentages can signal shifts in market conditions, competitive landscape, or operational efficiency.
-
Understanding the Drivers of Growth: Beyond just the numbers, understanding what is driving the percent growth (e.g., increased sales volume, higher prices, new product lines, market expansion) is vital for strategic decision-making.
Customer Base and Market Share Growth
Growth isn’t solely about financial figures; it extends to operational metrics as well.
-
Beyond Just Financial Numbers: Businesses track the percent growth in their customer base (e.g., number of subscribers, active users, unique visitors). For a subscription service, a 25% year-over-year growth in subscribers is a strong indicator of market acceptance and future revenue potential.
-
Growth in Market Penetration: Similarly, tracking market share growth (the percentage of the total market that a company controls) helps assess a company’s competitive standing and expansion within its industry. A growing market share percentage indicates that the company is outperforming its competitors.
Employee Productivity and Expense Growth
Maintaining efficiency while growing is a delicate balance, and percent growth helps businesses monitor this.
-
Looking at Efficiency: Businesses might analyze the percent growth in revenue per employee or profit per employee to gauge productivity trends. If revenue is growing by 15% but the number of employees by 20%, it might signal a decrease in per-employee productivity unless there are specific strategic reasons.
-
Ensuring Expenses Don’t Outpace Revenue Growth: Monitoring the percent growth of various expense categories (e.g., operating expenses, cost of goods sold) relative to revenue growth is critical. If expenses are growing at a faster percentage rate than revenue, it can erode profit margins and signal potential financial issues or inefficiencies that need addressing.
Advanced Considerations and Common Pitfalls
While the basic formula for percent growth is simple, a deeper understanding requires acknowledging more nuanced aspects and avoiding common misinterpretations.
Compounding Growth (The Power of Time)
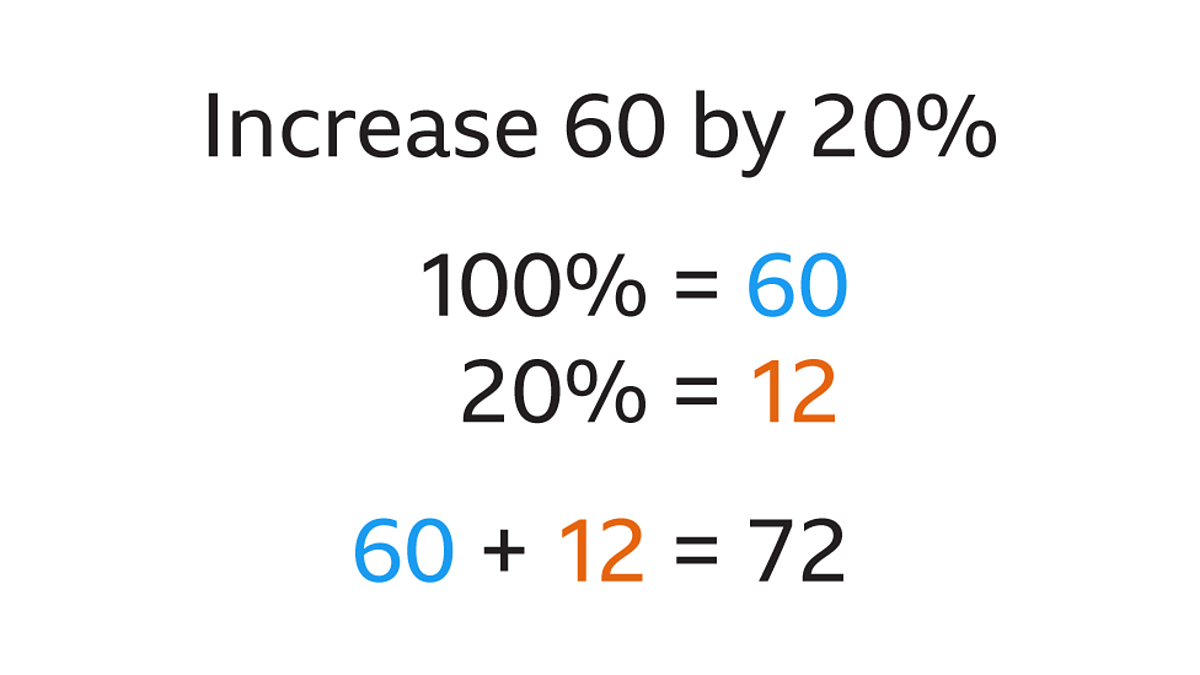
- How Growth Builds on Growth: Compounding is the phenomenon where returns from an investment are reinvested to generate additional returns. When you calculate percent growth for consecutive periods, especially in investing, it’s often the effect of compounding that drives significant long-term wealth creation. For instance, if you earn 10% on $1,000, you have $1,100. If you earn another 10% the next year, it’s on $1,100, not the original $1,000, resulting in $1,210. This “growth on growth” is why consistent percent growth rates over long periods can lead to exponential increases.
The Importance of the Time Period
-
Why Context Matters: A 10% growth rate means very different things depending on the time frame. 10% in a month is phenomenal; 10% in a decade is mediocre. Always specify the period over which the growth is calculated (e.g., 10% monthly growth, 10% annual growth, 10% five-year cumulative growth). This context is crucial for accurate interpretation and comparison.
-
Avoiding Misleading Short-Term Spikes or Dips: Short-term fluctuations can present an overly optimistic or pessimistic picture. Analyzing percent growth over longer, more stable periods often provides a more reliable indicator of underlying trends.

Avoiding Common Misinterpretations
Even with a correct calculation, misinterpreting percent growth can lead to poor decisions.
-
Percentage Points vs. Percentage Change: This is a frequent point of confusion. If a market share goes from 10% to 12%, that’s a 2 percentage point increase. However, the percent growth in market share is (12-10)/10 * 100% = 20%. Be precise in your language.
-
The Base Effect: A small base can lead to seemingly massive percent growth figures that aren’t necessarily sustainable or indicative of large absolute gains. Growing from $100 to $200 is 100% growth, but it’s only a $100 absolute gain. Growing from $1,000,000 to $1,050,000 is 5% growth but a $50,000 absolute gain. Always consider the absolute numbers alongside percentages, especially with very small or very large bases.
-
Ignoring Absolute Numbers for Percentages: While percentages are great for comparison, they don’t always tell the whole story. A company might report 50% profit growth, which sounds impressive. But if their profit went from $1,000 to $1,500, it’s less impactful than a company reporting 10% profit growth from $1,000,000 to $1,100,000. Use both metrics for a complete picture.
Understanding and correctly applying the concept of percent growth is a cornerstone of financial literacy. It allows you to transform raw financial data into meaningful insights, empowering you to make smarter decisions in your personal investments, business ventures, and overall financial planning. By mastering this fundamental calculation, you gain a clearer perspective on performance, identify opportunities, and navigate the complex landscape of money with greater confidence.
aViewFromTheCave is a participant in the Amazon Services LLC Associates Program, an affiliate advertising program designed to provide a means for sites to earn advertising fees by advertising and linking to Amazon.com. Amazon, the Amazon logo, AmazonSupply, and the AmazonSupply logo are trademarks of Amazon.com, Inc. or its affiliates. As an Amazon Associate we earn affiliate commissions from qualifying purchases.