
In the intricate world of finance, few concepts are as ubiquitous and critical as the percentage. From personal budgeting and understanding investment returns to deciphering loan interest rates and analyzing business profit margins, the ability to accurately calculate and interpret percentages is not merely a mathematical skill but a fundamental pillar of financial literacy. Without a firm grasp of percentages, individuals and businesses alike risk making uninformed decisions, misjudging opportunities, and falling victim to financial jargon.
This comprehensive guide aims to demystify the process of calculating percentages, providing clear, actionable methods applicable to a myriad of financial scenarios. We will delve into the core mechanics, explore advanced financial applications, and highlight tools and strategies to ensure you can confidently navigate the numerical landscape of money management. Whether you’re a budding investor, a shrewd entrepreneur, or simply striving for greater control over your personal finances, mastering percentages is an indispensable step towards achieving your financial goals.

The Foundational Role of Percentages in Finance
The language of money is often spoken in percentages. It’s the universal translator for comparing different financial figures, expressing rates of change, and understanding proportions relative to a whole. Before we dive into the ‘how-to,’ it’s crucial to appreciate the ‘why’ – why percentages are not just academic exercises but the bedrock of sound financial decision-making.
Understanding the Basics: What a Percentage Really Means
At its heart, a percentage is simply a way of expressing a number as a fraction of 100. The word “percent” originates from the Latin per centum, meaning “by the hundred.” When we say “25 percent,” we mean 25 out of every 100, or 25/100, which can also be written as the decimal 0.25. This simple concept allows us to standardize comparisons. For instance, knowing that one investment yielded a 10% return and another a 12% return immediately tells us which performed better, regardless of the initial investment amounts. This standardization is what makes percentages so powerful in a financial context, providing a clear, comparable metric across vastly different scales.
Why Financial Literacy Demands Percentage Proficiency
Financial literacy is the ability to understand and effectively use various financial skills, including personal financial management, budgeting, and investing. Central to all these aspects is the ability to work with percentages. How can one understand a credit card’s annual percentage rate (APR) without knowing what a percentage means? How can you compare two savings accounts without comparing their interest rates? How do you budget effectively without allocating percentages of your income to different categories like housing, food, and savings? The answers are clear: you can’t. A strong command of percentages empowers you to decode financial information, critically evaluate financial products, and make informed choices that align with your financial objectives. It transforms complex data into digestible insights, enabling smarter decisions about spending, saving, borrowing, and investing.
Common Financial Scenarios Where Percentages Are King
The application of percentages in finance is virtually endless. Consider these everyday examples:
-
Discounts and Sales: A shirt on sale for “30% off” immediately tells you how much you save.
-
Interest Rates: Whether it’s the interest earned on a savings account or the interest paid on a loan or mortgage, percentages dictate the cost of borrowing and the reward of saving.
-
Taxes: Income tax, sales tax, property tax—all are calculated as percentages of a base amount.
-
Investment Returns: The success or failure of an investment is often measured by its percentage gain or loss.
-
Inflation: The rate at which prices rise, eroding purchasing power, is expressed as a percentage.
-
Budgeting: Allocating specific percentages of income to different expenditure categories helps maintain financial discipline.
Understanding these scenarios underscores the practical, immediate relevance of mastering percentage calculations in your financial life.
Mastering the Core Calculation: Step-by-Step
Calculating the percentage of a number is a fundamental skill that, once mastered, unlocks a multitude of financial applications. There are a few straightforward methods to achieve this, each offering a slightly different approach to the same mathematical principle.
Method 1: The Decimal Conversion Approach
This is often the most direct and widely used method, especially with calculators or spreadsheets.
-
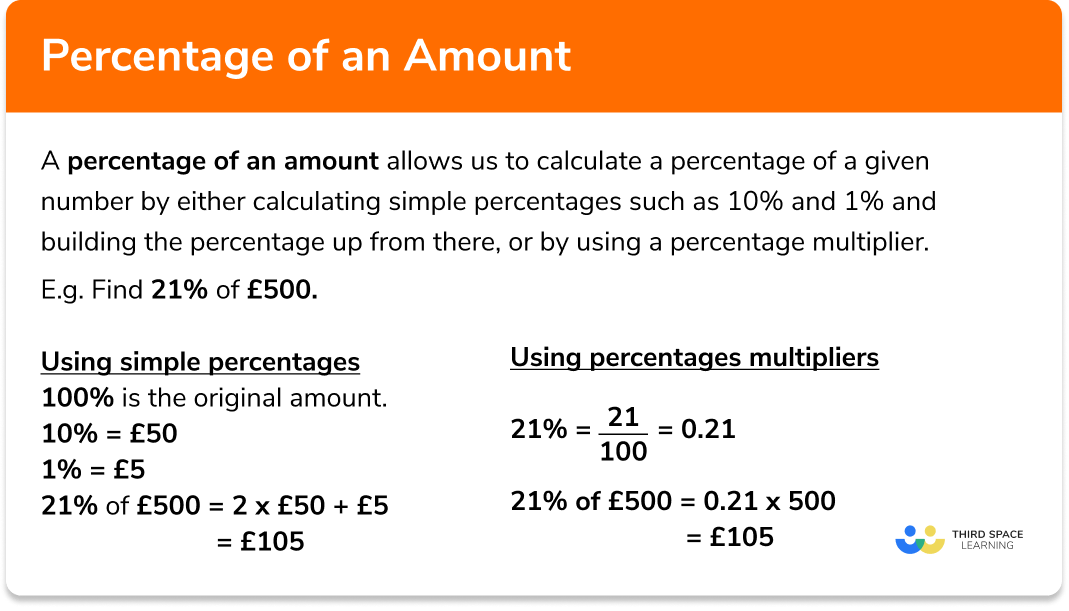
Convert the percentage to a decimal: To do this, simply divide the percentage by 100. For example, 25% becomes 0.25 (25 ÷ 100). If you have 7.5%, it becomes 0.075.
-
Multiply the decimal by the number: Take the decimal value you just calculated and multiply it by the number you want to find the percentage of.
-
Example: What is 20% of $500?
-
Convert 20% to a decimal: 20 ÷ 100 = 0.20
-
Multiply by the number: 0.20 × 500 = $100
-
So, 20% of $500 is $100. This is particularly useful for calculating discounts or a portion of a budget.
-
Method 2: The Fractional Approach (Part/Whole)
Sometimes you know the “part” and the “whole” and want to find what percentage the part represents. This method focuses on the definition of a percentage as “part out of a whole.”
-
Divide the part by the whole: Perform the division to get a decimal.
-
Multiply the result by 100: This converts the decimal back into a percentage.
-
Example: If you spent $75 on groceries from a $500 budget, what percentage of your budget did you spend?
-
Divide the part ($75) by the whole ($500): 75 ÷ 500 = 0.15
-
Multiply by 100: 0.15 × 100 = 15%
-
You spent 15% of your budget on groceries. This approach is invaluable for analyzing spending habits or understanding market share.
-
Calculating Percentage Increase and Decrease
Financial scenarios frequently require calculating how much a number has changed in percentage terms.
-
Percentage Increase:
-
Find the difference (new value – original value).
-
Divide the difference by the original value.
-
Multiply by 100.
-
Example: Your investment grew from $1,000 to $1,200.
-
Difference: 1200 – 1000 = 200
-
Divide by original: 200 ÷ 1000 = 0.20
-
Multiply by 100: 0.20 × 100 = 20% increase.
-
-
-
Percentage Decrease:
-
Find the difference (original value – new value).
-
Divide the difference by the original value.
-
Multiply by 100.
-
Example: The value of an asset dropped from $800 to $600.
-
Difference: 800 – 600 = 200
-
Divide by original: 200 ÷ 800 = 0.25
-
Multiply by 100: 0.25 × 100 = 25% decrease.
-
-
These calculations are crucial for evaluating investment performance, tracking inflation, or analyzing changes in business revenue.
Practical Examples: Interest, Discounts, and Taxes
Let’s put these methods into action with common financial examples:
-
Interest: You have $1,000 in a savings account with an annual interest rate of 2%. How much interest will you earn in a year?
-
2% as a decimal is 0.02.
-
$1,000 × 0.02 = $20. You will earn $20 in interest.
-
-
Discounts: A jacket costs $150 and is on sale for 25% off. What is the discount amount?
-
25% as a decimal is 0.25.
-
$150 × 0.25 = $37.50. The discount is $37.50. The new price is $150 – $37.50 = $112.50.
-
-
Taxes: You buy an item for $80, and the sales tax is 7%. How much is the tax?
-
7% as a decimal is 0.07.
-
$80 × 0.07 = $5.60. The sales tax is $5.60. The total cost is $80 + $5.60 = $85.60.
-
These practical applications demonstrate the immediate utility of percentage calculations in everyday financial transactions.
Advanced Applications of Percentages in Personal Finance
Beyond the basic calculations, percentages form the backbone of more sophisticated personal financial planning and management strategies. Understanding their application in these areas can significantly enhance your financial well-being.
Budgeting and Savings: Allocating Your Income
One of the most effective ways to manage personal finances is through budgeting, often employing the percentage-based 50/30/20 rule. This rule suggests allocating 50% of your after-tax income to needs, 30% to wants, and 20% to savings and debt repayment.
-
Example: If your monthly after-tax income is $4,000:
-
Needs (50%): 0.50 × $4,000 = $2,000
-
Wants (30%): 0.30 × $4,000 = $1,200
-
Savings/Debt (20%): 0.20 × $4,000 = $800
-
This simple percentage allocation provides a clear framework for managing your money, ensuring you prioritize essential spending while still allowing for discretionary expenses and consistent saving for future goals like retirement or a down payment.
Investing: Understanding Returns and Risk
In the investment world, percentages are paramount for evaluating performance and assessing risk.
-
Return on Investment (ROI): This metric expresses the profitability of an investment as a percentage. If you invest $1,000 and it grows to $1,150, your gain is $150. Your ROI is ($150 / $1,000) × 100 = 15%.
-
Compounding Interest: This powerful concept, where interest is earned on both the initial principal and the accumulated interest from previous periods, relies heavily on percentage calculations. A small annual percentage yield (APY) can lead to substantial growth over time due to compounding.
-
Portfolio Allocation: Investors often diversify their portfolios by allocating specific percentages to different asset classes (e.g., 60% stocks, 30% bonds, 10% cash) to manage risk and optimize returns based on their financial goals and risk tolerance.
Understanding these percentage-based metrics is vital for making informed investment decisions and tracking the progress of your wealth-building strategies.
Debt Management: Unpacking Interest Rates
Debt, whether it’s credit card debt, personal loans, or student loans, is intrinsically linked to percentages through interest rates. The Annual Percentage Rate (APR) on a loan or credit card dictates the cost of borrowing.
- Example: A credit card with a 20% APR means that if you carry a balance, you’ll effectively pay 20% of that balance in interest over a year. Calculating the monthly interest charge involves converting the APR to a monthly rate (APR / 12) and then multiplying it by your average daily balance.
Understanding these percentages allows you to compare loan offers, identify high-interest debt that needs to be paid off first, and grasp the true cost of borrowing, preventing you from overpaying in the long run.
Real Estate and Loans: Down Payments and Mortgages
For many, real estate represents the largest financial commitment, and percentages are central to its mechanics.
-
Down Payments: Lenders often require a certain percentage of the home’s purchase price as a down payment (e.g., 20%). If a house costs $300,000, a 20% down payment would be 0.20 × $300,000 = $60,000.
-
Mortgage Interest Rates: The interest rate on your mortgage significantly impacts your monthly payments and the total amount you pay over the loan’s lifetime. Even a fractional percentage difference can translate to thousands of dollars over 30 years.
These percentage calculations are crucial for determining affordability, planning for major purchases, and understanding the long-term financial implications of homeownership.
Percentages in Business and Entrepreneurship
For business owners and financial professionals, percentages are not just useful but indispensable tools for analysis, strategy, and decision-making. They provide a standardized way to measure performance, compare against industry benchmarks, and communicate financial health.
Profit Margins and Markup
One of the most critical applications of percentages in business is in determining profitability.
-
Gross Profit Margin: (Gross Profit / Revenue) × 100. This indicates the percentage of revenue left after deducting the cost of goods sold. A higher percentage suggests more efficient production.
-
Operating Profit Margin: (Operating Income / Revenue) × 100. This shows the percentage of revenue left after deducting operating expenses.
-
Net Profit Margin: (Net Income / Revenue) × 100. This is the ultimate measure of profitability, indicating the percentage of revenue that becomes profit for the owners after all expenses, including taxes and interest, are paid.
-
Markup: The percentage added to the cost of a product to determine its selling price. If an item costs $10 to produce and sells for $15, the markup is ($5 / $10) × 100 = 50%.
These margins are vital for pricing strategies, cost control, and evaluating the overall financial efficiency of a business.
Sales Growth and Market Share
Businesses continuously track their growth and market position using percentages.
-
Sales Growth Rate: ( (Current Period Sales – Prior Period Sales) / Prior Period Sales ) × 100. This percentage reveals how much a company’s sales have increased or decreased over a specific period, a key indicator of business expansion or contraction.
-
Market Share: (Company’s Sales / Total Market Sales) × 100. This percentage indicates a company’s proportion of the total sales within its industry, a crucial metric for competitive analysis and strategic planning.
These percentage metrics help businesses understand their performance within the competitive landscape and guide strategic decisions regarding expansion, product development, and marketing efforts.
Cost Analysis and Expense Ratios
Controlling costs is paramount for profitability. Percentages provide a clear framework for this analysis.
-
Expense Ratios: Businesses often express various expenses as a percentage of revenue (e.g., marketing expenses as 5% of revenue, administrative expenses as 10% of revenue). This allows management to quickly identify areas where costs might be disproportionately high and benchmark against industry averages.
-
Break-even Analysis: While not strictly a percentage calculation itself, the break-even point is often determined by understanding fixed costs, variable costs, and sales prices, all of which are managed to achieve a desired profit margin—a percentage goal.
Analyzing costs through a percentage lens facilitates more effective budgeting, cost-cutting initiatives, and strategic resource allocation.
Financial Reporting and Performance Metrics
Publicly traded companies and even small businesses rely on financial statements to communicate their performance, where percentages are extensively used.
-
Return on Equity (ROE) and Return on Assets (ROA): These are key profitability ratios expressed as percentages, showing how efficiently a company is using shareholders’ equity or its assets to generate profit.
-
Debt-to-Equity Ratio: While not a percentage directly, this ratio compares a company’s total liabilities to its shareholders’ equity, and interpreting it often involves understanding what percentage of funding comes from debt versus equity.
-
Current Ratio, Quick Ratio: While these are expressed as raw numbers, they are derived from balances and often interpreted in terms of percentages relative to industry standards or prior periods to assess liquidity and solvency.
Financial analysts, investors, and stakeholders heavily rely on these percentage-based metrics to gauge a company’s financial health, operational efficiency, and investment attractiveness.
Leveraging Tools and Avoiding Common Pitfalls
While the underlying math for percentages is straightforward, modern financial management often benefits from specialized tools. Equally important is understanding nuances and avoiding common misinterpretations that can lead to costly errors.
The Power of Spreadsheets and Financial Calculators
For repetitive or complex percentage calculations, manual computation can be time-consuming and error-prone.
-
Spreadsheets (e.g., Microsoft Excel, Google Sheets): These are invaluable. You can set up formulas that automatically calculate percentages for budgeting, investment tracking, sales analysis, and more. For instance, to find 20% of a number in cell A1, you’d type
=A1*0.20or=A1*20%. To find the percentage of A1 out of B1, you’d type=A1/B1. Spreadsheets allow for dynamic models, where changing one input automatically updates all dependent percentage calculations, streamlining financial analysis. -
Financial Calculators: Dedicated financial calculators (e.g., HP 12c, Texas Instruments BA II Plus) are programmed with functions for percentages, interest, present/future value, and more, making complex financial calculations quicker and more accurate.
-
Online Calculators and Apps: Numerous online tools and mobile apps are available for quick percentage calculations, particularly for tasks like tip calculation, sales tax, or loan interest estimations.
Embracing these tools not only saves time but significantly reduces the likelihood of calculation errors, allowing you to focus on the interpretation and application of the results.
Common Misinterpretations and How to Avoid Them
Even with correct calculations, misinterpreting percentages can lead to flawed financial decisions.
-
Confusion between “Percentage Of” and “Percentage Point”: A common error is mixing up a percentage change with a percentage point change. If an interest rate increases from 5% to 6%, it’s a 1 percentage point increase. However, it’s a ( (6-5)/5 ) * 100 = 20% percentage increase relative to the original rate. Failing to distinguish between these two can lead to vastly different conclusions, especially in investment performance or economic reporting.
-
Base Value Errors: Always be clear about what the percentage is “of.” For example, if a company’s profit increases by 10% of last year’s sales, that’s very different from 10% of last year’s profit. Ensuring the correct base value is used in your calculations is crucial for accuracy.
-
Cumulative Percentages: When calculating multiple percentage changes over time, it’s often incorrect to simply add or subtract them. For example, a 10% increase followed by a 10% decrease does not result in a net 0% change; it results in a slight decrease. (e.g., $100 + 10% = $110; $110 – 10% = $99). Each percentage change should be applied to the new resulting value.
Being mindful of these subtleties ensures that your interpretation of percentage data is as robust as your calculations.
The Nuance of Percentage Points vs. Percentage Change
Reiterating the importance of this distinction:
-
Percentage Points: Refers to the absolute difference between two percentages. If inflation moves from 2% to 3%, that’s a 1 percentage point increase.
-
Percentage Change: Refers to the relative change between two values, expressed as a percentage of the initial value. In the above example, a move from 2% to 3% is a ( (3-2)/2 ) * 100 = 50% increase in the inflation rate itself.
This difference is particularly critical in financial news, economic analysis, and when evaluating the impact of policy changes or market shifts. Misunderstanding this can lead to overstating or understating the magnitude of a financial event.

Conclusion
The ability to figure out the percentage of a number is far more than a basic arithmetic skill; it is a vital tool in the arsenal of anyone navigating the financial landscape. From personal budgets and investment portfolios to corporate finance and market analysis, percentages provide the universal language for understanding value, change, and proportion.
By mastering the core calculation methods—whether converting to decimals or understanding parts of a whole—and applying them to real-world financial scenarios, you empower yourself to make more informed and strategic decisions. Leveraging spreadsheets and financial calculators can enhance efficiency and accuracy, while a keen awareness of common pitfalls like confusing percentage points with percentage change will safeguard against misinterpretations.
In a world where financial information is constantly presented in percentage terms, developing a strong command of this concept is not just advantageous—it’s essential for achieving financial literacy, securing your economic future, and confidently engaging with the complex world of money. Embrace the power of percentages, and unlock a clearer, more insightful path to financial success.
aViewFromTheCave is a participant in the Amazon Services LLC Associates Program, an affiliate advertising program designed to provide a means for sites to earn advertising fees by advertising and linking to Amazon.com. Amazon, the Amazon logo, AmazonSupply, and the AmazonSupply logo are trademarks of Amazon.com, Inc. or its affiliates. As an Amazon Associate we earn affiliate commissions from qualifying purchases.