
In the world of finance, numbers are the primary medium of communication, but the most important unit of measure is not the dollar—it is the percentage. Whether you are tracking the growth of a retirement portfolio, calculating the interest on a mortgage, or evaluating the profit margins of a small business, understanding how to calculate and interpret percentages is the fundamental skill that separates those who struggle with money from those who build lasting wealth. To “do the percentage” is to look past the raw figures and see the relative health, risk, and potential of any financial decision.

Mastering percentages allows an individual to move from a reactive state of financial management to a proactive strategy. It provides a universal scale to compare disparate opportunities, such as a high-yield savings account versus a dividend-paying stock, or a credit card balance versus a car loan. By focusing on percentages, you gain the clarity necessary to optimize your cash flow and accelerate your journey toward financial independence.
The Fundamental Mathematics of Wealth Management
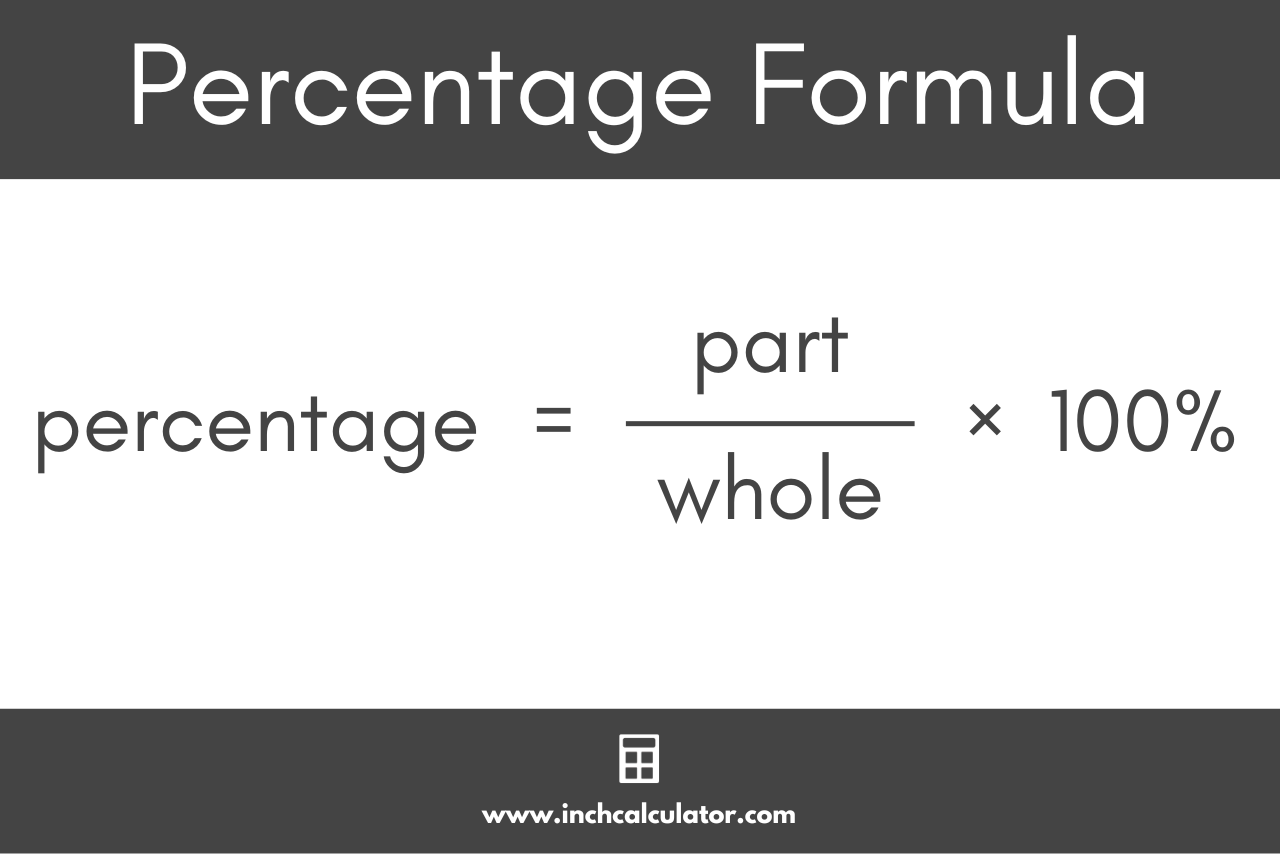
At its core, a percentage is a way of expressing a number as a fraction of 100. In personal finance, this is rarely about static numbers; it is almost always about change, proportion, and rates of return. Understanding the basic mechanics of these calculations is the first step toward financial literacy.
Calculating Percentage Change: Growth and Loss
One of the most frequent calculations a savvy investor performs is percentage change. This is the formula used to determine how much an investment has grown or shrunk over a period. The formula is straightforward: [(New Value – Old Value) / Old Value] x 100.
For example, if you purchased a share of stock for $150 and it is now worth $180, your percentage gain is 20%. While the $30 profit is the nominal gain, the 20% figure is what tells you how efficiently your capital is working. Comparing this to a different asset that gained $30 but cost $300 (a 10% gain) reveals that the first investment was twice as effective.
The Asymmetry of Losses
A critical concept in financial math is the “asymmetry of percentage loss.” If an investment drops by 50%, it does not require a 50% gain to get back to even; it requires a 100% gain. If your portfolio falls from $10,000 to $5,000, a 50% increase on that remaining $5,000 only brings you to $7,500. Understanding this mathematical reality highlights the importance of risk management and capital preservation. Protecting against large percentage drawdowns is often more important for long-term wealth than chasing high percentage gains.
Simple vs. Compound Interest
When calculating the cost of debt or the growth of savings, one must distinguish between simple and compound interest. Simple interest is calculated only on the principal amount, whereas compound interest is calculated on the principal plus any accumulated interest. Over long horizons, the percentage rate of compounding is the most powerful force in finance. The “Rule of 72” is a quick mental percentage shortcut used by investors: divide 72 by your annual interest rate to find out approximately how many years it will take for your money to double. At a 7% return, your money doubles every 10.2 years.
Strategic Budgeting and Asset Allocation
Beyond simple arithmetic, “doing the percentage” involves applying these ratios to your overall financial structure. Successful wealth builders do not think in terms of how many dollars they spend, but what percentage of their income goes toward specific categories.
The 50/30/20 Rule
One of the most effective ways to manage personal finance is through percentage-based budgeting. The 50/30/20 rule suggests that 50% of your after-tax income should go toward “Needs” (housing, utilities, groceries), 30% toward “Wants” (entertainment, dining out, hobbies), and 20% toward “Financial Goals” (debt repayment, savings, investments).
This approach is superior to fixed-dollar budgeting because it scales with your income. If you receive a raise, your lifestyle doesn’t automatically inflate to consume the entire increase; instead, the percentages ensure that your savings and investment contributions grow in tandem with your earnings.
Portfolio Allocation and Rebalancing
In investing, your asset allocation—the percentage of your portfolio dedicated to stocks, bonds, real estate, and cash—is the primary driver of your risk and return. A classic moderate portfolio might be 60% equities and 40% fixed income.

The “percentage” work here involves periodic rebalancing. If the stock market has a stellar year, your equities might grow to represent 70% of your total wealth. To maintain your original risk profile, you must sell the excess 10% and redistribute it into the underperforming categories. By focusing on the target percentage rather than the emotional highs of the market, you are mathematically forced to “buy low and sell high.”
The Savings Rate as a Success Metric
Many people focus on their net worth or their salary, but the most predictive percentage for financial independence is the “savings rate.” This is the percentage of your take-home pay that you divert into assets. A person earning $200,000 who saves 10% ($20,000) is arguably in a weaker financial position than someone earning $70,000 who saves 40% ($28,000). The latter has a lower “burn rate” and is building wealth faster relative to their needs.
Business Finance and Investment Analysis
For those looking to generate online income, run a side hustle, or invest in individual companies, percentage-based analysis is the standard for evaluating performance. Raw revenue is a vanity metric; percentages reveal the underlying truth of a business’s health.
Understanding Profit Margins
A business that generates $1 million in revenue but has a 2% net profit margin is often more fragile than a business generating $200,000 with a 40% margin.
-
Gross Margin: This percentage reveals how much it costs to produce your product. [(Revenue – Cost of Goods Sold) / Revenue].
-
Operating Margin: This shows how much profit is left after paying for the day-to-day operations of the business.
-
Net Profit Margin: The “bottom line” percentage. This is what is left for the owners after all expenses, interest, and taxes are paid. Monitoring these percentages over time allows a business owner to identify inefficiencies before they become catastrophic.
Return on Investment (ROI) and Yield
When allocating capital, investors use ROI to compare the efficiency of different expenditures. If you spend $1,000 on an advertising campaign that generates $1,500 in profit, your ROI is 50%.
In the stock market, “yield” is a specific type of percentage. The dividend yield is the annual dividend payment divided by the stock price. If a stock costs $100 and pays $4 in dividends per year, its yield is 4%. This allows an investor to compare the income-generating potential of a stock to the interest rate of a government bond or a savings account.
The Payout Ratio
For dividend investors, the payout ratio is a critical percentage. It is the proportion of a company’s earnings paid out as dividends. A payout ratio of 30% suggests the company is retaining 70% of its earnings to fuel future growth, making the dividend very safe. A payout ratio of 95% or higher may indicate that the dividend is unsustainable, as there is no margin for error if earnings drop.
Managing Liability: The Impact of Percentages on Debt
While percentages can work for you in the form of investment returns, they can work against you in the form of interest rates on debt. Mastering the “percentage” of your liabilities is essential for maintaining a healthy financial life.
APR vs. APY
When looking at credit cards or loans, the Annual Percentage Rate (APR) is the standard measure. However, it is vital to understand the Annual Percentage Yield (APY), which accounts for compounding. Because credit card interest usually compounds daily, an APR of 19.99% actually results in an APY that is higher. Understanding this distinction helps borrowers realize the true cost of carrying a balance and why high-percentage debt is a “wealth killer.”
Debt-to-Income Ratio (DTI)
Lenders use the debt-to-income ratio to determine your creditworthiness. This is the percentage of your gross monthly income that goes toward paying debts. Generally, a DTI of 36% or less is considered healthy for mortgage approval. If your DTI climbs toward 50%, you are considered “house poor” or over-leveraged, meaning a small percentage change in your income or expenses could lead to financial insolvency.
The Real Return: Adjusting for Inflation
Finally, one must always calculate the “real” percentage return by subtracting the inflation rate. If your savings account offers a 4% interest rate but inflation is running at 5%, your “real” return is -1%. In this scenario, while your balance is increasing in nominal dollars, your actual purchasing power is shrinking. Successful financial planning always accounts for the inflation percentage to ensure that wealth is truly being preserved and grown in real terms.
By shifting your perspective to focus on percentages rather than just absolute numbers, you gain a sophisticated toolkit for financial decision-making. Whether you are optimizing a budget, evaluating an investment, or managing debt, the math of percentages provides the clarity and objectivity required to achieve long-term financial success.
aViewFromTheCave is a participant in the Amazon Services LLC Associates Program, an affiliate advertising program designed to provide a means for sites to earn advertising fees by advertising and linking to Amazon.com. Amazon, the Amazon logo, AmazonSupply, and the AmazonSupply logo are trademarks of Amazon.com, Inc. or its affiliates. As an Amazon Associate we earn affiliate commissions from qualifying purchases.