
In the dynamic world of finance, raw numbers tell only half the story. To truly understand growth, progress, or decline, we must delve into percentages. The percentage of increase is a fundamental metric that empowers individuals and businesses to quantify positive changes, providing critical context that absolute figures often lack. Whether you’re tracking the growth of your investment portfolio, analyzing a company’s revenue surge, or assessing your own salary progression, mastering this simple yet powerful calculation is indispensable. It translates complex financial data into digestible, comparable insights, enabling more informed decision-making and strategic planning.
The Fundamental Importance of Percentage Increase in Finance
At its core, the ability to calculate a percentage increase is not just a mathematical exercise; it’s a cornerstone of financial literacy. It allows us to move beyond superficial observations of larger numbers and grasp the true magnitude of change relative to an initial state.
Understanding Growth Beyond Raw Numbers
Imagine an investment that grew from $10,000 to $12,000, and another that grew from $100 to $300. In absolute terms, the first investment saw a $2,000 increase, while the second saw a $200 increase. If we stopped there, we might think the first investment performed better. However, when we consider percentage increase, the picture changes dramatically:
-
Investment 1: ($12,000 – $10,000) / $10,000 = $2,000 / $10,000 = 0.20 or 20% increase.
-
Investment 2: ($300 – $100) / $100 = $200 / $100 = 2.00 or 200% increase.
This comparison reveals that the second investment, despite a smaller absolute gain, experienced exponentially higher growth relative to its starting point. This context is vital for understanding performance and making valid comparisons.
Making Informed Financial Decisions
For individuals, understanding percentage increases helps in evaluating job offers (comparing salary increases over time), assessing the real impact of inflation on purchasing power, or deciding between different savings accounts with varying interest rates. For businesses, it’s crucial for everything from setting sales targets and evaluating marketing campaign effectiveness to making capital allocation decisions and projecting future financial health. Without this metric, decisions would be based on incomplete or misleading information.
Benchmarking and Performance Evaluation
Percentage increase is the universal language for benchmarking. It allows investors to compare the performance of their portfolio against market indices (like the S&P 500) or other investment vehicles. Businesses use it to compare their growth against competitors, industry averages, or their own historical performance. This provides a standardized way to measure success and identify areas for improvement or strategic pivots, ensuring that evaluations are fair and consistent, regardless of the differing scales of various financial entities.
The Core Formula: Demystifying the Calculation
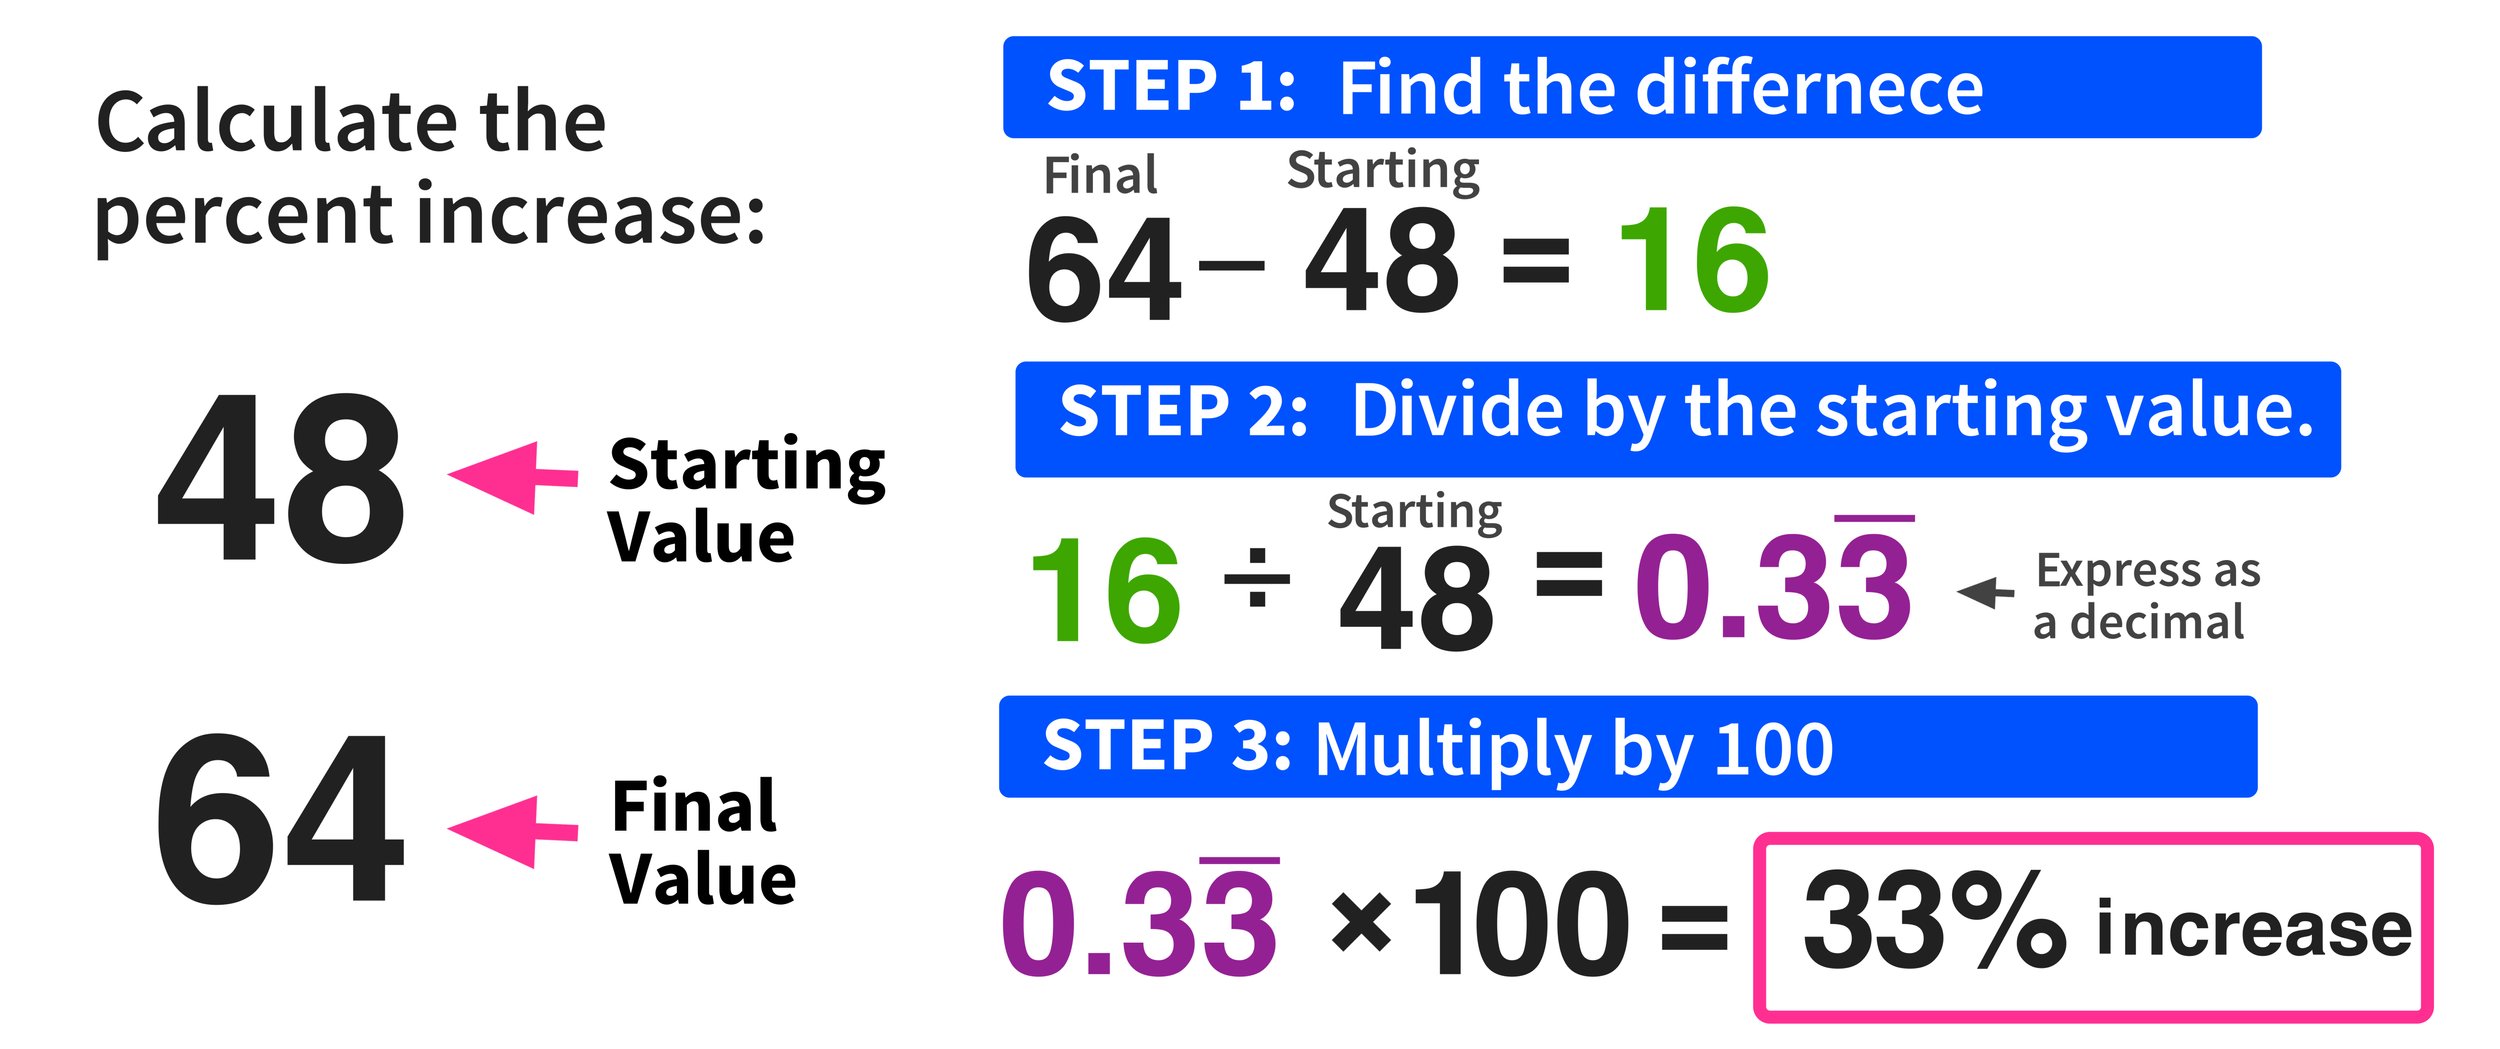
Calculating the percentage of increase is straightforward once you understand the formula and the components involved. It’s a two-step process that compares the magnitude of change to the original value.
Step-by-Step Breakdown: Initial Value vs. Final Value
The formula for percentage increase is:
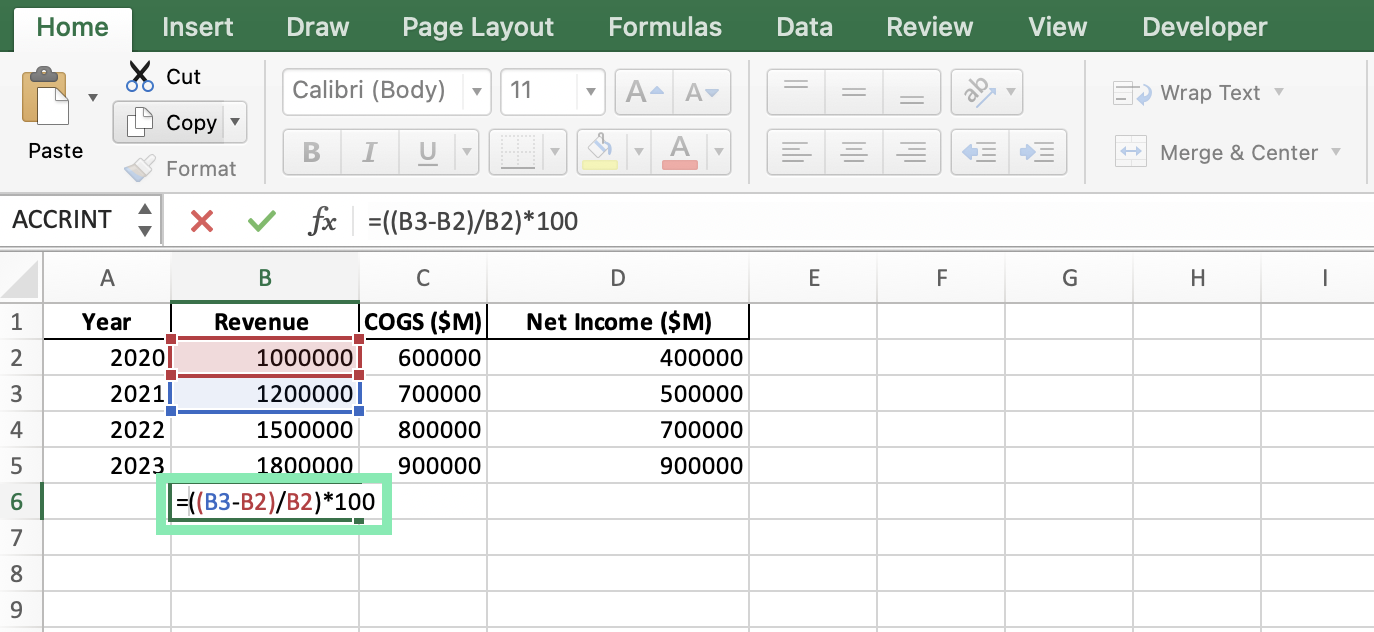
Percentage Increase = ((Final Value – Initial Value) / Initial Value) * 100
Let’s break down each part:
-
Final Value (or New Value): This is the larger number, representing the amount after the increase.
-
Initial Value (or Old Value): This is the smaller number, representing the amount before the increase.
-
Subtract Initial Value from Final Value: This step calculates the absolute change or the actual amount of the increase.
-
Divide by Initial Value: This step normalizes the absolute change, expressing it as a decimal relative to the starting point.
-
Multiply by 100: This converts the decimal into a percentage, making it easier to read and interpret.
Example 1: Personal Savings Growth
Suppose you started the year with $5,000 in your savings account (Initial Value) and, through regular contributions and interest, ended the year with $5,750 (Final Value).
-
Subtract: $5,750 (Final) – $5,000 (Initial) = $750 (Absolute Increase)
-
Divide: $750 / $5,000 = 0.15
-
Multiply: 0.15 * 100 = 15%
Your savings account experienced a 15% increase over the year. This figure is more informative than just knowing you gained $750, as it indicates the rate of growth relative to your initial capital.
Example 2: Stock Portfolio Appreciation
Let’s say you invested $20,000 in a particular stock (Initial Value). Over six months, the stock’s value grew, and your investment is now worth $24,500 (Final Value).
-
Subtract: $24,500 (Final) – $20,000 (Initial) = $4,500 (Absolute Increase)
-
Divide: $4,500 / $20,000 = 0.225
-
Multiply: 0.225 * 100 = 22.5%
Your stock portfolio appreciated by 22.5% during that period. This percentage allows you to quickly compare the performance of this stock to others in your portfolio or to broader market benchmarks, giving you an immediate sense of its investment efficacy.
Practical Applications in Personal Finance
For individuals, understanding percentage increase is paramount for effective personal financial management. It illuminates critical aspects of our financial lives, from wealth accumulation to debt management.
Tracking Investment Returns (Stocks, Bonds, Real Estate)
Every investor needs to know how their assets are performing. Whether it’s a stock that soared from $50 to $75, a bond that yielded a certain amount, or a piece of real estate that appreciated in value, the percentage increase provides the true measure of return on investment (ROI). For instance, if you bought a house for $300,000 and it’s now valued at $390,000, your percentage increase is ( ($390,000 – $300,000) / $300,000 ) * 100 = 30%. This allows for clear comparisons across different investment types, helping you to rebalance your portfolio or make future investment decisions.
Analyzing Salary Increases and Cost of Living Adjustments
When you receive a pay raise, understanding the percentage increase allows you to assess its real impact. A $2,000 raise on a $40,000 salary is a 5% increase, while the same $2,000 raise on an $80,000 salary is only a 2.5% increase. This helps contextualize the raise relative to your overall income. Similarly, tracking the percentage increase in your cost of living (e.g., groceries, utilities, housing) is essential. If your salary increases by 3% but your living costs increase by 5%, your purchasing power has actually decreased, despite a numerical pay raise.
Monitoring Debt Reduction Progress
While the primary focus is often on increasing values, percentage calculations are also useful for understanding progress in reducing liabilities. For example, if you start with $10,000 in credit card debt and pay off $2,000, you’ve reduced your debt by 20% ( ($10,000 – $8,000) / $10,000 ) * 100 = 20%. This perspective can be a powerful motivator, showing tangible progress towards financial freedom.
Evaluating Inflation’s Impact on Purchasing Power
Inflation, the rate at which the general level of prices for goods and services is rising, directly erodes purchasing power. By comparing the percentage increase in consumer prices (as reported by economic indicators) against the percentage increase in your income or investment returns, you can gauge whether you’re staying ahead, keeping pace, or falling behind. If inflation rises by 4% in a year, and your investments only yield 3%, your real return is negative, meaning your money buys less than it did before.
Strategic Use in Business Finance and Investing
In the corporate world and for serious investors, the percentage of increase is a critical tool for strategic analysis, performance measurement, and investor communication.
Measuring Revenue and Profit Growth
Businesses live and die by their growth metrics. Tracking the percentage increase in revenue year-over-year (YOY) or quarter-over-quarter (QOQ) provides a clear picture of market penetration and sales effectiveness. Similarly, analyzing profit margin increases helps assess operational efficiency and cost control. A company reporting a 15% increase in revenue and a 20% increase in profit margin suggests strong growth coupled with improved efficiency, signaling robust financial health to investors.
Assessing Market Share Expansion
Companies constantly vie for a larger slice of the market. By calculating the percentage increase in their market share over time, businesses can measure the effectiveness of their competitive strategies, product launches, or marketing campaigns. If a company’s market share grew from 10% to 12%, this 2% absolute increase represents a ( (12 – 10) / 10 ) * 100 = 20% increase in market share, indicating significant competitive gains.
Evaluating ROI (Return on Investment) for Projects and Campaigns
Before committing capital to new projects, marketing campaigns, or product development, businesses perform ROI analysis. The percentage increase is integral here: ( (Gain from Investment – Cost of Investment) / Cost of Investment ) * 100. For instance, if a marketing campaign cost $10,000 and generated an additional $15,000 in profit, the ROI is ( ($15,000 – $10,000) / $10,000 ) * 100 = 50%. This metric helps prioritize initiatives that yield the highest returns.
Understanding Economic Indicators and Market Trends
Economists, analysts, and investors closely monitor a range of economic indicators that are often expressed as percentage increases: GDP growth, consumer price index (CPI) changes, unemployment rate shifts, and industry-specific growth rates. These percentages help in forecasting market trends, understanding economic health, and making macroeconomic investment decisions. For example, a consistent percentage increase in GDP indicates a growing economy, which typically bodes well for corporate earnings and stock market performance.
Common Pitfalls and Advanced Considerations
While the basic calculation is straightforward, certain nuances and advanced considerations can refine your understanding and prevent misinterpretations in financial contexts.
The Impact of Negative Starting Values or Zero Values
The standard percentage increase formula assumes a positive initial value. If the initial value is zero, the division by zero would render the calculation undefined. If the initial value is negative, the interpretation becomes complex and can lead to misleading results, as a negative starting point means the concept of “increase relative to initial value” fundamentally changes. In such cases, alternative metrics like absolute change or specific financial ratios are more appropriate. For example, a business moving from a -$10,000 loss to a $5,000 profit is a significant positive change, but a simple percentage increase calculation would be problematic.
Differentiating Simple vs. Compound Growth
The percentage increase calculation generally refers to simple growth over a single period. However, in finance, especially with investments, compound growth is often more relevant. Compound growth refers to growth on growth, where earnings from initial investments are reinvested, generating further earnings. While the percentage increase calculates the direct change, understanding the long-term impact of compounding requires considering multiple periods or using specific compound annual growth rate (CAGR) formulas. For example, a 10% annual increase over 10 years doesn’t mean a simple 100% increase; it means a significantly higher compounded return.
Annualized Percentage Increase for Long-Term Data
When analyzing data over multiple periods (e.g., an investment that grew over five years), a simple overall percentage increase might not tell the whole story. An annualized percentage increase (often referred to as Compound Annual Growth Rate or CAGR) normalizes the growth to a yearly figure, making it easier to compare investments or performance periods of different durations. The formula for CAGR is:
CAGR = ((Final Value / Initial Value)^(1 / Number of Years)) – 1
This provides a more accurate representation of the average annual growth rate, smoothing out volatility and offering a clearer picture of long-term performance.
Contextualizing Percentage Increases: Relative vs. Absolute
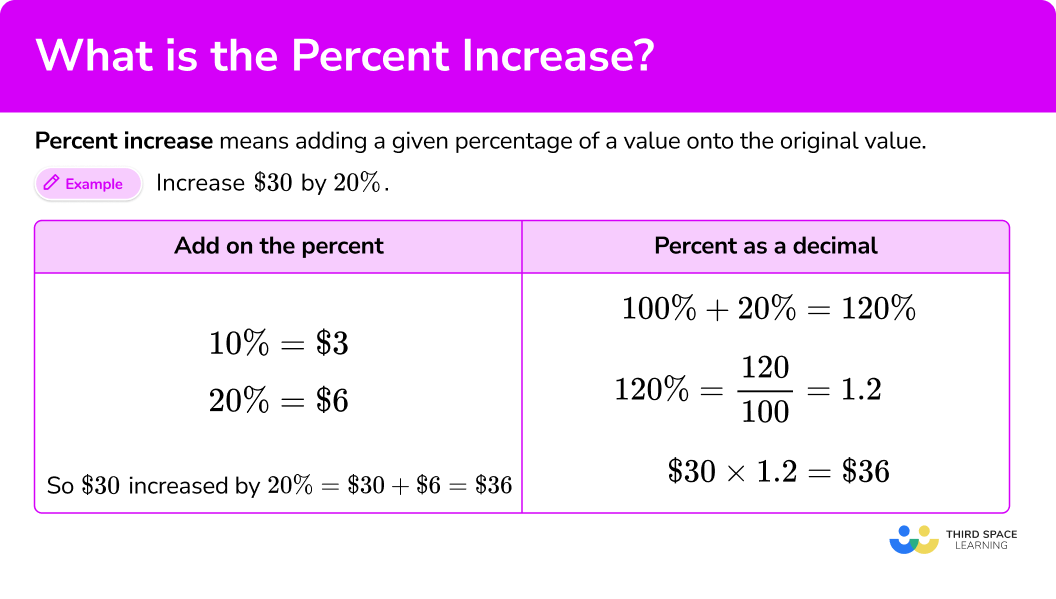
Always consider percentage increases within their appropriate context. A 100% increase on a $10 investment means a gain of $10, which is very different from a 10% increase on a $1,000,000 investment, which means a gain of $100,000. While percentages allow for relative comparison, the absolute numbers are still crucial for understanding the real-world impact and scale of the change. A “large” percentage increase on a “small” base might be less significant than a “modest” percentage increase on a “large” base.
In conclusion, the ability to accurately calculate the percentage of increase between two numbers is a foundational skill in the realm of money and finance. From managing personal budgets and assessing investment performance to driving business strategy and interpreting economic trends, this calculation provides the clarity and context needed for sound financial decisions. By understanding its formula, practical applications, and nuanced considerations, you empower yourself with a vital tool for navigating the complexities of the financial world, making growth understandable, measurable, and actionable.
aViewFromTheCave is a participant in the Amazon Services LLC Associates Program, an affiliate advertising program designed to provide a means for sites to earn advertising fees by advertising and linking to Amazon.com. Amazon, the Amazon logo, AmazonSupply, and the AmazonSupply logo are trademarks of Amazon.com, Inc. or its affiliates. As an Amazon Associate we earn affiliate commissions from qualifying purchases.