
In the intricate world of finance, where values constantly fluctuate, understanding change is paramount. Whether you’re tracking your investments, managing a personal budget, or analyzing market trends, the ability to accurately calculate and interpret price change percentages is a fundamental skill. It transforms raw numbers into actionable insights, revealing growth, decline, and overall performance. This guide will demystify the process, offering a comprehensive look at how to calculate price change percentage, why it matters, and how to apply it across various financial scenarios.
Understanding the Fundamentals: What is Price Change Percentage?
At its core, a price change percentage quantifies the relative shift in an asset’s value from one period to another. Unlike an absolute change, which simply tells you the dollar amount difference, the percentage provides context, indicating the magnitude of the change relative to the original price. This relative measure is incredibly powerful because it allows for direct comparison of changes across different items, regardless of their original price points.
Defining Price Change
A “price change” refers to any alteration in the monetary value of a good, service, or asset over a specified period. This could be the price of a stock from yesterday to today, the cost of a gallon of milk from last year to this year, or the value of a property over a decade. It’s the numerical difference between a new price and an old, or original, price.
Why Price Change Percentage Matters in Finance
The percentage change offers a standardized way to evaluate performance and volatility. For instance, a $10 increase on a $100 stock is a 10% gain, which feels significant. A $10 increase on a $1,000 stock, however, is only a 1% gain, which is far less impactful. Without converting to a percentage, these two absolute changes appear identical, leading to potentially misleading conclusions. It enables:
-
Comparative Analysis: Easily compare the performance of different investments, products, or economic indicators.
-
Contextual Understanding: Gauge the true impact of a price movement relative to its initial value.
-
Trend Identification: Spot patterns of growth or decline over time.
-
Decision Making: Inform investment choices, budgeting strategies, and business pricing.
Key Components: Old Price vs. New Price
To calculate a price change percentage, you primarily need two pieces of information:
-
Old Price (Original Price / Base Price): This is the starting value of the item before the change occurred. It serves as the reference point against which the change is measured. Selecting the correct “old price” is crucial for an accurate calculation.
-
New Price (Current Price / Final Price): This is the value of the item after the change has taken place.
The relationship between these two components forms the basis of the calculation.
The Core Calculation: Step-by-Step Methodology
The formula for calculating price change percentage is straightforward and universally applicable. Once you grasp its logic, you can apply it to virtually any financial scenario requiring performance analysis.
The Universal Formula Explained
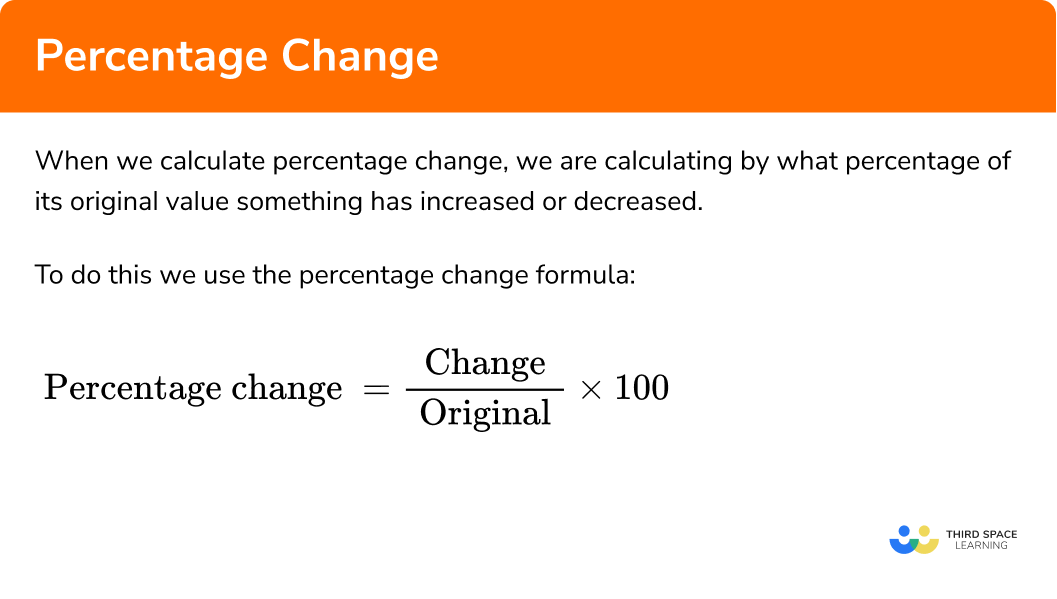
The standard formula for price change percentage is:
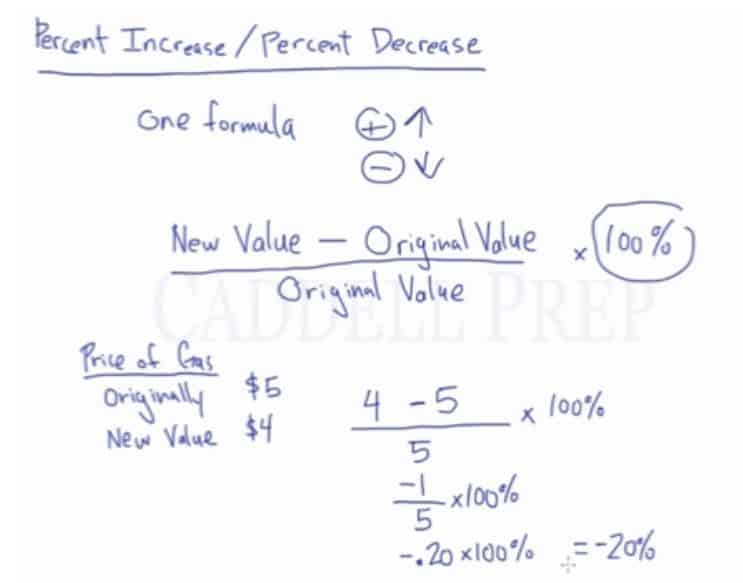
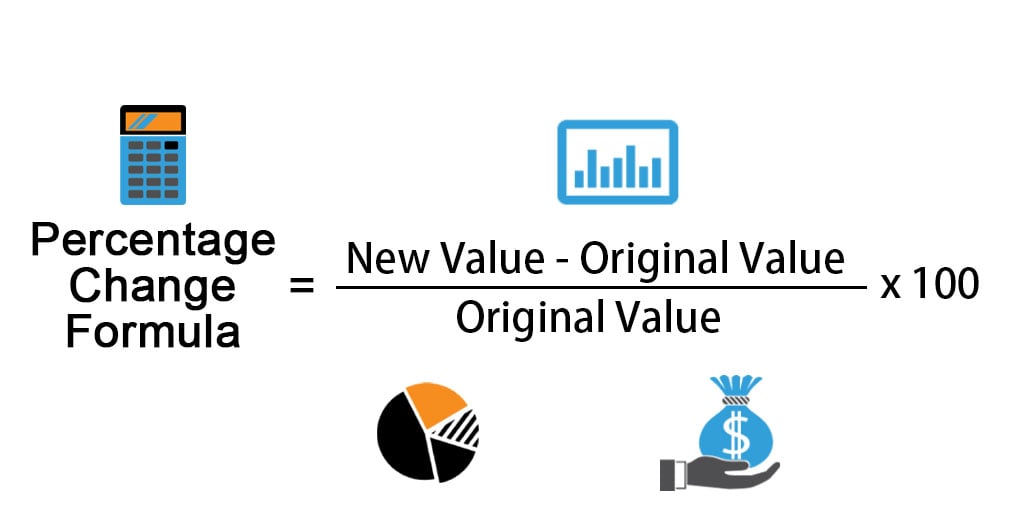
Price Change Percentage = ((New Price – Old Price) / Old Price) * 100%
Let’s break down each part:
-
Difference (New Price – Old Price): This first step calculates the absolute monetary change. A positive result indicates an increase, while a negative result signifies a decrease.
-
Relative Change (Difference / Old Price): Dividing the absolute change by the old price converts the monetary difference into a decimal representing the proportional change. This is the “relative change.”
-
Percentage Conversion (* 100%): Multiplying the relative change by 100 converts the decimal into a percentage, making it easier to read and interpret.
Calculating for Increases (Positive Change)
When the new price is higher than the old price, you’ll observe a positive percentage change, indicating growth or appreciation.
Example: Stock Appreciation
Imagine you bought shares of XYZ Corp. for $50 per share (Old Price). A year later, the shares are trading at $65 per share (New Price).
-
Difference: $65 – $50 = $15
-
Relative Change: $15 / $50 = 0.30
-
Percentage Change: 0.30 * 100% = 30% increase
This tells you your investment has appreciated by 30%.
Calculating for Decreases (Negative Change)
Conversely, if the new price is lower than the old price, the calculation will yield a negative percentage change, indicating a decline, depreciation, or discount.
Example: Discounted Products or Asset Depreciation
A new smartphone initially sold for $1,000 (Old Price). During a sale, its price drops to $750 (New Price).
-
Difference: $750 – $1,000 = -$250
-
Relative Change: -$250 / $1,000 = -0.25
-
Percentage Change: -0.25 * 100% = -25% decrease
The smartphone’s price has been reduced by 25%. Similarly, if your initial investment drops in value, you’d see a negative percentage reflecting the loss.
Common Pitfalls and How to Avoid Them
The most frequent error in calculating price change percentage is using the wrong base price. Always divide by the original or old price.
-
Incorrect Base: Sometimes, people mistakenly divide by the new price. For example, if a price goes from $100 to $120, the increase is $20. Dividing by the old price ($100) gives a 20% increase. Dividing by the new price ($120) would give 16.67%, which is incorrect for expressing the increase from the original point.
-
Confusing “Up To” vs. “By”: Be clear whether a price changed by a certain percentage or to a new percentage of the original.
Practical Applications Across the Financial Landscape
The utility of price change percentage extends across virtually every facet of finance, providing critical insights for individuals, investors, and businesses alike.
Personal Finance: Budgeting, Inflation, and Consumer Spending
For personal financial management, understanding price changes is crucial for effective budgeting and smart spending.
-
Tracking Household Expenses: You can track the percentage increase in your utility bills, groceries, or transportation costs over time to adjust your budget proactively. If your grocery bill jumped 15% in a year, you know to factor that into your future spending.
-
Understanding Inflation: The Consumer Price Index (CPI) is fundamentally a measure of the average price change of a basket of consumer goods and services. Monitoring inflation rates (a specific application of price change percentage) helps you understand the erosion of your purchasing power and whether your income is keeping pace.
-
Analyzing Discounts: When shopping, calculating the percentage discount quickly helps you assess the true value of a sale item. A “save $50” deal sounds good, but if the original price was $1000, it’s only a 5% discount, whereas if it was $100, it’s a 50% discount.
Investing: Analyzing Returns and Portfolio Performance
For investors, price change percentage is the bedrock of performance analysis.
-
Stock Performance: Calculating the percentage change of a stock’s price is the primary way to determine your capital gain or loss. This helps you decide when to buy, sell, or hold.
-
Portfolio Performance: To assess the overall health of your investment portfolio, you calculate the weighted average percentage change of all your holdings. This provides a single, comprehensible figure for your total return.
-
Cryptocurrency Fluctuations: Due to their inherent volatility, tracking percentage changes in cryptocurrencies like Bitcoin or Ethereum is essential for day traders and long-term holders alike.
-
Mutual Funds and ETFs: Fund managers and investors use percentage change to compare the performance of various funds against benchmarks and other investment vehicles.
Business Finance: Pricing Strategies, Sales Growth, and Cost Analysis
Businesses rely heavily on price change percentages for strategic planning and operational insights.
-
Pricing Strategies: Companies analyze competitor price changes and the percentage change in their own product costs to set optimal selling prices that maximize profit margins and market share.
-
Sales Growth: Measuring the percentage change in sales revenue from one quarter to the next provides a clear indicator of business growth or contraction.
-
Cost of Goods Sold (COGS) Analysis: Tracking percentage changes in raw material costs helps businesses anticipate production expenses and adjust their supply chain or pricing accordingly.
-
Expense Management: Monitoring the percentage increase in operational expenses (e.g., rent, salaries) allows businesses to identify areas for cost control and efficiency improvements.
Economic Indicators: Inflation and Deflation Rates
At a macroeconomic level, price change percentages are fundamental to understanding the health of an economy.
-
Consumer Price Index (CPI): As mentioned, the CPI measures the average percentage change over time in the prices paid by urban consumers for a market basket of consumer goods and services. It’s the most widely used measure of inflation.
-
Producer Price Index (PPI): This measures the average percentage change over time in the selling prices received by domestic producers for their output. It’s often seen as a leading indicator of consumer inflation.
-
GDP Deflator: This broader measure of inflation tracks the percentage change in the prices of all new, domestically produced, final goods and services in an economy.
Leveraging Tools and Techniques for Efficient Calculation
While the formula is simple, manually calculating price change percentages for multiple items or over extended periods can be tedious. Fortunately, various tools can streamline this process.
Spreadsheets (Excel/Google Sheets) for Automation
Spreadsheet software is invaluable for financial analysis, offering powerful functions to automate price change calculations.
-
Simple Formulas: You can easily set up columns for “Old Price,” “New Price,” and then apply the formula
=(B2-A2)/A2(assuming A2 is old price and B2 is new price) to calculate the decimal change. Format the cell as a percentage to display the result. -
Relative vs. Absolute References: Understanding how to use relative (
A2) and absolute ($A$2) cell references allows you to drag formulas down columns or across rows to quickly apply the calculation to large datasets. -
Conditional Formatting: You can use conditional formatting to automatically highlight positive changes in green and negative changes in red, providing immediate visual cues.
Online Calculators and Financial Apps
For quick, one-off calculations, online percentage change calculators or financial apps are extremely convenient. Many investment platforms also automatically display percentage changes for your holdings.
-
Ease of Use: Simply input the old and new prices, and the calculator provides the result instantly.
-
Accessibility: Available on any device with internet access.
Mental Math and Estimation for Quick Insights
For situations where precise numbers aren’t immediately available or you need a quick ballpark figure, developing your mental math skills for percentage changes can be very useful.
-
Rule of Thumb: Understand that 10% of a number is simply moving the decimal one place to the left. 1% is two places. Use these as anchors to estimate other percentages.
-
Rough Percentages: If a $200 item increases to $220, you know the increase is $20. $20 is 10% of $200, so it’s a 10% increase.
-
Halving/Doubling: A 50% increase means multiplying by 1.5; a 50% decrease means halving.
Interpreting and Acting on Price Change Data
Calculating the percentage is just the first step. The real value comes from interpreting the data within its context and using it to make informed financial decisions.
Context is King: Relative vs. Absolute Changes
While percentage change is crucial for comparison, don’t completely disregard absolute changes.
-
Magnitude Matters: A 10% gain on a $100 stock is a $10 profit. A 10% gain on a $1,000,000 portfolio is a $100,000 profit. Both are 10%, but their absolute impact on your wealth is vastly different. Always consider both the percentage and the underlying dollar amounts.
-
Basis for Comparison: Ensure you are comparing apples to apples. A 5% increase in a volatile tech stock might be considered modest, while a 5% increase in a typically stable bond fund would be exceptional.
Trend Analysis: Identifying Patterns Over Time
Looking at a single price change percentage gives you a snapshot. Analyzing a series of price changes over time reveals trends.
-
Short-Term Volatility: Frequent, large percentage swings might indicate a volatile asset, suitable for certain trading strategies but risky for others.
-
Long-Term Growth/Decline: Consistent positive percentage changes over years suggest a strong, growing asset or market. Conversely, persistent negative changes signal trouble.
-
Seasonality: Businesses often see predictable percentage changes in sales or costs based on the time of year. Identifying these helps in forecasting.
Decision Making: From Personal Budgets to Investment Strategies
The ultimate goal of calculating price change percentage is to empower better financial decisions.
-
Personal Budget Adjustments: If your core expenses consistently show high percentage increases, it’s a signal to review your spending habits or seek ways to increase income.
-
Investment Buy/Sell Decisions: A significant percentage increase might trigger profit-taking, while a substantial percentage decrease might signal a buying opportunity (if fundamentals are strong) or a need to cut losses.
-
Business Strategic Shifts: Large percentage changes in sales, costs, or market share can prompt businesses to re-evaluate their product lines, marketing efforts, or operational efficiencies.
-
Negotiating Prices: Knowing the typical percentage markups or discounts in a market can give you leverage in negotiations, whether for a car, a house, or business contracts.
Empowering Your Financial Journey
The ability to calculate price change percentage is more than just a mathematical skill; it’s a fundamental financial literacy tool. It provides clarity in a world of constant economic flux, allowing you to transform raw data into meaningful insights. From managing your daily spending and growing your personal wealth to steering a business or understanding broader economic forces, mastering this simple yet powerful calculation empowers you to make smarter, more confident financial decisions. Embrace it, practice it, and let it illuminate your path to financial understanding and success.
aViewFromTheCave is a participant in the Amazon Services LLC Associates Program, an affiliate advertising program designed to provide a means for sites to earn advertising fees by advertising and linking to Amazon.com. Amazon, the Amazon logo, AmazonSupply, and the AmazonSupply logo are trademarks of Amazon.com, Inc. or its affiliates. As an Amazon Associate we earn affiliate commissions from qualifying purchases.