
In the realms of business finance and personal wealth management, data is the compass that guides strategic decision-making. However, raw data—such as a revenue figure or a savings balance—often lacks context when viewed in isolation. To truly understand performance, stakeholders must measure their progress against a defined objective. This is where the “percent to goal” calculation becomes an indispensable tool. Whether you are a corporate CFO tracking quarterly earnings, a sales manager monitoring team quotas, or an individual investor aiming for a retirement milestone, mastering this calculation allows you to quantify success and adjust your trajectory with precision.

Measuring progress through percentages provides a universal language for performance. It strips away the complexity of large figures and provides a clear, proportional view of how much ground has been covered and how much remains. This guide explores the mathematical foundations of calculating percent to goal, its various applications across the financial spectrum, and advanced pacing techniques used to forecast future outcomes.
Understanding the Fundamentals of the Percent to Goal Metric
At its most basic level, the percent to goal metric represents the relationship between an actual result and a target value. In financial terms, it answers the question: “Of the total capital or performance we aimed for, how much have we actually realized?”
The Core Formula
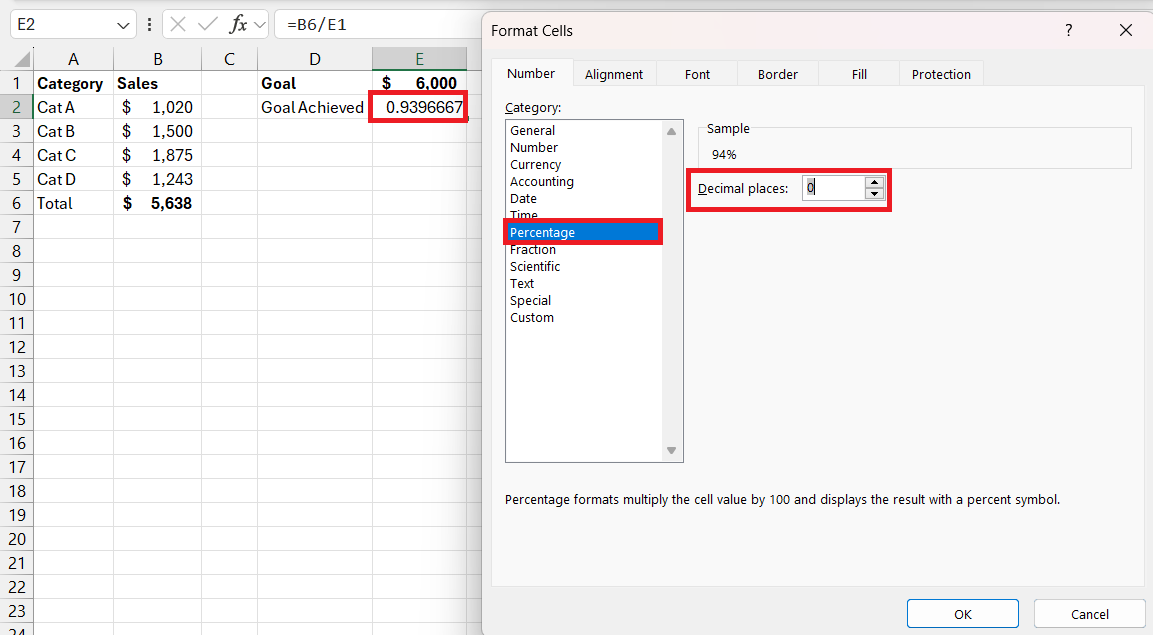
The mathematical formula for calculating percent to goal is straightforward, yet its implications are profound. To find the percentage, you divide the actual value achieved by the target goal value, then multiply the result by 100 to convert the decimal into a percentage format.
Formula: (Actual / Goal) x 100 = % to Goal
For example, if a small business sets a monthly revenue goal of $50,000 and achieves $42,000, the calculation would be:
($42,000 / $50,000) x 100 = 84%
In this scenario, the business has reached 84% of its goal, leaving a 16% gap to be closed. When the actual figure exceeds the goal—for instance, achieving $55,000—the percentage will surpass 100%, indicating over-performance (110% in this case).
Why This Metric Matters in Finance
In finance, context is everything. A profit of $1 million might seem substantial, but if the corporate mandate was to reach $5 million, that $1 million represents a significant underperformance (20% to goal). Conversely, a $10,000 profit against a $5,000 goal represents a 200% achievement.
By utilizing percentages rather than raw numbers, financial analysts can compare different departments, portfolios, or assets that operate on different scales. It levels the playing field, allowing a multinational corporation to compare the efficiency of a high-revenue branch with a smaller, emerging market branch by looking at their relative success against their specific, localized targets.
Applying Percent to Goal in Corporate and Business Finance
Within a corporate environment, calculating percent to goal is a daily necessity. It serves as the foundation for Key Performance Indicators (KPIs) and influences everything from executive bonuses to departmental budget allocations.
Sales and Revenue Tracking
Sales departments are perhaps the most frequent users of the percent to goal metric. Individual contributors and team leads are often measured by their “attainment”—a direct synonym for percent to goal. Tracking this figure allows sales directors to identify top performers and provide additional support to those falling below the 100% threshold.
In high-growth environments, revenue targets are often tiered. A “base” goal might represent 100%, while a “stretch” goal represents 120%. By calculating the percentage to both figures, finance teams can model different cash flow scenarios and determine how much capital will be available for reinvestment at the end of the fiscal period.
Budget Management and Expense Control
While the metric is often used to track income, it is equally vital for managing expenses. In the context of a budget, the “goal” is the maximum amount allocated for a specific category, such as marketing spend or research and development.
In this application, being “under goal” is usually the objective. If a department has an annual budget of $200,000 and has spent $150,000 by the end of the third quarter, they are at 75% to their “limit” goal. Finance managers use these percentages to perform variance analysis, investigating why certain departments might be at 95% of their budget only halfway through the year, which signals a potential overspend.
Measuring Profitability Benchmarks
Beyond simple revenue, businesses track percent to goal for profitability margins. If a firm sets a target for a 20% net profit margin, and the current margin is 15%, the percent to goal calculation (15 / 20) shows they are at 75% of their profitability target. This specific application is crucial for stakeholders and investors who prioritize efficiency and bottom-line health over top-line growth.
Navigating Personal Finance Milestones
On an individual level, the percent to goal calculation is the engine behind effective financial planning. It transforms abstract dreams—like “saving for a house”—into concrete, trackable data points that encourage disciplined financial behavior.
Tracking Savings and Emergency Funds
Financial advisors generally recommend maintaining an emergency fund covering three to six months of living expenses. If an individual determines their target fund is $30,000 and they currently have $12,000 saved, they are 40% of the way to their goal.
Seeing this percentage increase over time provides psychological momentum. It shifts the focus from the daunting $18,000 remaining balance to the tangible 40% progress already made. This “progress visualization” is a cornerstone of behavioral finance, helping individuals stay committed to long-term wealth-building strategies.
Debt Reduction Progress
When paying off debt, such as a mortgage or student loans, the “goal” is the total principal balance at the start of the repayment journey. As payments are made, the percent to goal (where the “goal” is total repayment) reflects how much of the debt has been eradicated.
Alternatively, some use the “Percent Remaining” calculation, which is simply the inverse: (Current Balance / Original Balance) x 100. If you started with $50,000 in debt and now owe $20,000, you have reached 60% of your goal to be debt-free.
Investment and Retirement Targets
For long-term investing, percent to goal is often measured against a “Financial Independence” number. If a person calculates they need $1.5 million to retire comfortably, their current portfolio’s percent to goal offers a clear snapshot of their readiness. This is particularly useful when accounting for market fluctuations; even if the market dips, seeing that the portfolio remains at 65% of the ultimate goal can help investors avoid panic-selling and stay focused on the long-term objective.
Advanced Pacing Calculations and Forecasting
While knowing the current percent to goal is helpful, it is a retrospective look at performance. To make proactive financial decisions, one must combine the percent to goal with a “percent of time elapsed” to determine pacing.
Calculating the Run Rate
The “Run Rate” or “Pacing” calculation tells you if you are on track to hit 100% by the deadline. To calculate pacing, you compare the percent to goal against the percent of time passed in the period.
Pacing Ratio = (% to Goal) / (% of Time Elapsed)
If a company is 40% to its annual revenue goal, but 50% of the year has passed (end of June), the pacing ratio is 0.8 (40 / 50). A ratio of 1.0 means you are exactly on track. A ratio below 1.0, like 0.8, indicates that the current rate of performance will result in missing the goal unless changes are made. A ratio above 1.0 indicates that you are trending toward exceeding the target.
Seasonal Adjustments and Variable Goals
In professional business finance, calculations are rarely linear. Many businesses experience seasonality—for example, a retail business might generate 40% of its annual revenue in the fourth quarter alone. In these cases, a simple “percent of time elapsed” is misleading.
Financial analysts use “weighted goals” to account for this. Instead of a flat monthly target, the goal is distributed based on historical trends. The percent to goal is then calculated against the cumulative year-to-date (YTD) target rather than the total annual target. This provides a much more accurate reflection of whether the business is truly “on track” during slower months.
Strategic Visualizing and Acting on the Data
The ultimate purpose of calculating percent to goal is to inform action. In both corporate and personal finance, the data serves as a trigger for specific financial maneuvers.
Using Dashboards for Real-Time Insights
Modern financial management relies on real-time dashboards. Rather than waiting for a monthly report, businesses use software to visualize percent to goal through progress bars, “thermometer” charts, and gauges. These visual cues allow managers to see at a glance where resources need to be diverted. If a specific product line is only at 30% to goal while others are at 80%, the company might choose to increase marketing spend for that lagging product or investigate supply chain bottlenecks.

Pivot Points: What to Do When the Percentage Is Low
When the percent to goal calculation reveals an underperformance, it serves as a “red flag” for financial intervention. In a business context, this might involve:
-
Cost-Cutting: Reducing discretionary spending to protect profit margins if revenue percentages are low.
-
Re-Forecasting: Adjusting the goal to be more realistic if market conditions have shifted, ensuring that the team remains motivated.
-
Resource Allocation: Moving high-performing assets or personnel to the areas showing the lowest percent to goal.
In personal finance, a low percent to goal for a savings target might trigger a “spending freeze” or the pursuit of a side hustle to increase the “Actual” side of the equation.
Conversely, if the percent to goal is consistently over 100% very early in a period, it indicates that the initial targets were perhaps too conservative. In professional finance, this leads to “raising the bar”—setting higher targets to capitalize on momentum and maximize the potential of the fiscal year.
By consistently applying the percent to goal formula and pairing it with pacing analysis, financial success moves from a matter of guesswork to a matter of mathematical certainty. It provides the clarity needed to navigate the complexities of the financial world with confidence and strategic intent.
aViewFromTheCave is a participant in the Amazon Services LLC Associates Program, an affiliate advertising program designed to provide a means for sites to earn advertising fees by advertising and linking to Amazon.com. Amazon, the Amazon logo, AmazonSupply, and the AmazonSupply logo are trademarks of Amazon.com, Inc. or its affiliates. As an Amazon Associate we earn affiliate commissions from qualifying purchases.