
In the realm of finance, whether you are managing a personal investment portfolio, overseeing a corporate budget, or tracking the growth of a side hustle, percentages are the primary language of progress. Raw numbers tell you where you stand, but percentages tell you where you are going. Understanding how to calculate percent increase and decrease is not merely a mathematical exercise; it is a fundamental skill for evaluating the health of your assets, the efficiency of your operations, and the long-term viability of your financial goals.
The ability to distill complex financial shifts into simple percentage changes allows for standardized comparisons across different asset classes. It enables an investor to compare the growth of a high-growth tech stock against the steady dividends of a utility company or the rising costs of living against a stagnant salary. This guide explores the mechanics of these calculations through the lens of personal and business finance, providing the insight needed to master your capital.
The Mathematical Framework of Financial Evaluation
Before diving into complex market analysis, one must master the basic formula that governs every financial report. The concept of percentage change focuses on the relative difference between an original value and a new value.
The Percent Increase Formula
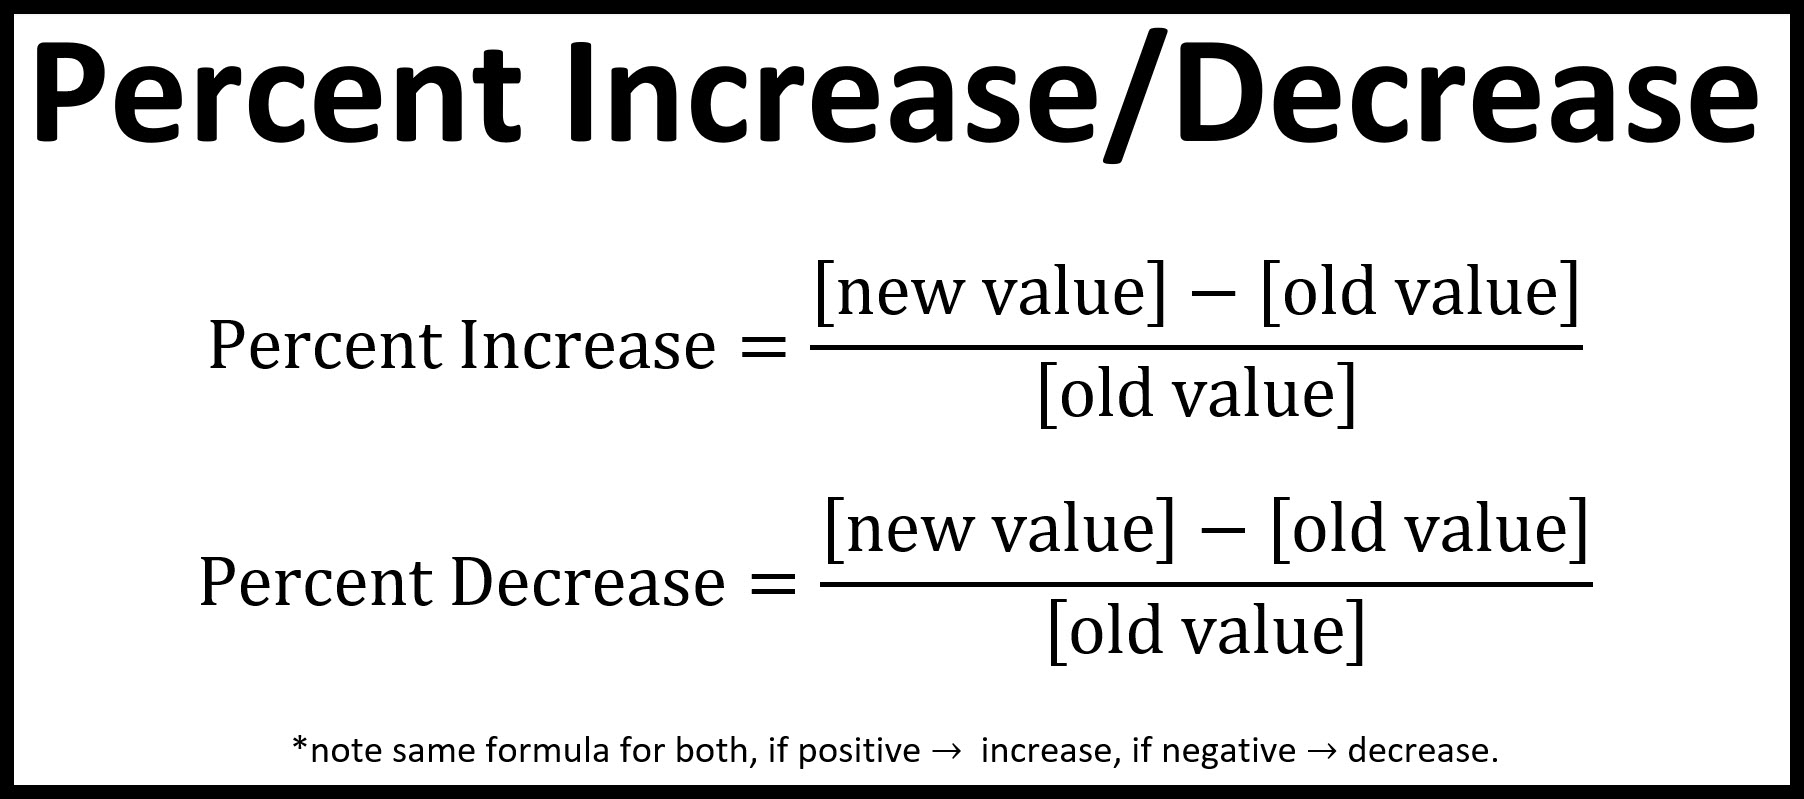
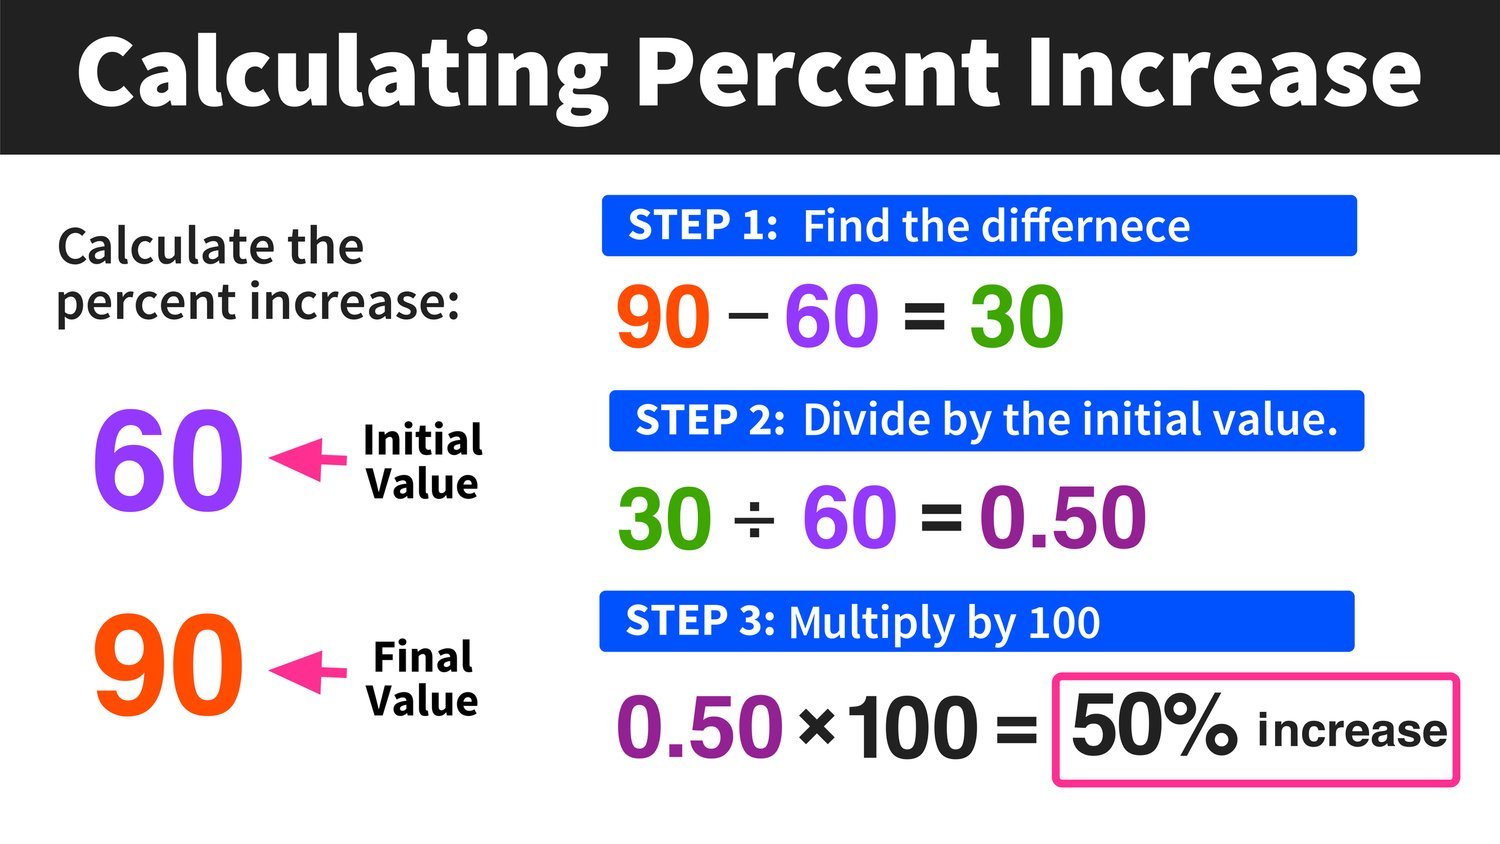
A percent increase represents growth. In a financial context, this could be the rise in a stock price, the growth of a savings account through interest, or an increase in annual revenue for a business. The formula is:
((New Value – Old Value) / Old Value) x 100
To illustrate, if you invested $5,000 in a mutual fund and its value grew to $6,200 over a year, the calculation would be ($6,200 – $5,000) / $5,000. This results in 0.24, which, when multiplied by 100, equals a 24% increase. This percentage provides a clear metric of performance that can be compared against benchmarks like the S&P 500.
The Percent Decrease Formula
Conversely, a percent decrease measures loss or reduction. This is critical for tracking capital depreciation, market corrections, or cost-cutting measures in a business. The formula remains conceptually the same, though the result will be a negative number if you use the “New – Old” method, or a positive representation of “loss” if you use:
((Old Value – New Value) / Old Value) x 100
For example, if your business expenses were $10,000 last month and you successfully reduced them to $8,500 this month, the calculation ($10,000 – $8,500) / $10,000 results in 0.15, or a 15% decrease. In business finance, a 15% decrease in overhead is often as valuable as a 15% increase in sales.
The Importance of the “Base” Value
One of the most common pitfalls in financial analysis is ignoring the “base” (the Old Value). Because the denominator is the original amount, the same dollar change can represent vastly different percentage changes depending on the starting point. A $100 increase on a $1,000 investment is a 10% gain, but a $100 increase on a $10,000 investment is only a 1% gain. This is why small-cap stocks often show higher percentage volatility than blue-chip companies; their smaller “base” makes every dollar move more significant in percentage terms.
Mastering Investment Metrics and Portfolio Performance
For the individual investor, percentage calculations are the pulse of the portfolio. They provide the necessary context to determine if a strategy is working or if rebalancing is required.
Calculating Year-Over-Year (YoY) Growth
Year-over-year (YoY) growth is a staple of financial reporting. It smooths out seasonal volatility and provides a high-level view of long-term trends. If you are tracking the growth of a retirement account, comparing the balance on December 31st of one year to the same date the following year is more informative than tracking month-to-month fluctuations. By applying the percent increase formula to these annual snapshots, you can determine if your wealth-building trajectory is sufficient to meet your retirement targets.
The Asymmetry of Losses and Gains
One of the most vital lessons in finance is the “Asymmetry of Loss.” This refers to the fact that percent decreases are more impactful than percent increases of the same numerical value. If an investment drops by 50%, it does not require a 50% increase to break even; it requires a 100% increase.
Imagine a $10,000 portfolio that suffers a 20% loss. The value is now $8,000. To return to $10,000, the $8,000 must grow by $2,000. While $2,000 was 20% of the original $10,000, it is 25% of the new $8,000 base. Understanding this mathematical reality underscores the importance of risk management and capital preservation in investing.

Measuring Dividend and Yield Growth
For income-focused investors, calculating the percent increase in dividend payments is a key indicator of a company’s financial health. If a company raises its quarterly dividend from $0.50 to $0.55 per share, that is a 10% increase. If this increase outpaces the rate of inflation, the investor’s purchasing power is growing. Tracking these percentages allows investors to identify “Dividend Aristocrats” and other high-performing income assets.
Business Finance: Tracking Revenue and Margin Fluctuations
In the corporate world, percent change is used to measure everything from market share to operational efficiency. Business owners must look beyond the “bottom line” to understand the percentages that drive it.
Analyzing Revenue Trajectory
Revenue growth is the lifeblood of any scaling business. However, raw revenue figures can be misleading if the cost of goods sold (COGS) is also rising. By calculating the percentage increase in revenue and comparing it to the percentage increase in expenses, a business owner can determine if the company is becoming more or less efficient as it grows. If revenue increases by 20% but expenses increase by 30%, the business is experiencing “diseconomies of scale,” a dangerous trend that requires immediate intervention.
Controlling Operational Costs and Profit Margins
Profit margin is itself a percentage, but tracking the change in that margin is where the real insight lies. If your net profit margin moves from 10% to 12%, that is a 2-percentage-point increase, but it represents a 20% increase in profitability relative to the previous margin. Calculating the percent decrease in specific line items—such as shipping costs, utility bills, or software subscriptions—allows a manager to see the direct impact of their cost-saving initiatives on the overall financial health of the organization.
Customer Acquisition Cost (CAC) Trends
For digital businesses and startups, the percentage change in Customer Acquisition Cost (CAC) is a critical metric. If a marketing campaign reduces the CAC from $50 to $40, that is a 20% decrease in the cost to acquire a customer. When scaled across thousands of users, this percentage change can be the difference between a failing venture and a profitable enterprise.
Macroeconomic Indicators and Personal Purchasing Power
Beyond personal portfolios and business ledgers, percentage changes in the broader economy dictate the value of every dollar you earn and spend.
Inflation and Real vs. Nominal Returns
Inflation is essentially a percent increase in the general price level of goods and services. If inflation is 5% per year, the “New Value” of your grocery bill is 5% higher than the “Old Value” for the same items. This has a direct impact on your “Real Return” on investments. If your stock portfolio increases by 8% in a year (Nominal Return), but inflation is 5%, your Real Return—the actual increase in your purchasing power—is roughly 3%. Calculating these percentages ensures you aren’t fooled by nominal gains that are being eroded by rising costs.
Salary Adjustments and Negotiations
When negotiating a salary or evaluating a job offer, understanding percent increase is essential. A $5,000 raise means something very different to someone earning $50,000 (a 10% increase) than it does to someone earning $150,000 (a 3.3% increase). To maintain the same standard of living, your annual salary increase should, at a minimum, match the percentage increase in the Consumer Price Index (CPI). If your raise is 3% but inflation is 6%, you have effectively taken a 3% pay cut in terms of purchasing power.
Debt Reduction and Interest Impact
Percentage decrease is a powerful motivator in debt management. Whether you are using the “Debt Snowball” or “Debt Avalanche” method, tracking the percent decrease in your total principal balance can provide a sense of momentum. Furthermore, understanding how a percent decrease in your interest rate (through refinancing) affects your long-term payments can save you thousands of dollars. A move from a 7% interest rate to a 5% interest rate on a mortgage may seem small, but the percentage decrease in total interest paid over 30 years is massive.
Precision Tools and Best Practices for Financial Reporting
While the formulas are simple, the application of percentage change in financial reporting requires precision and clarity.
Automating Calculations with Financial Tools
In the modern financial landscape, manual calculations are often replaced by spreadsheets. In Excel or Google Sheets, calculating percent change is streamlined. If your “Old Value” is in cell A1 and your “New Value” is in cell B1, the formula =(B1-A1)/A1 will provide the decimal representation. Setting the cell format to “Percentage” then provides the final figure. Automating these calculations in a monthly budget or a business dashboard ensures accuracy and allows for real-time data analysis.
Avoiding the Pitfall of “Percentage Points”
A common error in financial communication is the confusion between “percent” and “percentage points.” If an interest rate rises from 4% to 5%, it has increased by 1 percentage point. However, using our formula, ($5 – $4) / $4 = 0.25, or a 25% increase in the interest cost. Misrepresenting these figures can lead to significant misunderstandings in financial planning and board meetings. Always be explicit about whether you are discussing the absolute change in a rate or the relative change in a value.
Visualizing Change for Stakeholders
For business owners and financial advisors, presenting percentage changes visually is often more impactful than a spreadsheet of numbers. Bar charts showing YoY growth or line graphs showing the percent decrease in debt over time provide an immediate narrative of financial health. When stakeholders see a clear upward or downward trend expressed in percentages, they can make informed decisions faster.
Mastering the calculation of percent increase and decrease is more than a basic math skill; it is an essential component of financial literacy. By consistently applying these formulas to your investments, business operations, and personal expenses, you gain the clarity needed to navigate a complex economic world. Whether you are celebrating a 20% gain in your portfolio or strategically engineering a 10% reduction in business overhead, these percentages are the milestones on your road to financial success.
aViewFromTheCave is a participant in the Amazon Services LLC Associates Program, an affiliate advertising program designed to provide a means for sites to earn advertising fees by advertising and linking to Amazon.com. Amazon, the Amazon logo, AmazonSupply, and the AmazonSupply logo are trademarks of Amazon.com, Inc. or its affiliates. As an Amazon Associate we earn affiliate commissions from qualifying purchases.