
In the world of finance, percentages are the universal language of performance, risk, and growth. Whether you are evaluating the yield on a high-interest savings account, determining the capital gains tax on a stock sale, or analyzing the gross profit margin of a startup, understanding how to calculate and interpret percentages is a non-negotiable skill. At its core, a percentage is a way to express a number as a fraction of 100, providing a standardized scale to compare disparate financial figures. Mastering this calculation allows investors and business owners to strip away the “noise” of raw numbers and focus on the relative health of their assets.

The Mathematics of Wealth: Mastering the Core Formulas
To get the percentage of a number, one must first understand the relationship between a part and its whole. In a financial context, this might represent the relationship between your annual dividend payout and the total value of your investment portfolio. The fundamental formula is simple: (Part / Whole) x 100 = Percentage.
The Basic Calculation Process
To find a specific percentage of a total amount—for instance, if you need to set aside 25% of a $5,000 freelance check for taxes—you convert the percentage into a decimal and multiply. To convert a percentage to a decimal, move the decimal point two places to the left (25% becomes 0.25).
$5,000 times 0.25 = $1,250
This elementary calculation is the building block for nearly every financial model, from simple budgeting to complex derivative pricing. By internalizing this process, you gain the ability to make rapid mental assessments of financial opportunities, such as calculating a discount at a retail sale or estimating a tip at a business lunch.
Finding the Percentage of Increase or Decrease
In personal finance and investing, we are rarely interested in static numbers. We want to know how much our wealth has grown or how much our expenses have climbed. The “percentage change” formula is vital here: [(New Value – Old Value) / Old Value] x 100.
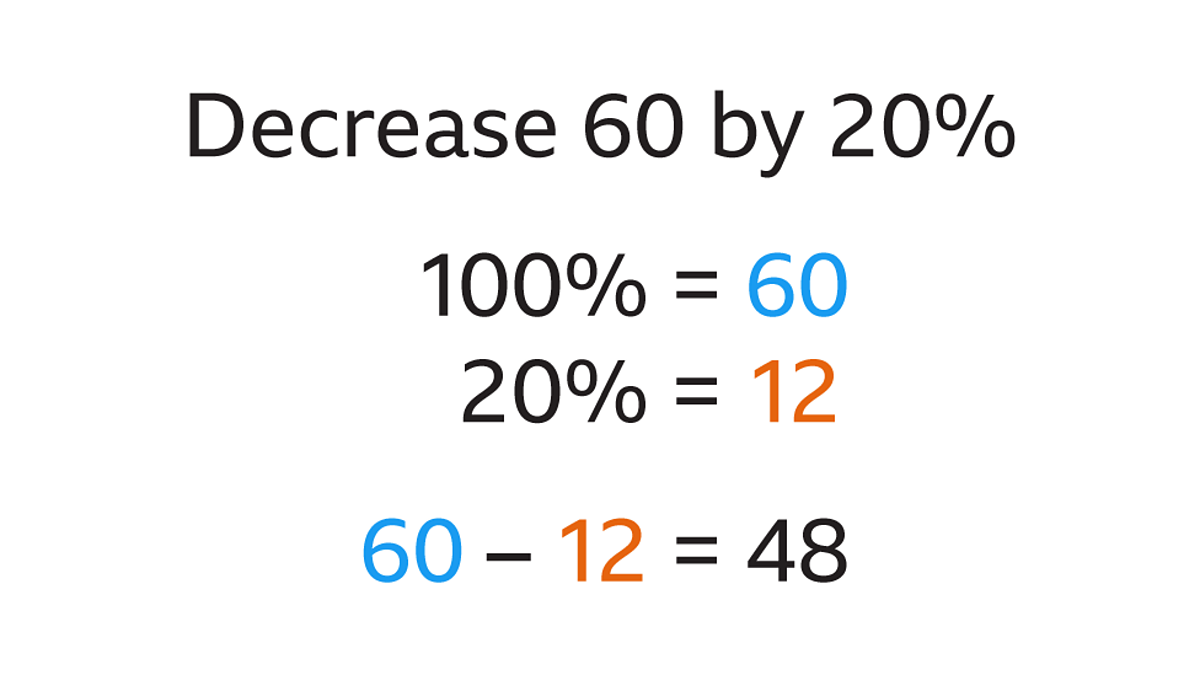
If your brokerage account was worth $10,000 last year and is worth $12,500 today, the calculation would be ($2,500 / $10,000) x 100, resulting in a 25% increase. Conversely, understanding percentage decreases is crucial for risk management. A 50% loss in an investment requires a 100% gain just to break even—a mathematical reality that emphasizes the importance of capital preservation.
Working Backwards: The Reverse Percentage
A common challenge in business finance is finding the original value after a percentage has been applied. This is often seen in “tax-inclusive” pricing. If you paid $108 for a product that included an 8% sales tax, you cannot simply subtract 8% from $108 to find the base price. Instead, you divide the total by (1 + the percentage decimal).
$108 / 1.08 = $100
Understanding this reverse calculation ensures that business owners accurately report their revenue and that consumers understand the true cost of the goods they purchase.
Strategic Investing: Using Percentages to Evaluate Performance
For the sophisticated investor, percentages are more than just math; they are tools for benchmarking and asset allocation. Raw dollar gains are often misleading. A $1,000 profit on a $5,000 investment is significantly more impressive than a $1,000 profit on a $100,000 investment. Percentages provide the necessary context to judge efficiency.
Calculating Return on Investment (ROI)
ROI is the gold standard for measuring the efficiency of an investment. By expressing the gain or loss as a percentage of the initial cost, investors can compare the performance of wildly different assets, such as real estate, cryptocurrencies, and index funds. The formula—(Net Profit / Cost of Investment) x 100—allows for a “side-by-side” comparison that ignores the scale of the investment and focuses purely on the yield generated per dollar spent.
Compound Annual Growth Rate (CAGR)
While simple ROI tells you how much you made over a total period, it doesn’t account for the time it took to get there. This is where the Compound Annual Growth Rate (CAGR) becomes essential. CAGR provides a smoothed annual percentage rate of return, accounting for the effect of compounding over multiple years.
For an investor looking at a ten-year horizon, CAGR is the most accurate way to determine if a portfolio is meeting long-term retirement goals. It allows you to compare the “geometric” progression of your wealth against benchmarks like the S&P 500, which historically averages a CAGR of approximately 7-10% after inflation.
Portfolio Allocation and Rebalancing
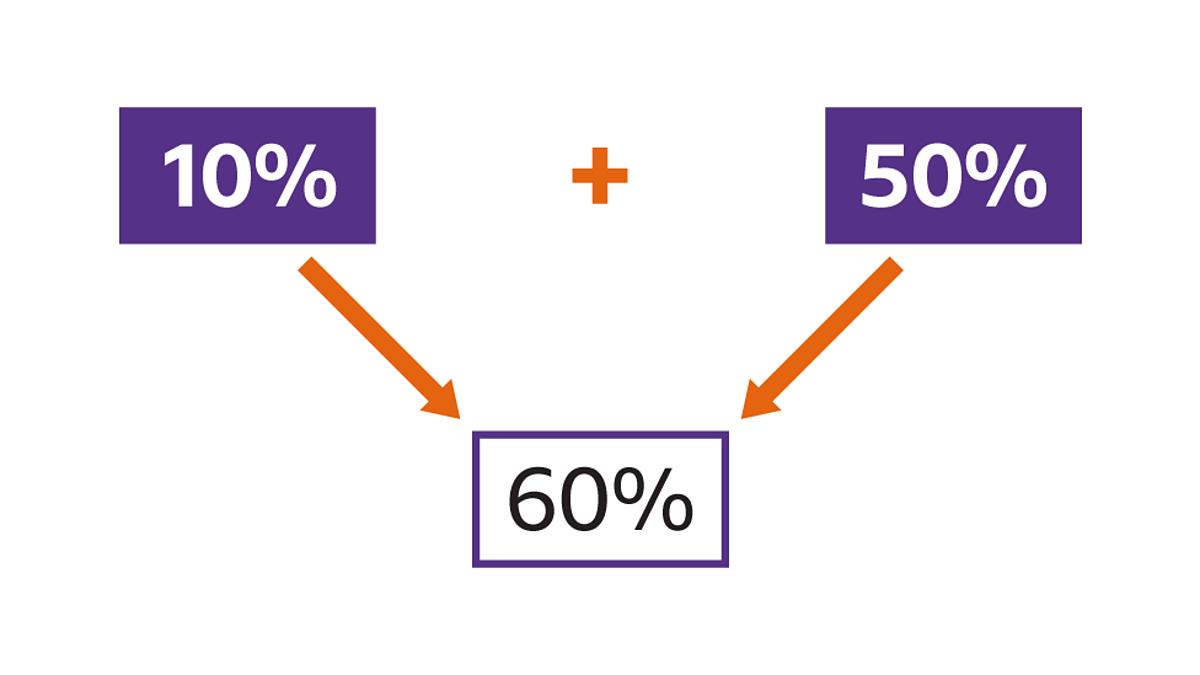
Wealth management often involves maintaining a specific percentage-based split between asset classes—for example, 60% stocks and 40% bonds. As market values fluctuate, these percentages shift. If stocks perform exceptionally well, your portfolio might drift to 70% stocks and 30% bonds. Getting the percentage of your total portfolio represented by each asset class tells you exactly when to sell winners and buy laggards to return to your target risk profile. This disciplined, percentage-based approach is a hallmark of institutional investing.
Corporate Finance: Managing Margins and Profitability
In the business world, percentages are the pulse of the company. Founders and CFOs look at “margins” to determine if a business model is sustainable. A company can have millions in revenue, but if its percentage-based margins are razor-thin, it remains vulnerable to even minor market fluctuations.
Gross vs. Net Profit Margins
The gross profit margin—(Revenue – Cost of Goods Sold) / Revenue—measures the efficiency of production. It tells you what percentage of every dollar earned is left over to cover operating expenses. If a software company has a 90% gross margin, it suggests high scalability.
The net profit margin, however, is the “bottom line.” It is calculated by dividing net income by total revenue. This percentage reveals how much of each dollar actually ends up in the shareholders’ pockets after taxes, interest, and all operating costs have been paid. For a business to be considered healthy, these percentages must stay within industry-standard ranges, which vary significantly from high-volume retail (low margins) to luxury goods (high margins).
Margin vs. Markup: The Crucial Distinction
One of the most common errors in business finance is confusing margin with markup. While both use percentages, they are calculated differently and lead to different pricing strategies.
-
Markup is the percentage added to the cost to reach the selling price.
-
Margin is the percentage of the selling price that is profit.
If an item costs $70 to produce and you want a 30% markup, you sell it for $91. However, your profit margin on that $91 sale is only about 23%. If your goal was a 30% margin, you would need to sell the item for $100. Miscalculating this percentage can lead to unexpected losses and cash flow crises.
Operating Leverage and Expense Ratios
Businesses also use percentages to monitor “burn rates” and efficiency. By calculating operating expenses as a percentage of total revenue, management can see if the company is becoming more or less efficient as it grows. If administrative costs are rising as a percentage of revenue, it may indicate “corporate bloat” that needs to be addressed before it erodes the company’s valuation.
Personal Finance and Debt Management
On a personal level, percentages dictate the cost of our lifestyles and the speed at which we can achieve financial independence. From the interest on a mortgage to the tax bracket we fall into, these figures define our economic reality.
Interest Rates and APR
When you borrow money, the interest rate is the percentage of the principal charged by the lender. However, the Annual Percentage Rate (APR) is a more comprehensive figure because it includes both the interest rate and any additional fees associated with the loan. Understanding how to calculate the monthly interest impact on a credit card balance—by dividing the APR by 12 and multiplying by the balance—is a critical step in debt elimination strategies.
The 50/30/20 Rule of Budgeting
Percentages are the foundation of effective budgeting. Many financial advisors recommend the 50/30/20 rule: 50% of your after-tax income goes to needs (housing, utilities, groceries), 30% to wants (dining out, hobbies), and 20% to savings and debt repayment. By viewing a budget through the lens of percentages rather than fixed dollar amounts, the plan remains relevant even as your income increases over time.
Tax Brackets and Effective Tax Rates
In many jurisdictions, income tax is progressive, meaning different percentages apply to different “buckets” of your income. Your “marginal” tax rate is the percentage you pay on your last dollar earned, but your “effective” tax rate is the actual percentage of your total income that goes to the government. Calculating your effective tax rate (Total Tax Paid / Total Taxable Income) is the only way to truly understand your tax burden and make informed decisions about tax-advantaged accounts like 401(k)s or IRAs.
Leveraging Digital Tools for Financial Modeling
While the ability to calculate percentages manually or mentally is vital, modern finance relies on digital tools to handle complex, multi-variable percentage modeling. These tools allow for “what-if” scenarios that can forecast financial futures with high precision.
Spreadsheet Formulas for Percentage Mastery
In platforms like Microsoft Excel or Google Sheets, calculating percentages is automated through specific syntax. To find the percentage difference between cell A1 and B1, the formula =(B1-A1)/A1 is used, and then the cell format is changed to “Percentage.” For more complex tasks, such as finding the weighted average of a portfolio, spreadsheets use the SUMPRODUCT function to multiply the percentage weight of each asset by its return, providing a consolidated view of performance.
Financial Calculators and API Integrations
For professional traders and financial analysts, manual calculation is often replaced by financial calculators (like the HP 12C) or software that integrates real-time data via APIs. These tools can instantly calculate “Internal Rate of Return” (IRR) or “Yield to Maturity” (YTM), both of which are sophisticated percentage-based metrics used to evaluate the attractiveness of bonds and long-term projects.
By viewing the question “how do you get the percentage of a number” through the expansive lens of money and finance, it becomes clear that this is not just a math problem. It is the fundamental mechanism by which we measure value, growth, and security. Whether you are a retail investor or a corporate executive, the ability to manipulate and interpret these percentages is what separates emotional decision-making from strategic financial success.
aViewFromTheCave is a participant in the Amazon Services LLC Associates Program, an affiliate advertising program designed to provide a means for sites to earn advertising fees by advertising and linking to Amazon.com. Amazon, the Amazon logo, AmazonSupply, and the AmazonSupply logo are trademarks of Amazon.com, Inc. or its affiliates. As an Amazon Associate we earn affiliate commissions from qualifying purchases.