
In the world of finance, percentages are more than just numbers; they are the fundamental language of growth, risk, and value. Whether you are analyzing a stock portfolio, managing a corporate budget, or simply trying to optimize your personal savings, the ability to calculate and interpret percentages is an essential skill. Understanding how to figure percentage allows a professional to translate raw data into actionable insights, moving from “we made $10,000” to “we achieved a 15% profit margin.”
Understanding the Fundamentals: The Core Logic of Financial Percentages
At its most basic level, a percentage represents a fraction of 100. The word itself originates from the Latin per centum, meaning “by the hundred.” In a financial context, figuring a percentage is the process of determining the relative size of one value compared to another. This comparison is what allows investors and business owners to normalize data, making it possible to compare a small startup’s growth to that of a Fortune 500 company.

The Basic Formula and Its Variations
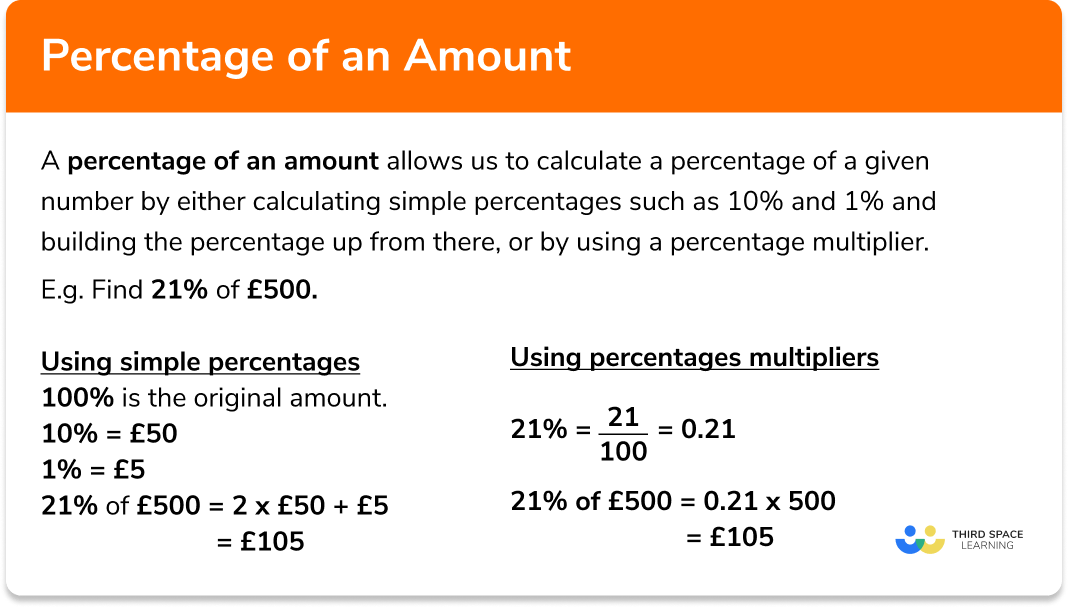
To figure a basic percentage, the formula is straightforward: (Part / Whole) × 100 = Percentage. For example, if you earned $5,000 in dividends from a $100,000 investment, you would divide 5,000 by 100,000 to get 0.05, then multiply by 100 to arrive at 5%.
However, in professional finance, we often need to calculate percentage increases or decreases. This is vital for tracking portfolio performance or revenue growth. The formula for percentage change is: ((New Value – Old Value) / Old Value) × 100. If your business generated $120,000 this year compared to $100,000 last year, the calculation would be (($120,000 – $100,000) / $100,000) × 100, resulting in a 20% increase.
Decimal Conversions and Mental Math for Finance
Speed is often an asset in financial decision-making. Professional investors often bypass the “multiply by 100” step by working directly with decimals. Understanding that 0.07 is 7% and 1.25 represents a 125% value (or a 25% increase) allows for faster calculations of compound interest and tax implications. When you are sitting in a boardroom or looking at a fast-moving ticker, being able to mentally move a decimal point two places to the left to find 1% of a number is a foundational habit that prevents costly errors.
Percentages in Personal Finance: Navigating Debt, Savings, and Taxes
For the individual, figuring percentages is the key to maintaining a healthy net worth. Every financial product we consume, from credit cards to mortgages, is priced using percentages. Understanding these figures is the difference between building wealth and falling into a cycle of debt.
The Impact of APR and Interest Rates
When you borrow money, the cost is expressed as an Annual Percentage Rate (APR). Figuring the percentage of interest you pay monthly is crucial for debt management. To find your monthly interest cost, you divide the APR by 12 and apply it to your balance. On a credit card with a 24% APR and a $5,000 balance, the monthly interest rate is 2% (0.02), meaning you are paying roughly $100 a month just for the privilege of carrying that debt. By figuring this percentage, it becomes clear that even small changes in the interest rate can have a massive impact on the total cost of a loan over time.
Budgeting with the 50/30/20 Rule
In personal finance strategy, percentages are used to create sustainable spending frameworks. The 50/30/20 rule is a popular percentage-based budgeting method: 50% of income goes to necessities, 30% to wants, and 20% to savings and debt repayment. To apply this, one must be able to figure the percentage of their take-home pay allocated to various categories. If your monthly income is $6,000, and your rent is $2,100, you are spending 35% of your income on housing. This percentage-based perspective helps you identify if you are over-leveraged in one area of your life.
Tax Calculations and Effective Rates
The tax system is built entirely on percentages, but it is often misunderstood due to its progressive nature. To figure your effective tax rate, you don’t simply look at your highest tax bracket. Instead, you divide your total tax paid by your total taxable income. If you earned $100,000 and paid $15,000 in federal taxes, your effective tax rate is 15%, even if your top marginal bracket is 22% or 24%. Understanding how to figure this percentage is vital for accurate tax planning and investment strategy.
Investing Metrics: Calculating ROI and Compound Growth
In the realm of investing, percentages are the ultimate scorecard. They allow investors to strip away the noise of dollar amounts and see the actual efficiency of their capital.
Return on Investment (ROI)
The most common question in investing is “How do I figure the percentage of my profit?” This is known as Return on Investment (ROI). The formula is: ((Current Value – Initial Cost) / Initial Cost) × 100. If you bought a stock for $50 and it is now worth $75, your ROI is 50%. This metric is essential because a $25 gain on a $50 investment is far more impressive than a $25 gain on a $1,000 investment. Percentages provide the context necessary to evaluate the success of a trade.
Dividend Yields and Capital Gains
For income-focused investors, the dividend yield is a critical percentage. It is figured by dividing the annual dividend per share by the share price. If a company pays $2.00 in dividends annually and the stock trades at $40, the yield is 5%. Comparing this percentage to the yields of Treasury bonds or high-yield savings accounts helps investors decide where their capital will be most productive.
The Power of Compound Growth
Perhaps the most important use of percentages in finance is understanding compound interest. The “Rule of 72” is a quick way to figure how long it will take for an investment to double at a fixed annual percentage rate. By dividing 72 by the annual interest rate, you get the approximate number of years. For example, at a 10% annual return, your money will double in about 7.2 years. Figuring these percentages over long time horizons is what allows for effective retirement planning.
Business Performance: Mastering Margins and Growth Ratios
For entrepreneurs and corporate executives, figuring percentages is daily work. It is the only way to measure the health of a business and ensure long-term viability.
Gross vs. Net Profit Margins
A business might have millions in revenue, but if its margins are thin, it is at high risk. Gross Profit Margin is figured by subtracting the Cost of Goods Sold (COGS) from Revenue, then dividing by Revenue. This tells you how much of every dollar is left to cover operating expenses. Net Profit Margin, however, is the “bottom line” percentage. It is figured by dividing Net Income by Total Revenue. If a software company has a 30% net margin while a grocery store has a 2% net margin, the software company is inherently more efficient at turning revenue into profit, despite potentially having lower total sales.
Year-over-Year (YoY) Growth
To measure momentum, businesses figure the percentage of growth from one period to the next. Year-over-Year (YoY) growth is calculated by comparing the current year’s metrics to the previous year’s. This normalizes for seasonality; for instance, comparing December sales to the previous December’s sales is more useful than comparing December to January. A steady 10% YoY growth rate is often more attractive to investors than a 50% spike followed by a 20% decline, as it indicates a sustainable business model.
Customer Acquisition Cost (CAC) Ratios
In modern marketing and business finance, companies must figure the percentage of revenue spent on acquiring new customers. By dividing total marketing spend by the number of new customers acquired, you get the CAC. Then, by comparing this to the Lifetime Value (LTV) of a customer, you can figure the LTV/CAC ratio. If your CAC is $100 and your LTV is $300, your ratio is 3:1. Expressing this as a percentage of revenue helps a business decide if it should scale its advertising or cut back.
The Strategic Role of Percentages in Wealth Management
Beyond simple calculations, percentages serve as a strategic tool for managing risk and ensuring long-term financial stability. Professional wealth managers use percentages to build portfolios that can withstand market volatility.
Portfolio Allocation and Rebalancing
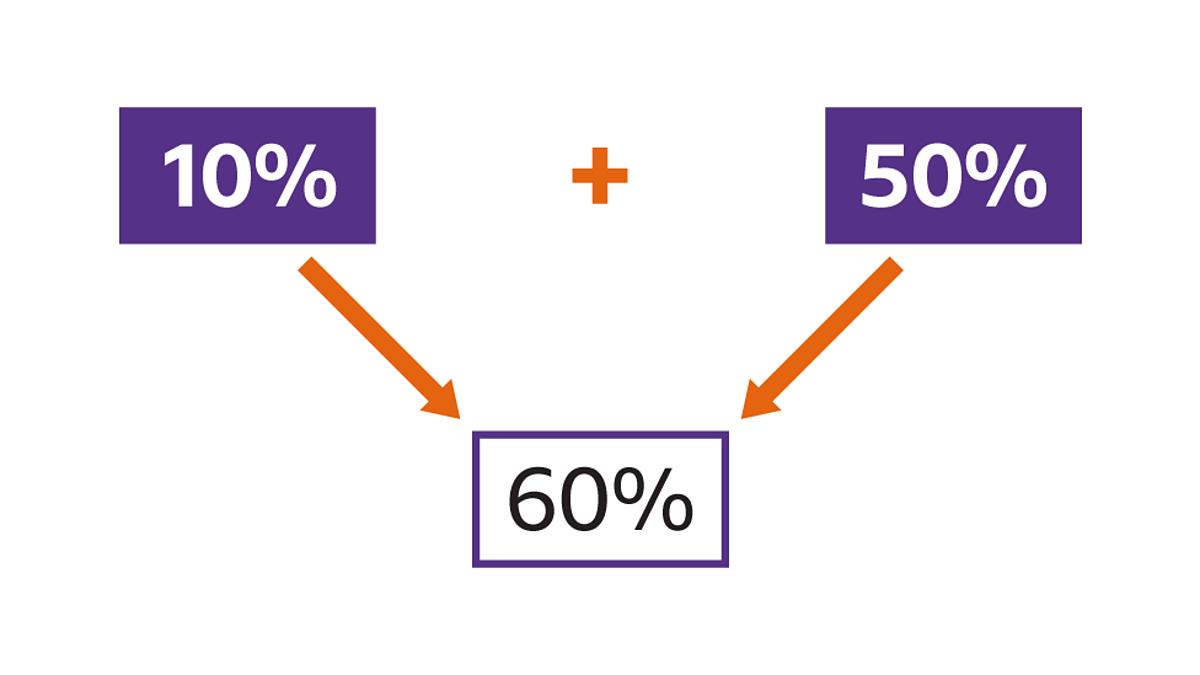
Asset allocation is the process of deciding what percentage of a portfolio should be in stocks, bonds, real estate, or cash. For example, a “60/40” portfolio is a classic strategy where 60% of assets are in equities and 40% are in fixed income. As the market moves, these percentages change. If stocks perform exceptionally well, they might grow to represent 70% of the portfolio. To maintain the original risk profile, an investor must figure the percentage drift and “rebalance” by selling stocks and buying bonds to return to the 60/40 target.
Debt-to-Income (DTI) Ratios
When applying for a mortgage or a business loan, lenders figure your Debt-to-Income ratio. This is the percentage of your gross monthly income that goes toward paying debts. Generally, lenders prefer a DTI below 36%. Knowing how to figure this percentage yourself allows you to assess your borrowing power before you ever step into a bank. It provides a clear, numerical boundary for financial safety.
Inflation and Real Returns
Finally, understanding percentages is necessary to protect against the eroding power of inflation. If your savings account pays 4% interest, but inflation is running at 5%, your “real” return is actually -1%. Figuring the percentage difference between nominal returns and inflation is the only way to ensure that your purchasing power is actually growing over time.
In conclusion, figuring percentage is not just a mathematical exercise; it is a vital financial competency. Whether you are calculating the APR on a loan, the ROI on a stock, or the net margin of a business, percentages provide the clarity and context needed to make informed, professional decisions. By mastering these calculations, you gain the ability to see through the complexity of the financial world and focus on what truly matters: growth, efficiency, and long-term value.
aViewFromTheCave is a participant in the Amazon Services LLC Associates Program, an affiliate advertising program designed to provide a means for sites to earn advertising fees by advertising and linking to Amazon.com. Amazon, the Amazon logo, AmazonSupply, and the AmazonSupply logo are trademarks of Amazon.com, Inc. or its affiliates. As an Amazon Associate we earn affiliate commissions from qualifying purchases.