
The question of “how often does the stock market crash?” is one that looms large in the minds of investors, both seasoned and novice. It’s a natural query, born from a primal desire for security and a healthy respect for the immense wealth destruction that can accompany severe market downturns. While the imagery of a “crash” often conjures dramatic headlines and frantic trading, understanding its true frequency, causes, and implications is crucial for anyone navigating the financial markets. This article delves into the historical data, explores the nuanced definitions of market volatility, and offers insights into how investors can prepare for and even thrive amidst these inevitable economic cycles.

Defining a Stock Market Crash vs. Correction
Before we can accurately discuss the frequency of stock market crashes, it’s essential to distinguish between a “crash” and other, more common market downturns, such as corrections or bear markets. These terms are often used interchangeably in casual conversation, but in financial analysis, they represent distinct phenomena with different magnitudes and psychological impacts.
What Constitutes a Market Crash?
A “stock market crash” typically refers to a sudden, significant, and often unexpected drop in stock prices across a broad market index, such as the S&P 500 or the Dow Jones Industrial Average. While there’s no universally agreed-upon numerical threshold, most financial analysts define a crash as a decline of 20% or more within a very short period, often a single day or a few consecutive days or weeks. The defining characteristic is the speed and severity of the decline, coupled with widespread panic and a loss of confidence among investors. Examples include the Black Monday crash of 1987, where the Dow fell over 22% in a single day, or the initial weeks of the COVID-19 pandemic market sell-off in early 2020. These events are often accompanied by extreme volatility, high trading volumes, and a sense of impending doom, even if the underlying economic fundamentals haven’t deteriorated to the same extent.
Understanding Market Corrections
In contrast to a crash, a “market correction” is a more common and less severe event. A correction is generally defined as a decline of 10% or more from a recent peak, but less than 20%. Corrections are a natural and healthy part of the market cycle, often serving to “reset” overvalued stocks or speculative exuberance. They can occur several times within a bull market and typically last for a few weeks to a few months. While uncomfortable, corrections are generally not characterized by the same level of panic as a crash. They allow the market to digest new information, re-evaluate valuations, and consolidate gains before potentially resuming an upward trend. Investors who understand the difference between a correction and a crash are better equipped to react rationally, rather than emotionally, to market downturns.
A Historical Perspective on Market Volatility
Examining historical data provides the clearest answer to how often the stock market crashes. While precise timing is impossible, patterns of downturns, recoveries, and periods of sustained growth emerge, revealing the cyclical nature of financial markets.
Key Crashes Throughout History
The 20th and early 21st centuries have witnessed several seminal stock market crashes, each with its unique triggers and consequences:
-
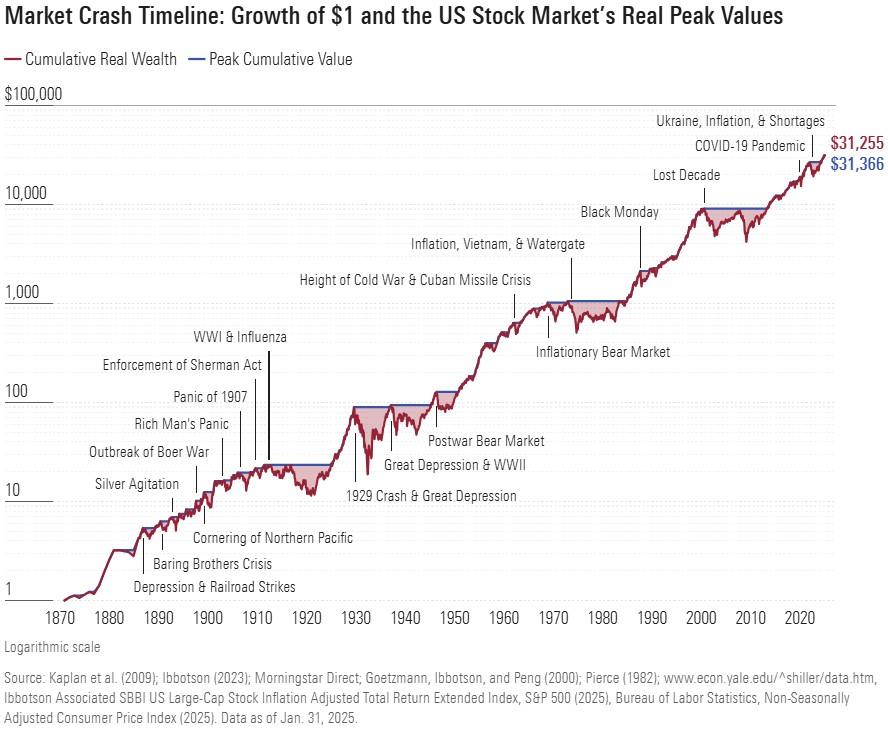
The Great Crash of 1929: Perhaps the most famous and devastating crash, marking the beginning of the Great Depression. The Dow Jones Industrial Average lost nearly 90% of its value over three years, with a significant portion occurring in October 1929.
-
Black Monday (1987): On October 19, 1987, the Dow Jones Industrial Average plummeted 22.6% in a single day, the largest one-day percentage drop in history. This crash was largely attributed to program trading and market liquidity issues, rather than a severe economic recession.
-
The Dot-com Bubble Burst (2000-2002): Following years of speculative fervor in technology and internet stocks, the NASDAQ Composite index fell almost 78% from its peak. While more of a prolonged bear market for tech stocks, the sharp decline in these previously high-flying companies felt like a crash for many investors.
-
The 2008 Financial Crisis: Triggered by the collapse of the subprime mortgage market and subsequent failures of major financial institutions, this crisis saw global markets plunge. The S&P 500 lost approximately 57% from its peak in October 2007 to its trough in March 2009.
-
COVID-19 Pandemic Crash (2020): In February and March 2020, fear and uncertainty surrounding the global spread of the novel coronavirus led to one of the fastest market declines in history. The S&P 500 fell over 30% in just a few weeks, though it recovered remarkably quickly, marking a swift V-shaped recovery.
These events highlight that while crashes are relatively infrequent, they are severe when they occur and can be caused by a confluence of economic, financial, and even psychological factors.
The Frequency and Severity of Downturns
While true “crashes” (20%+ drops in a very short period) are rare, typically occurring once or twice a decade, significant market corrections (10%+) are far more common. Historically, the S&P 500 experiences a correction of 10% or more, on average, every 1-2 years. Bear markets (20%+ declines over a longer period) tend to occur every 3-5 years.
The key takeaway from this historical review is that market downturns are an inherent part of investing. While painful, they are ultimately temporary within the long-term upward trajectory of the stock market. The average length of a bear market has historically been around 10-18 months, followed by significantly longer and more robust bull markets.
Underlying Causes and Triggers of Market Crashes
Stock market crashes are rarely attributable to a single factor; more often, they are the culmination of several underlying pressures reaching a tipping point. Understanding these causes can help investors appreciate the complexity of market dynamics and the interconnectedness of global finance.
Economic Factors (Recessions, Interest Rates, Inflation)
Major economic downturns, or recessions, are a frequent precursor or concurrent event with stock market crashes. As corporate earnings decline, unemployment rises, and consumer spending falters, investor confidence erodes, leading to widespread selling. Changes in monetary policy, such as rapid interest rate hikes by central banks (designed to combat inflation), can also cool an overheating economy and make borrowing more expensive, thereby impacting corporate profitability and investor sentiment. High and persistent inflation can also damage corporate margins and consumer purchasing power, acting as a drag on economic growth and market performance.
Speculative Bubbles and Irrational Exuberance
Many historical crashes have been preceded by periods of “irrational exuberance,” where asset prices become detached from their underlying fundamental values. This occurs when speculative buying, fueled by optimism and the fear of missing out (FOMO), drives prices to unsustainable levels. Eventually, even a small catalyst can prick the bubble, leading to a rapid and dramatic correction as investors rush to liquidate overvalued assets. The Dot-com bubble of the late 1990s and the housing bubble preceding the 2008 crisis are prime examples of this phenomenon.
Geopolitical Events and Black Swan Incidents
Unforeseen global events can also trigger market instability. Wars, terrorist attacks, pandemics, natural disasters, or significant political upheavals can inject extreme uncertainty into the market, prompting a flight to safety. These “black swan” events, by their very nature, are unpredictable and can have an outsized impact due to their suddenness and novelty. The COVID-19 crash in 2020 is a recent and stark reminder of how a non-economic crisis can swiftly cascade into a global market downturn.
Systemic Risks and Financial Contagion
The interconnectedness of the modern global financial system means that problems in one sector or region can quickly spread. Systemic risk refers to the risk of collapse of an entire financial system or market, as opposed to the collapse of a single entity or group of entities. When a major financial institution fails, or a critical part of the financial system breaks down, it can trigger a domino effect, leading to widespread panic and liquidity crises across markets. The 2008 financial crisis demonstrated the devastating power of systemic risk and financial contagion, as problems in the U.S. subprime mortgage market rapidly spread to global banks and markets.
Investing Strategies for Navigating Volatile Markets
While the prospect of a stock market crash can be daunting, a clear understanding of its frequency and causes empowers investors to develop robust strategies for managing risk and achieving long-term financial goals. The goal is not to avoid crashes – that’s impossible – but to build a portfolio resilient enough to weather them.
Diversification and Asset Allocation
One of the most fundamental principles of investing is diversification. By spreading investments across various asset classes (stocks, bonds, real estate, commodities), different industries, geographic regions, and company sizes, investors can reduce the impact of any single asset performing poorly. Asset allocation, which involves determining the appropriate mix of these assets based on one’s risk tolerance, time horizon, and financial goals, is equally crucial. A well-diversified portfolio is less susceptible to extreme losses during a market crash, as different assets often behave differently under stress. For instance, bonds may provide a cushion when stocks decline.
Long-Term Perspective and Dollar-Cost Averaging
Attempting to time the market – buying at the bottom and selling at the top – is notoriously difficult and often leads to suboptimal results. A long-term investment horizon is paramount. Historically, the stock market has always recovered from every crash and gone on to reach new highs, driven by innovation, productivity, and economic growth. Maintaining a long-term perspective allows investors to ride out short-term volatility without panicking.
Dollar-cost averaging (DCA) is a powerful strategy for mitigating risk during downturns. By investing a fixed amount of money at regular intervals, regardless of market conditions, investors buy more shares when prices are low and fewer when prices are high. This systematic approach reduces the average cost per share over time and removes the emotional element of trying to time the market. During a crash, DCA effectively turns a negative event into an opportunity to acquire assets at a discount.
The Importance of a Cash Reserve and Emergency Fund
Having an adequate emergency fund – typically 3-6 months’ worth of living expenses – in a highly liquid and safe account is vital for personal financial security. This cash reserve serves as a buffer, preventing investors from being forced to sell their investments at a loss during a market downturn if an unexpected expense arises. Beyond an emergency fund, some investors maintain a strategic cash reserve within their investment portfolio. This “dry powder” can be deployed to purchase undervalued assets during a market crash, allowing them to capitalize on opportunities when others are selling.
Emotional Discipline and Avoiding Panic Selling
Perhaps the most challenging aspect of navigating volatile markets is maintaining emotional discipline. Fear and greed are powerful emotions that can lead investors to make irrational decisions, such as selling all their holdings at the bottom of a crash or chasing speculative bubbles. History shows that panic selling locks in losses and prevents participation in the subsequent recovery. Successful investors understand that market downturns are temporary and use them as opportunities to rebalance their portfolios, re-evaluate their financial plans, and, if appropriate, buy quality assets at reduced prices. Sticking to a well-thought-out investment plan, rather than reacting to daily headlines, is a hallmark of resilient investing.
The Resilient Nature of the Stock Market
While the fear of a stock market crash is legitimate and can be unsettling, it’s crucial to remember the inherent resilience and long-term growth trajectory of the global economy and equity markets. Crashes, while severe, are often relatively short-lived compared to the expansive periods of growth that precede and follow them.
The Market’s Long-Term Upward Trend
Despite numerous crashes, corrections, and bear markets throughout history, the stock market, particularly broad market indices like the S&P 500, has consistently trended upwards over the long term. This upward bias is driven by fundamental forces: human innovation, technological advancement, corporate profit growth, and the relentless expansion of the global economy. Each crisis, no matter how profound, has ultimately been overcome, leading to new peaks and greater wealth creation. This long-term perspective is the bedrock of successful investing.
Innovation and Economic Growth as Drivers of Recovery
The engine of market recovery and long-term growth is fueled by human ingenuity and economic progress. New technologies emerge, industries evolve, companies adapt, and productivity improves, all contributing to increased profitability and value creation. Even after the most severe crashes, economies have found ways to innovate, rebuild, and generate new opportunities. This adaptive capacity ensures that capital markets continue to serve as a powerful mechanism for wealth accumulation for those who remain invested and disciplined.
In conclusion, stock market crashes are not an everyday occurrence, but they are an inevitable feature of the investment landscape. While true crashes (20%+ drops in a short period) might happen once or twice a decade, significant corrections (10%+) are more frequent. By understanding their nature, historical context, underlying causes, and employing sound investment strategies rooted in diversification, a long-term perspective, and emotional discipline, investors can not only survive these turbulent times but potentially use them to their advantage, ultimately participating in the market’s enduring capacity for growth.
aViewFromTheCave is a participant in the Amazon Services LLC Associates Program, an affiliate advertising program designed to provide a means for sites to earn advertising fees by advertising and linking to Amazon.com. Amazon, the Amazon logo, AmazonSupply, and the AmazonSupply logo are trademarks of Amazon.com, Inc. or its affiliates. As an Amazon Associate we earn affiliate commissions from qualifying purchases.