
For the modern investor, “What did the market close at today?” is more than just a passing inquiry; it is a ritualistic check on the pulse of the global economy. Whether you are a seasoned portfolio manager or a retail investor just beginning your journey into wealth creation, the closing numbers of the major indices offer a snapshot of collective sentiment, economic health, and the shifting tides of capital. However, the raw numbers—the points gained or lost—only tell a fraction of the story. To truly understand what the market close means for your personal finance strategy, one must look beneath the surface of the tickers and into the mechanics of market movement.
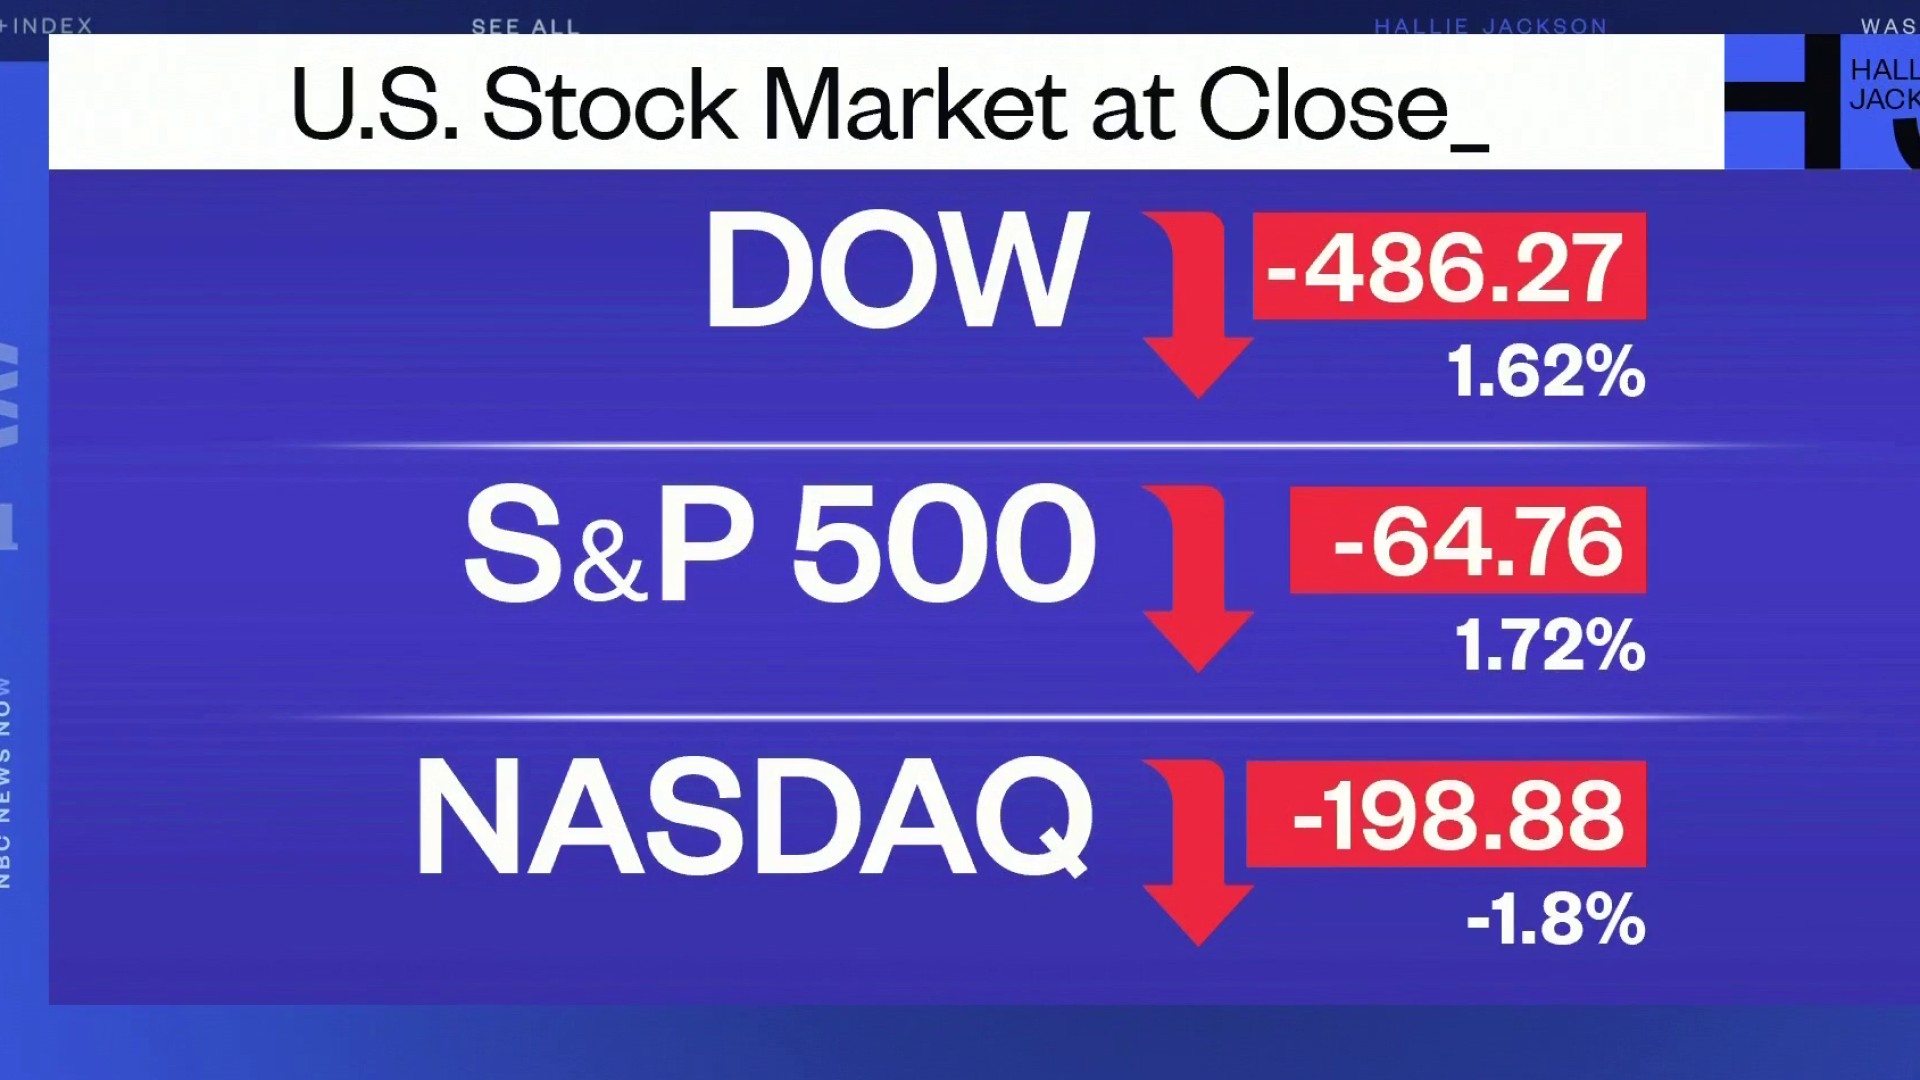
The closing price of a security or an index is the final price at which it trades during regular market hours. This figure is used as the standard benchmark by investors to compare the performance of a stock or fund over time. In the United States, the closing bell at 4:00 PM Eastern Time marks the end of the official session, but the implications of that final tick resonate through retirement accounts, corporate boardrooms, and international markets long after the lights on the trading floor have dimmed.
Decoding Daily Market Closures: Why the Numbers Matter
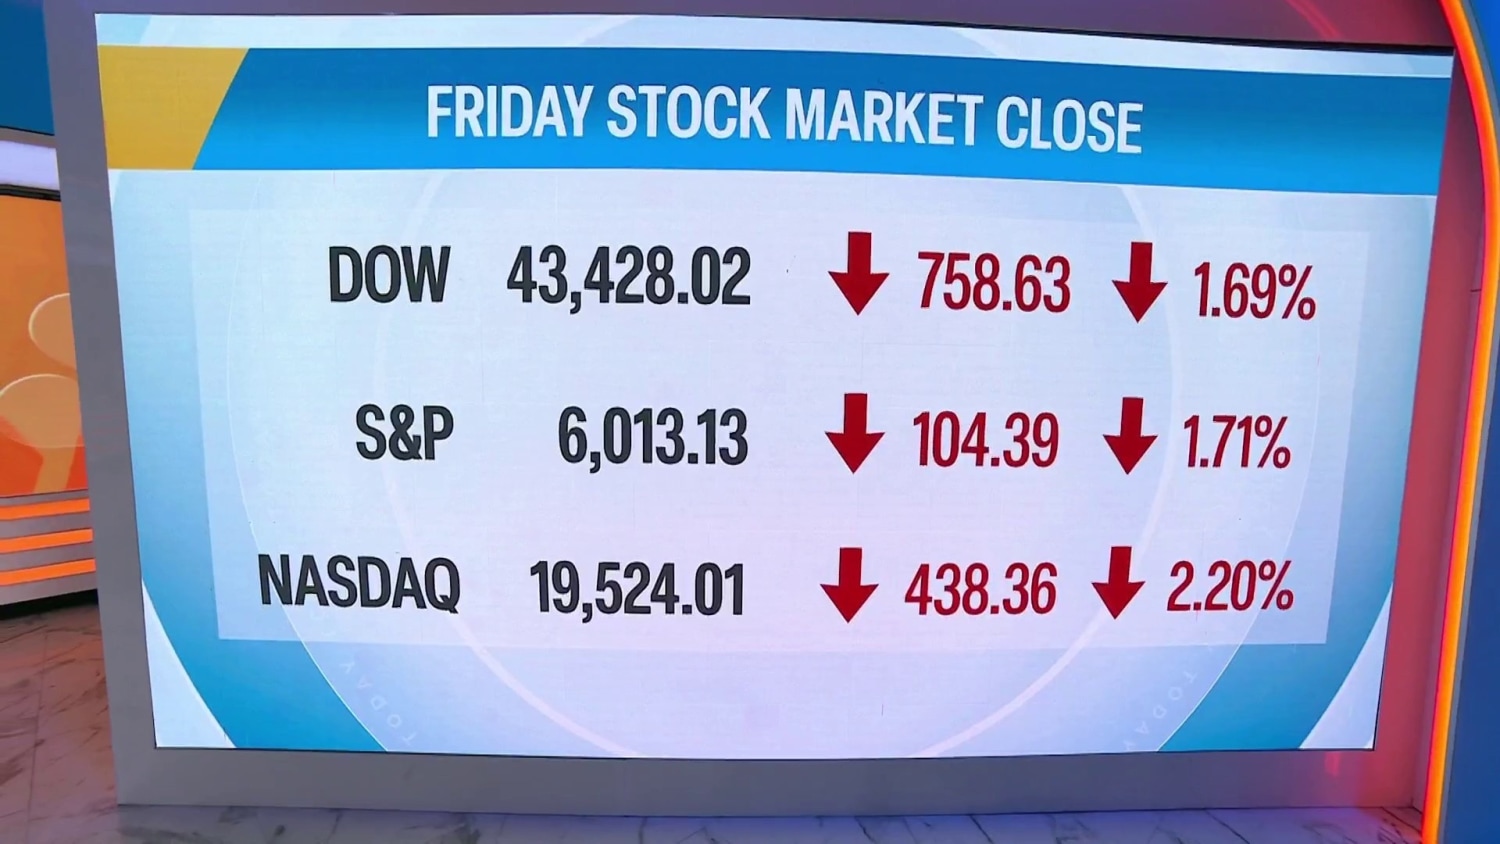
When people ask how the market performed, they are typically referring to the three major U.S. indices: the S&P 500, the Dow Jones Industrial Average (DJIA), and the Nasdaq Composite. Each provides a different lens through which to view the day’s financial activities.
The Significance of the Closing Bell
The closing price is widely considered the most accurate evaluation of a security for the day. This is because the final minutes of trading often see a surge in volume as institutional investors, mutual funds, and hedge funds rebalance their positions. Many automated trading systems and “market-on-close” orders execute at this time, leading to a process known as the closing auction. This auction facilitates a fair and orderly price discovery process, ensuring that the closing number reflects the true equilibrium between supply and demand. For personal finance tracking, the closing price is the figure used to calculate the daily “Net Asset Value” (NAV) of mutual funds and the total value of individual brokerage accounts.
The Three Pillars of the Market
To understand today’s close, one must identify which “market” moved and why.
-
The S&P 500: Often cited as the best single gauge of large-cap U.S. equities, this index includes 500 of the largest companies across various industries. Because it is market-cap weighted, a movement in the S&P 500 reflects the broader health of the American corporate landscape.
-
The Dow Jones Industrial Average: A price-weighted index of 30 “blue-chip” companies. While less diverse than the S&P, it represents the legacy titans of industry.
-
The Nasdaq Composite: Heavily weighted toward technology and growth stocks. When the Nasdaq moves significantly, it often indicates a shift in investor appetite for risk and innovation.
Factors Influencing Today’s Market Movements
No market closes in a vacuum. The figures seen at the end of the day are the result of a complex interplay of data points, psychological triggers, and external events. Understanding these drivers is essential for any investor looking to move beyond reactionary trading toward strategic growth.
Economic Indicators and Central Bank Policy
One of the primary drivers of daily market volatility is the release of economic data. Indicators such as the Consumer Price Index (CPI), which measures inflation, or the monthly jobs report, can cause immediate and drastic shifts in the market close. Investors look to these reports to predict the future actions of the Federal Reserve.
When inflation is high, the market often closes lower in anticipation of interest rate hikes. Higher interest rates increase the cost of borrowing for companies and consumers, which can slow economic growth and reduce corporate earnings. Conversely, a “dovish” stance from the Fed—suggesting a pause or cut in rates—often fuels a market rally.
Corporate Earnings and Sector Performance
During earnings season, the market’s closing numbers are frequently dictated by the quarterly reports of “bellwether” companies. If a tech giant reports record profits and raises its forward guidance, it can lift the entire Nasdaq. However, if retail giants report a slump in consumer spending, it can drag down the S&P 500. Investors look for “beats” or “misses” relative to analyst expectations. Often, a company may report good earnings, but if their outlook for the next quarter is bleak, the stock—and the market—may close lower as investors price in future struggles.
Geopolitical Events and Sentiment
The market is a forward-looking mechanism that hates uncertainty. Geopolitical tensions, trade negotiations, or unexpected political shifts can trigger a flight to safety. In such scenarios, the market may close down as investors move capital out of equities and into “safe-haven” assets like gold or U.S. Treasuries. Daily fluctuations are often driven by “sentiment”—the collective mood of the investing public—which can sometimes deviate from fundamental economic reality in the short term.
Navigating Volatility: How to React to Daily Fluctuations
For the individual focused on long-term wealth and personal finance, a “red” day (where the market closes lower) can be a source of anxiety. However, professional investing requires a disciplined approach to daily data.
The Noise vs. Signal Dilemma
Financial news cycles are designed to emphasize daily drama. A 1% drop in the Dow might be headlined as a “market plunge,” but in the context of a multi-year bull market, it is merely statistical noise. The challenge for the investor is to distinguish between “noise” (short-term volatility) and “signal” (a fundamental change in the economic environment).
If the market closes lower because of a temporary political headline, it is likely noise. If it closes lower because of a sustained trend in declining corporate productivity or rising systemic debt, it is a signal. Successful side hustlers and business owners who invest their surplus income often benefit from ignoring the daily closing bell and focusing on monthly or quarterly trends.
Strategies for the Disciplined Investor
Instead of reacting to where the market closed today, consider these wealth-building strategies:
-
Dollar-Cost Averaging (DCA): By investing a fixed amount of money at regular intervals regardless of the market’s closing price, you buy more shares when prices are low and fewer when they are high. This removes the emotional burden of “timing the market.”
-
Asset Allocation: Ensuring your portfolio is diversified across stocks, bonds, real estate, and cash can buffer the impact of a bad day in the equity markets.
-
Rebalancing: Use significant market moves as a prompt to rebalance. If a market rally has made your tech holdings too large a percentage of your portfolio, selling a portion to buy undervalued sectors can lock in gains.
The Evolution of Market Access and Real-Time Data
The way we consume information about the market close has fundamentally changed. We no longer wait for the evening newspaper or the nightly news broadcast to see the tickers. Digital tools have democratized financial data, allowing anyone with a smartphone to track movements in real-time.
Modern Financial Dashboards
A variety of financial tools and apps provide deep dives into why the market closed at a certain level. These platforms offer heat maps, which show which sectors (e.g., Energy, Healthcare, Tech) performed best, and “advance-decline” lines, which show whether the majority of stocks rose or if the index was carried by just a few heavyweights. For the personal finance enthusiast, these tools are invaluable for identifying where the actual strength or weakness lies in the economy.
After-Hours Trading: The Market Never Truly Sleeps
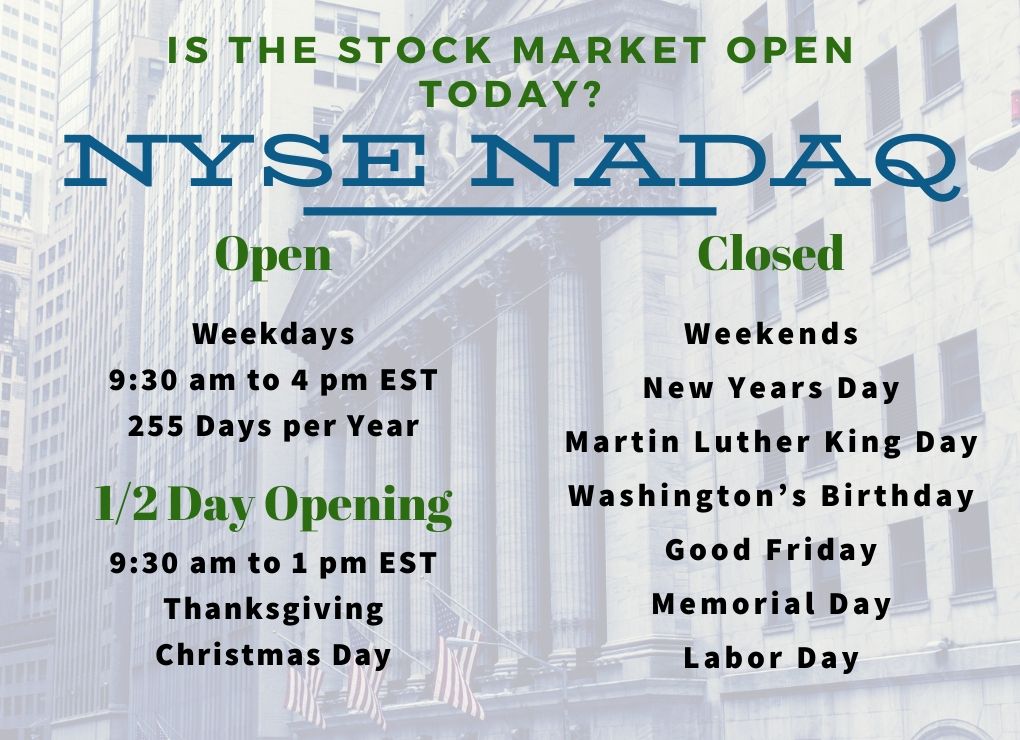
While the official close is at 4:00 PM ET, the “after-hours” market allows for trading to continue. Prices can move significantly after the close due to late-breaking news or earnings releases. While after-hours trading has lower liquidity and higher volatility, it often provides a preview of how the market might open the following morning. Understanding that the “close” is just a milestone in a continuous global cycle helps investors maintain a broader perspective.
The Bigger Picture: Integrating Daily Data into a Wealth-Building Strategy
Ultimately, the question “What did the market close at today?” should be the beginning of a conversation, not the end. For those focused on business finance and personal growth, the daily close is a data point that informs a larger narrative.
Building wealth through the markets is a marathon, not a sprint. Daily fluctuations are the breath of the market—inhaling and exhaling as it processes new information. By understanding the indices, the macro-drivers, and the psychological factors at play, you can transform daily market updates from a source of stress into a powerful tool for informed decision-making.
Whether the market closed at a record high or dipped into correction territory today, the principles of sound investing remain the same: maintain a long-term horizon, keep costs low, and stay diversified. The closing bell is a temporary pause in a much larger journey toward financial independence. Monitoring the close allows you to stay informed, but your strategy ensures you stay ahead.
aViewFromTheCave is a participant in the Amazon Services LLC Associates Program, an affiliate advertising program designed to provide a means for sites to earn advertising fees by advertising and linking to Amazon.com. Amazon, the Amazon logo, AmazonSupply, and the AmazonSupply logo are trademarks of Amazon.com, Inc. or its affiliates. As an Amazon Associate we earn affiliate commissions from qualifying purchases.