
In the dynamic world of investing, discerning the health and potential direction of the broader market is a perpetual challenge. Among the myriad metrics available, the Price-to-Earnings (P/E) ratio of the S&P 500 stands out as a singularly important indicator. It offers a snapshot of how investors collectively value corporate earnings, providing crucial insights into market sentiment and potential future returns. While its precise current value fluctuates daily, understanding what the S&P 500 P/E ratio represents, how it’s calculated, and what factors influence it is far more valuable than any single number. For both seasoned investors and curious newcomers, this ratio serves as a fundamental compass, guiding interpretations of whether the market is overvalued, undervalued, or trading at a fair price. It’s not merely a statistic; it’s a window into the collective psychology and economic expectations embedded within thousands of individual investment decisions.
Demystifying the P/E Ratio: A Core Valuation Metric
The P/E ratio is arguably one of the most widely cited and frequently debated valuation metrics in financial analysis. At its heart, it’s a simple yet powerful tool that helps investors gauge the price they are paying for a company’s, or in this case, the broader market’s, earnings.
The Basics: What is P/E?
At its most fundamental level, the P/E ratio is calculated by dividing a company’s (or index’s) current share price by its earnings per share (EPS).
P/E Ratio = Market Price Per Share / Earnings Per Share
For an index like the S&P 500, which is composed of 500 of the largest publicly traded companies in the United States, the “Market Price Per Share” is effectively the index level itself, and the “Earnings Per Share” is the aggregated earnings of all constituent companies, weighted by their market capitalization.
What this ratio signifies is how much investors are willing to pay for each dollar of a company’s or the market’s earnings. A high P/E ratio generally suggests that investors expect higher earnings growth in the future and are willing to pay a premium for that potential. Conversely, a low P/E ratio might indicate that investors have lower growth expectations, or it could signal that the asset is undervalued. It reflects investor confidence, growth expectations, and the overall economic environment.
Why the S&P 500 P/E Ratio Matters
The S&P 500 P/E ratio holds significant weight for several reasons:
-
Proxy for Broader Market Valuation: Since the S&P 500 represents approximately 80% of the total U.S. equity market capitalization, its P/E ratio is an excellent barometer for the valuation of the entire U.S. stock market. It offers a general sense of whether stocks, as a whole, are expensive or cheap.
-
Indicator of Investor Sentiment: A rising P/E often reflects increasing optimism and a willingness among investors to take on more risk, typically seen in bull markets. A falling P/E can signal growing pessimism or a flight to safety during bear markets.
-
Benchmark for Comparison: Investors often use the S&P 500’s P/E ratio as a benchmark to assess the valuation of individual stocks or specific sectors. If a stock has a P/E significantly higher than the S&P 500, it might suggest higher growth expectations, but also potentially higher risk.
-
Historical Context for Future Returns: Historical analysis suggests that periods of higher S&P 500 P/E ratios have often been followed by periods of lower long-term stock market returns, and vice-versa. This is because high valuations mean more of the future growth is already “priced in.”
Understanding the basics of the P/E ratio and its significance for the S&P 500 is the first step toward incorporating this powerful metric into a more comprehensive investment strategy.
Navigating the Nuances: Trailing vs. Forward P/E
While the fundamental concept of P/E is straightforward, its application becomes more nuanced when considering the time horizon of the earnings component. Investors and analysts commonly refer to two primary types of P/E ratios: trailing and forward, each offering a distinct perspective on valuation. Additionally, a more complex variant, the Shiller P/E, provides a long-term, cyclically adjusted view.
Trailing P/E: Looking in the Rearview Mirror
The trailing P/E ratio is calculated using a company’s (or index’s) actual earnings per share over the past 12 months. This is often the most straightforward and frequently cited P/E ratio because it relies on confirmed, audited financial data.
-
Pros: Its primary advantage is its reliability. It’s based on facts, not forecasts, which makes it less susceptible to subjective judgment or analytical biases. This concrete data offers a historical reference point that can be useful for trend analysis.
-
Cons: The main drawback is that past performance is not necessarily indicative of future results. In rapidly changing economic environments, or for companies undergoing significant transformations, trailing earnings might not accurately reflect the current or future earning power, potentially making the ratio misleading. For instance, a company recovering from a poor year might have a high trailing P/E simply because its past earnings were exceptionally low.
Forward P/E: Gazing into the Crystal Ball
In contrast, the forward P/E ratio uses estimated earnings per share for the next 12 months. These estimates are typically provided by financial analysts who track companies and industries.
-
Pros: The forward P/E is often considered more relevant for investment decisions because the stock market is inherently forward-looking. It reflects market participants’ expectations about a company’s or the market’s future profitability. If a company is expected to grow its earnings significantly, its forward P/E might appear lower than its trailing P/E, suggesting that the current stock price already discounts some of that anticipated growth.
-
Cons: The primary disadvantage is its inherent uncertainty. Analyst estimates are just that—estimates—and can be subject to significant revisions based on new information, economic shifts, or unforeseen events. Overly optimistic (or pessimistic) forecasts can lead to a distorted view of valuation. Investors must always consider the reliability and consensus of these earnings estimates.
The “Shiller P/E” or Cyclically Adjusted P/E (CAPE) Ratio
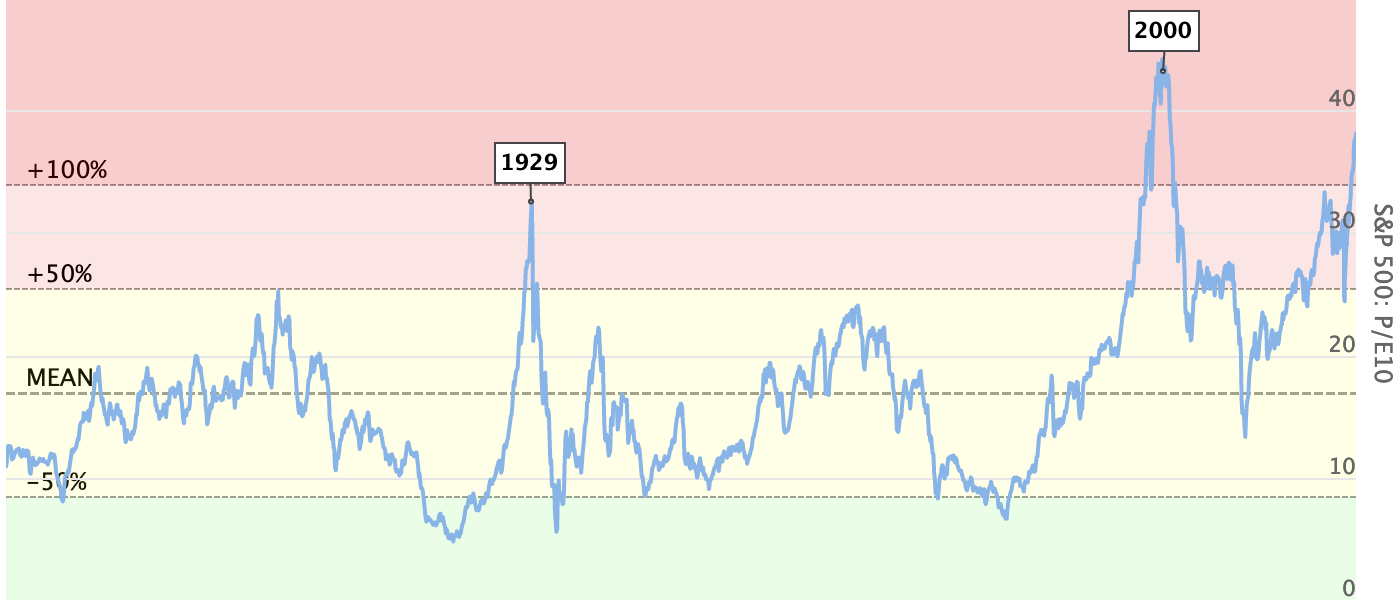
For a truly long-term perspective, economist Robert Shiller developed the Cyclically Adjusted P/E (CAPE) ratio, also known as the Shiller P/E. This metric takes the current stock price and divides it by the average of the past ten years’ earnings, adjusted for inflation.
- Purpose: The Shiller P/E aims to smooth out the volatility of earnings over typical business cycles, providing a more stable and less reactive measure of market valuation. By averaging earnings over a decade, it mitigates the impact of temporary economic booms or busts that can artificially inflate or depress trailing P/E ratios. It offers a perspective on whether the market is overvalued or undervalued from a historical, long-term standpoint. A high CAPE ratio, for instance, has historically been associated with lower subsequent real returns over the next 10-20 years.
Each of these P/E variants offers a unique lens through which to view market valuation. A comprehensive analysis often involves considering all three to gain a well-rounded understanding of where the S&P 500 stands.
The Current Landscape: Interpreting Today’s S&P 500 P/E
When the S&P 500 P/E ratio is reported, whether trailing or forward, the immediate question that arises is: “Is that number high or low?” The answer is rarely simple, as “normal” is a moving target influenced by a confluence of economic, financial, and psychological factors.
What is “Normal” or “Average”?
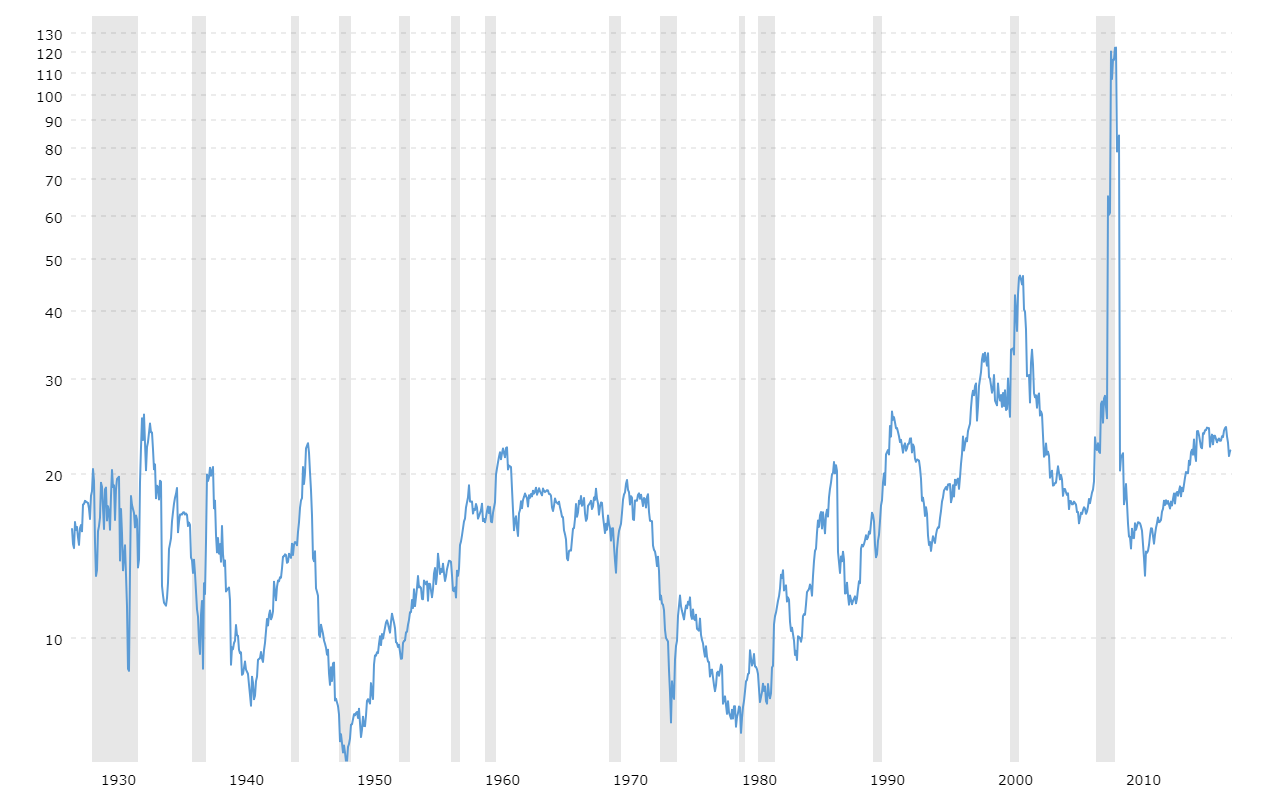
Historically, the average P/E ratio for the S&P 500 has often been cited in the range of 15x to 20x. However, this average has fluctuated significantly over different eras. For instance, during the high-inflation 1970s, P/E ratios were notoriously low, sometimes dipping into single digits. Conversely, the dot-com bubble of the late 1990s saw P/E ratios soar to unprecedented levels, often exceeding 30x or even 40x.
Defining “normal” requires context. A P/E that might have seemed high in the 1980s could be considered moderate in certain periods of the 21st century. It’s crucial to understand that there is no universally ideal P/E ratio; rather, it’s about understanding the factors that justify a particular valuation at a given time.
Factors Influencing the P/E Ratio
Several powerful forces exert pressure on the S&P 500 P/E ratio, causing it to expand or contract:
-
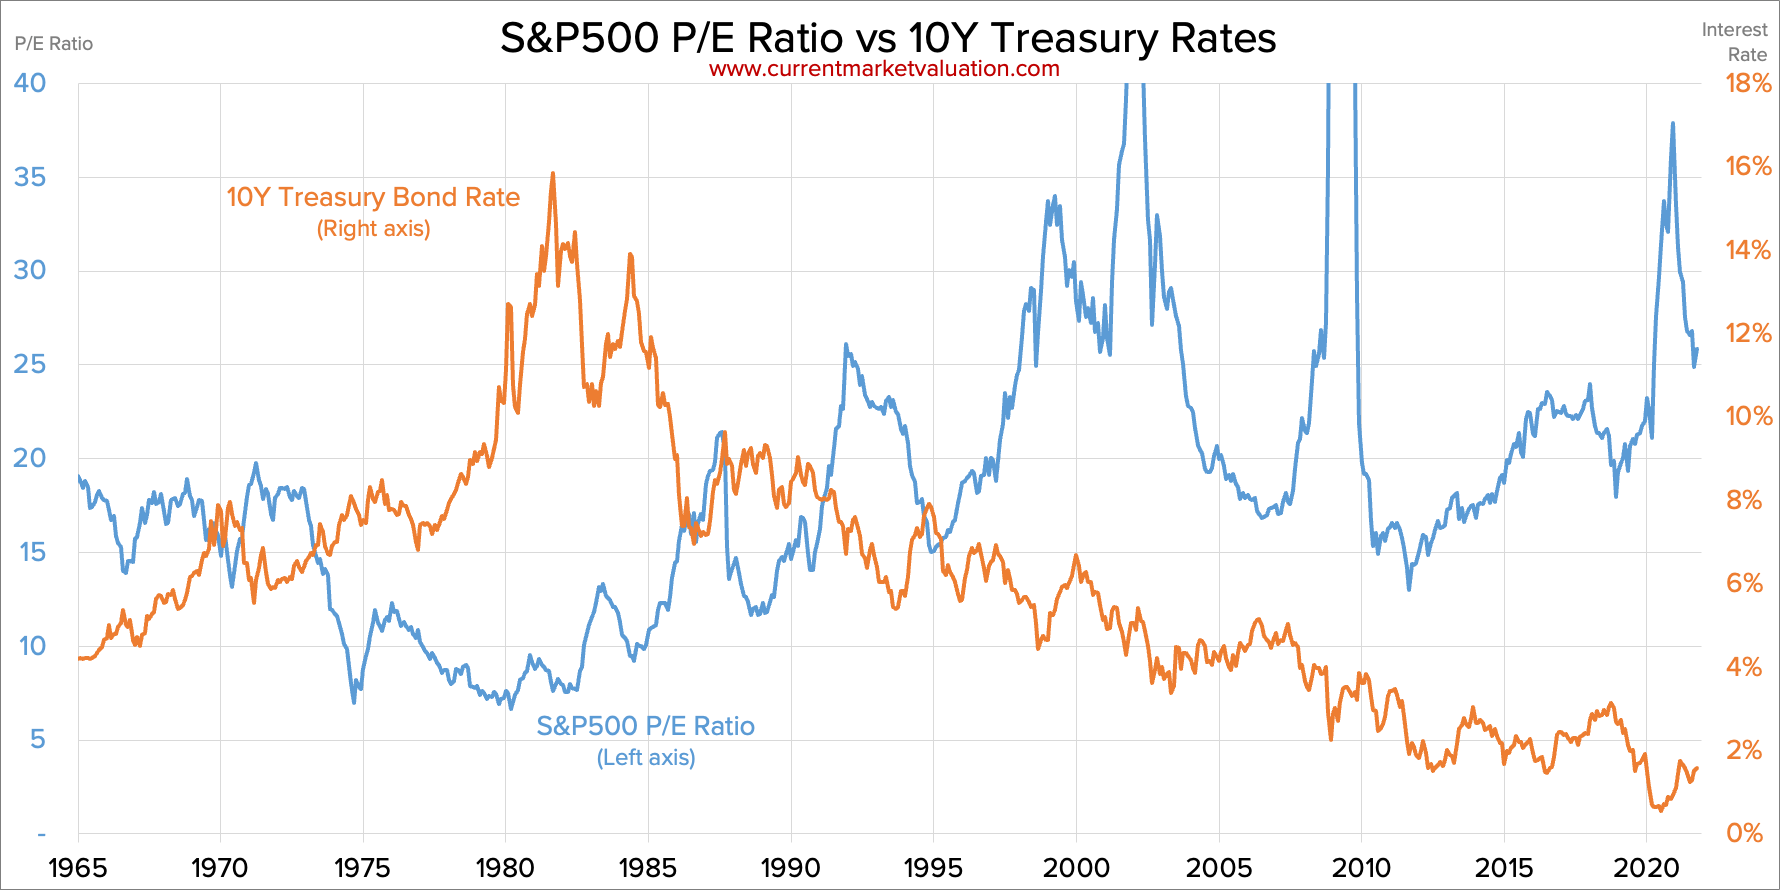
Interest Rates: This is perhaps one of the most significant drivers. Lower interest rates generally make future earnings streams more valuable in today’s terms (due to lower discount rates), thereby supporting higher P/E ratios. Conversely, rising interest rates tend to make equities less attractive compared to fixed-income investments, often leading to P/E contraction.
-
Economic Growth & Corporate Earnings: Robust economic growth typically translates into stronger corporate earnings growth. Higher expected earnings can justify a higher multiple, as investors are willing to pay more for rapidly expanding profits.
-
Inflation: High and persistent inflation can depress P/E ratios. Inflation erodes the purchasing power of future earnings, making them less valuable. It also often leads central banks to raise interest rates, which further pressures valuations.
-
Market Sentiment & Risk Appetite: During periods of strong economic optimism (bull markets), investor confidence can lead to an expansion of P/E multiples as demand for stocks increases. Conversely, in times of uncertainty or fear (bear markets), risk aversion often causes P/E ratios to contract.
-
Technological Shifts & Sector Composition: The dominant sectors within the S&P 500 can also influence the overall P/E. Growth-oriented sectors like technology, which often command higher P/E ratios due to their growth potential, can pull the average S&P 500 P/E higher when they represent a larger portion of the index.
What Does the Current S&P 500 P/E Ratio Tell Us?
As of the current moment, the specific S&P 500 P/E ratio will vary, but the method of interpretation remains constant. If the current P/E ratio (e.g., trailing or forward) is significantly above its historical averages or its long-term CAPE average, it might suggest that the market is currently overvalued. This implies that investors are paying a high price for earnings, and future returns could be more constrained. Such a scenario often warrants caution and a deeper dive into the underlying earnings growth expectations.
Conversely, if the P/E ratio is below historical averages, it might indicate potential undervaluation or, more cautiously, that investors are pessimistic about future earnings. While it could signal an opportunity for higher future returns, it also prompts questions about what negative factors might be depressing valuations.
Ultimately, the current S&P 500 P/E ratio serves as a vital data point that informs investors about market valuation relative to its past and to prevailing economic conditions. It’s a call to action to understand the “why” behind the number rather than simply reacting to the number itself.
Beyond the Number: Strategic Considerations for Investors
While the S&P 500 P/E ratio is an indispensable tool, it is crucial to recognize its limitations and integrate it into a broader, more sophisticated investment framework. No single metric provides the complete picture, and relying solely on the P/E can lead to incomplete or even misleading conclusions.
P/E as One Tool, Not the Only Tool
Successful investing demands a holistic approach. The P/E ratio should be viewed as one powerful diagnostic tool among many, each offering a unique perspective on valuation and financial health. Investors should always consider it alongside other key metrics:
-
PEG Ratio (Price/Earnings to Growth): This metric takes the P/E ratio and divides it by the earnings growth rate, providing context for high-growth companies where a high P/E might be justified.
-
Dividend Yield: For income-focused investors, the dividend yield offers insight into the return on investment through dividends.
-
Price-to-Book (P/B) Ratio: Useful for valuing companies with significant tangible assets, the P/B ratio compares a company’s market value to its book value.
-
Debt-to-Equity Ratio: This financial leverage ratio provides insight into a company’s financial risk.
-
Cash Flow Metrics: Price-to-cash flow can be a more robust valuation metric, as cash flow is harder to manipulate than earnings.
Beyond quantitative metrics, qualitative factors are equally vital. These include the strength of a company’s competitive advantage (its “moat”), the quality and experience of its management team, the overall industry trends, and the regulatory environment. For the S&P 500, these qualitative factors translate to the aggregate health and innovation of the U.S. corporate sector.
The Role of Earnings Growth
A high P/E ratio is not inherently bad if it is supported by robust and sustainable earnings growth. Investors are often willing to pay a premium for companies that can consistently expand their profits at a fast pace. The “G” in the PEG ratio underscores this relationship: a company with a P/E of 30 might be considered fairly valued if its earnings are growing at 30% per year (PEG of 1). If a company’s P/E is 30 but its earnings are only growing at 5%, it’s likely overvalued.
For the S&P 500 as a whole, sustained growth in corporate earnings is the primary engine of long-term stock market appreciation. A high P/E without corresponding earnings growth raises concerns, whereas a modest P/E with strong growth potential can signal an attractive entry point.
Market Cycles and P/E
The P/E ratio of the S&P 500 is not static; it expands and contracts throughout market cycles, often driven by investor psychology. During speculative phases of a bull market, optimism can lead to “multiple expansion,” where investors bid up prices faster than earnings grow, resulting in higher P/E ratios. Conversely, during bear markets or periods of economic uncertainty, “multiple compression” occurs, with stock prices falling faster than earnings, leading to lower P/E ratios.
Understanding these cyclical tendencies can help investors avoid emotional decisions. A high P/E might signify late-stage bull market exuberance, while a low P/E might present opportunities amidst a panic. The key is to think probabilistically and to maintain a long-term perspective.
In conclusion, while knowing the current S&P 500 P/E ratio is valuable, true investment wisdom comes from understanding its context. It’s a powerful indicator, but one that must be integrated into a comprehensive analysis that considers multiple financial metrics, qualitative factors, and the broader economic cycle to make informed and strategic investment decisions.
aViewFromTheCave is a participant in the Amazon Services LLC Associates Program, an affiliate advertising program designed to provide a means for sites to earn advertising fees by advertising and linking to Amazon.com. Amazon, the Amazon logo, AmazonSupply, and the AmazonSupply logo are trademarks of Amazon.com, Inc. or its affiliates. As an Amazon Associate we earn affiliate commissions from qualifying purchases.