
For investors, economists, and financial enthusiasts alike, the S&P 500 Index stands as a towering benchmark of the U.S. stock market’s health and performance. Representing 500 of the largest publicly traded companies in the United States, it offers a broad snapshot of the economy and a powerful indicator for long-term wealth creation. One of the most common questions aspiring and seasoned investors ask is, “What is the average annual return of the S&P 500?” Understanding this figure is crucial for setting realistic investment goals, assessing portfolio performance, and strategizing for future financial success. This article delves into the historical returns of the S&P 500, the methodologies used to calculate them, the factors that influence these returns, and what it means for your investment journey.
Understanding the S&P 500 Index
Before diving into the numbers, it’s essential to grasp what the S&P 500 truly represents. The S&P 500, or Standard & Poor’s 500, is a market-capitalization-weighted index of 500 of the largest U.S. publicly traded companies. Unlike the Dow Jones Industrial Average, which is price-weighted and includes only 30 stocks, the S&P 500 offers a much broader and more representative view of the large-cap U.S. equities market. Its composition spans various sectors, from technology and finance to healthcare and industrials, making it an excellent proxy for the overall health of the American economy. Investors often use it as a benchmark to compare their own investment portfolios against. If your portfolio consistently underperforms the S&P 500, it might be an indication to reassess your strategy.
What Makes Up the S&P 500?
The companies included in the S&P 500 are selected by a committee at S&P Dow Jones Indices based on criteria such as market size, liquidity, and sector representation. While the list changes periodically to reflect market dynamics, it consistently aims to capture leading companies across key sectors. This diversification across sectors is one of the reasons the S&P 500 has historically demonstrated resilience and long-term growth, as the underperformance of one sector can often be offset by the strong performance of another.
Why is the S&P 500 So Important?
Its broad representation and rigorous selection criteria make the S&P 500 a critical benchmark for fund managers, economists, and individual investors. It’s often referenced in financial news, used in economic forecasts, and forms the basis for numerous investment products like index funds and exchange-traded funds (ETFs). For many, investing in an S&P 500 index fund is a cornerstone of a diversified long-term investment strategy, offering exposure to the growth of the U.S. economy with relatively low costs.
Historical Performance: The Numbers Speak for Themselves
When people ask about the average annual return of the S&P 500, they are typically referring to its long-term historical performance. Over several decades, including reinvested dividends, the S&P 500 has delivered a compelling rate of return.
The Often-Cited Average: 10-12%
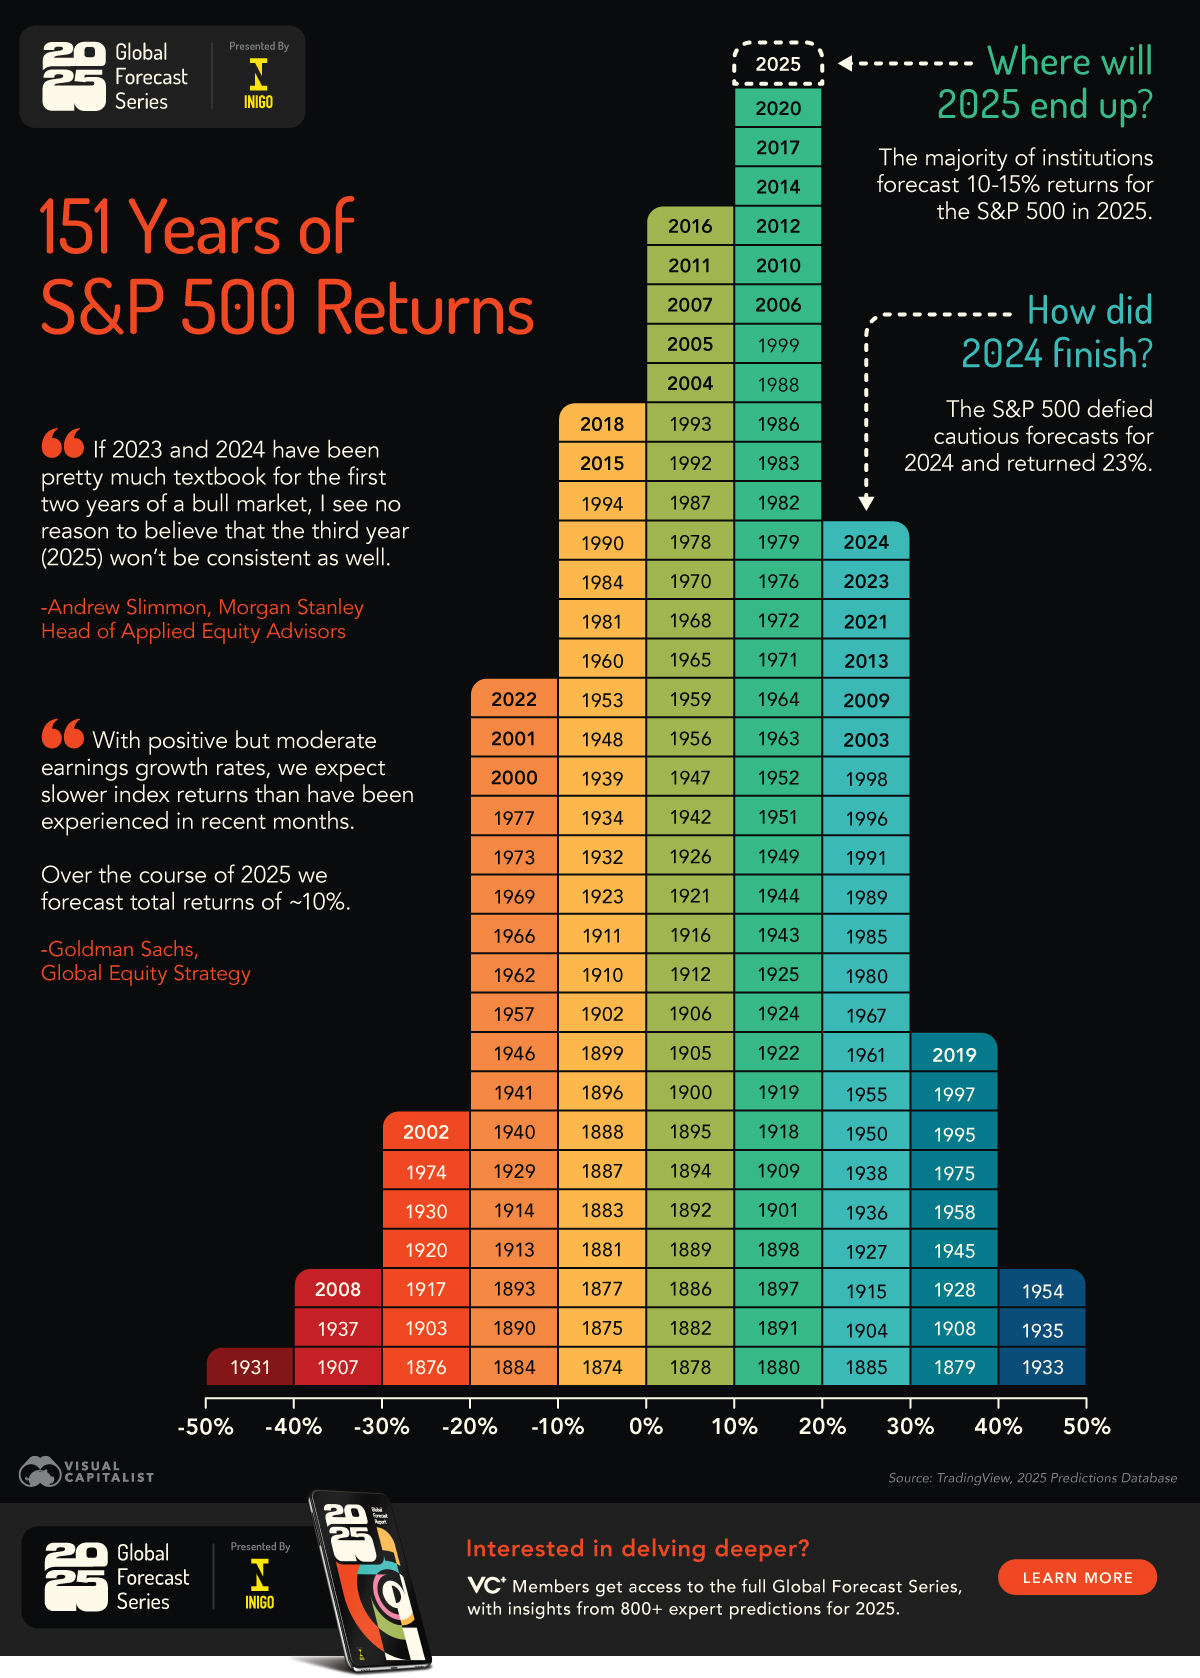
Historically, from its inception in 1957 through the present day, the average annual return of the S&P 500 has been approximately 10-12% per year, including reinvested dividends and before accounting for inflation or fees. This figure is a cornerstone of long-term financial planning and is frequently used by financial advisors to project potential investment growth.
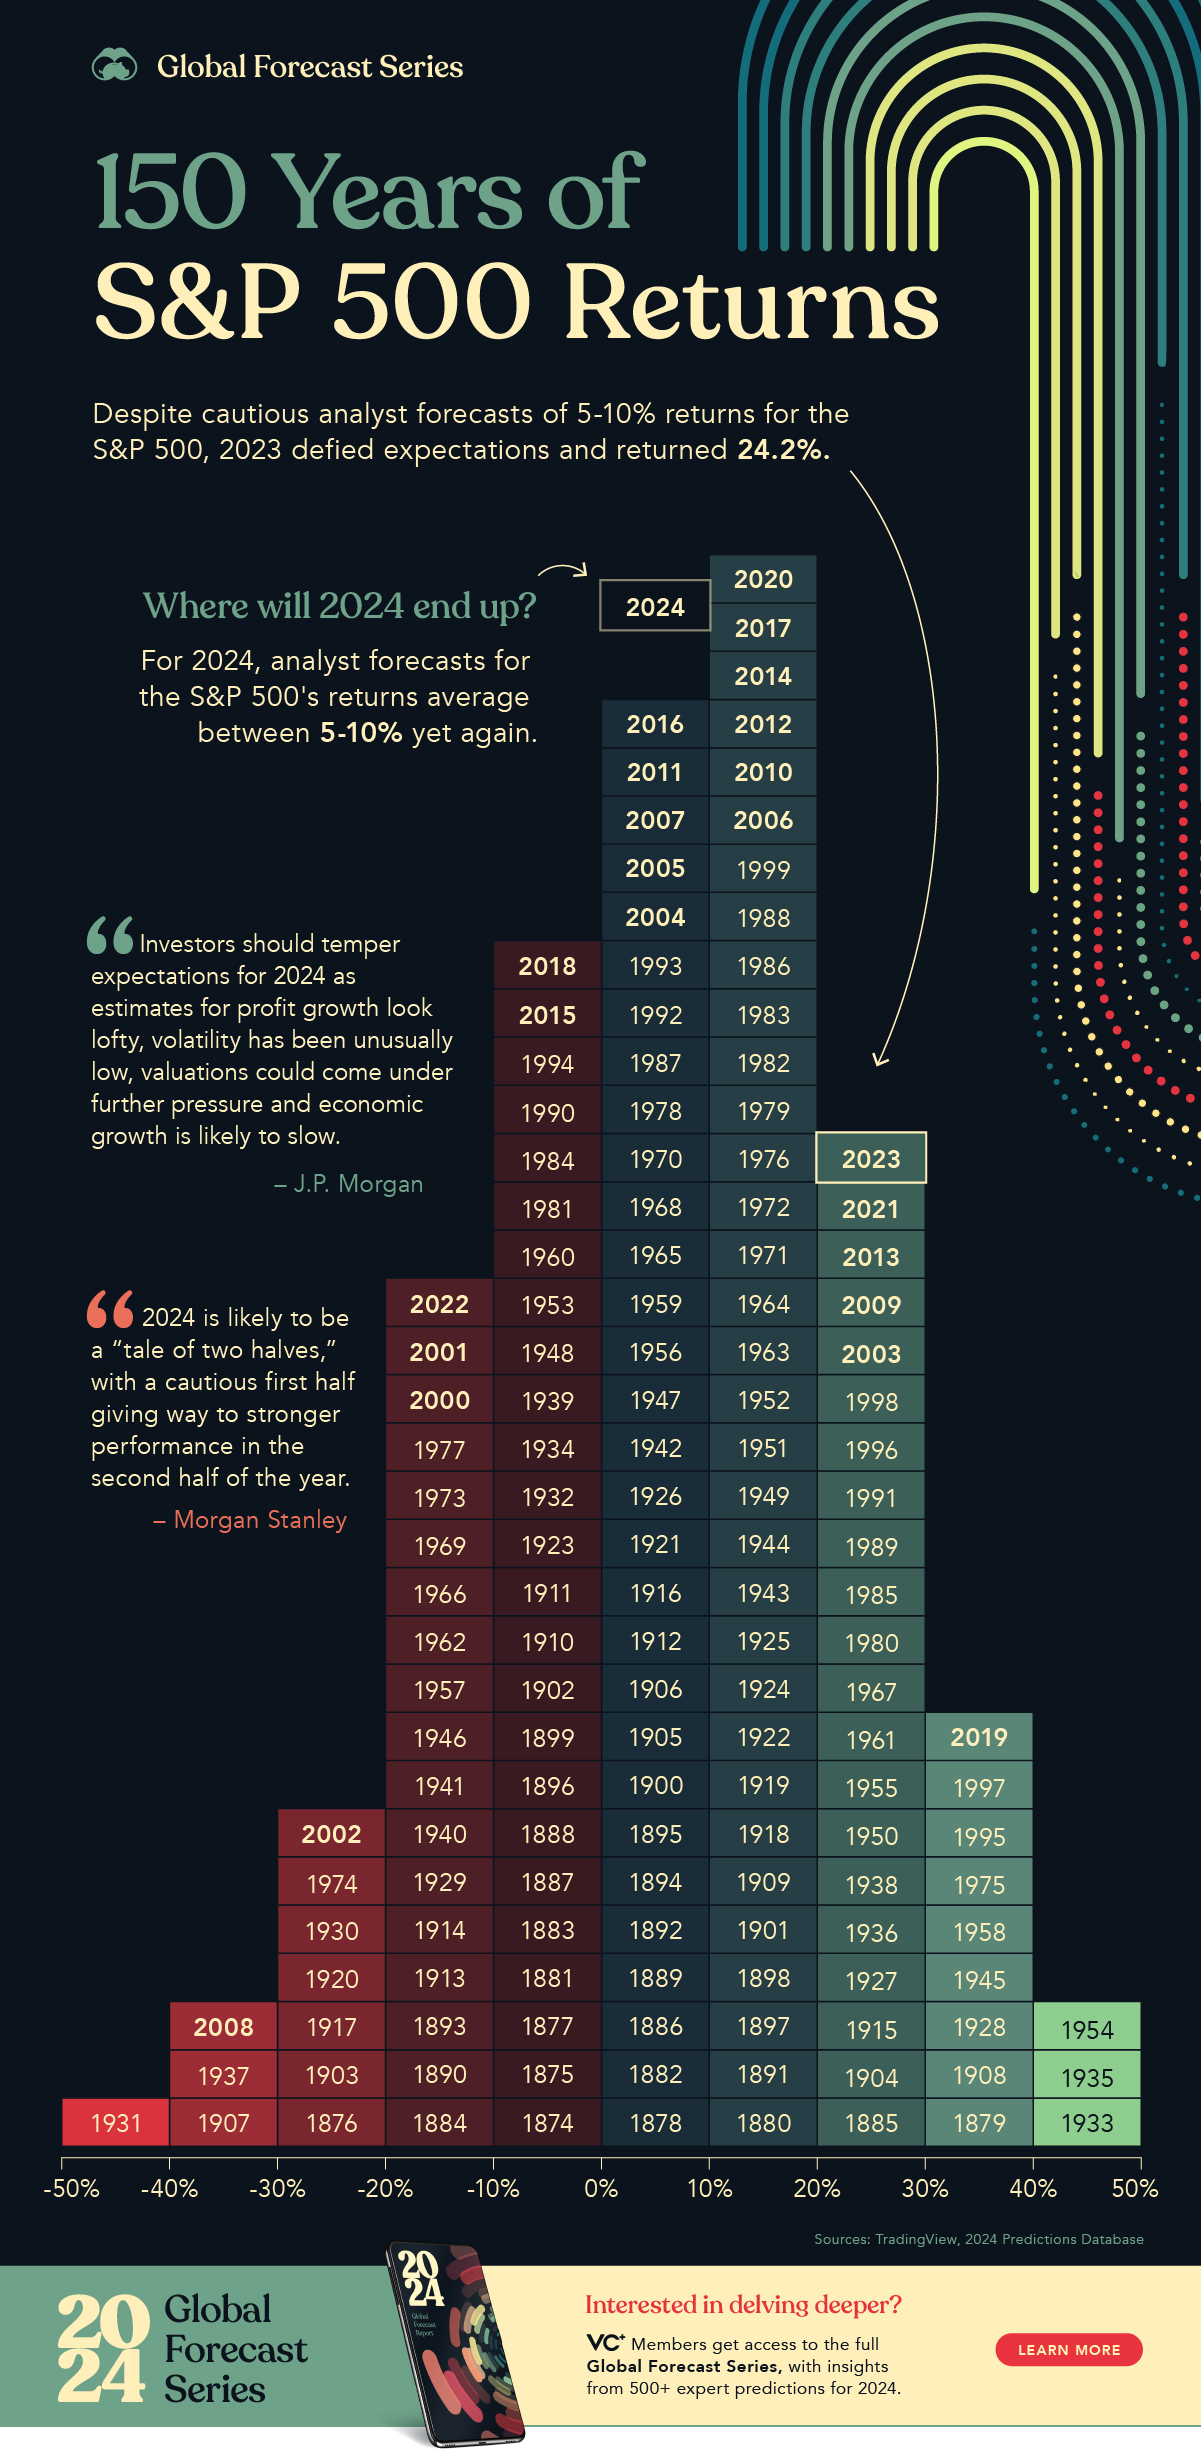
It’s crucial to understand that this is an average. In any given year, the actual return can vary wildly. For instance, in 2021, the S&P 500 returned over 28%, while in 2008, it saw a decline of over 37%. These fluctuations highlight the inherent volatility of the stock market and underscore the importance of a long-term perspective. Averages smooth out these peaks and troughs, revealing the underlying trend of growth over extended periods.
The Critical Role of Dividends
A significant component of the S&P 500’s total return comes from dividends. Dividends are payments made by companies to their shareholders, typically from their profits. When these dividends are reinvested, they buy more shares, which then earn their own dividends and potentially appreciate in value. This compounding effect significantly boosts long-term returns. Without dividend reinvestment, the average annual return would be noticeably lower, often by several percentage points. For example, while the S&P 500’s price return might hover around 7-8% historically, the total return (price change + dividends) pushes it into the 10-12% range. This often-overlooked detail is vital for understanding the true power of long-term equity investing.
Nominal vs. Real Returns
Another important distinction is between nominal return and real return.
-
Nominal return is the stated percentage gain, such as the 10-12% average.
-
Real return adjusts for inflation, providing a more accurate picture of the actual purchasing power gained. If the S&P 500 returned 10% in a year when inflation was 3%, the real return would be approximately 7%. Investors should always consider real returns, as they reflect how much their money can actually buy after accounting for the erosion of purchasing power due to rising prices.
Calculating Average Returns: Beyond Simple Averages
While a simple arithmetic average might seem straightforward, calculating average investment returns, especially over long periods with fluctuating performance, requires a more nuanced approach.
Arithmetic vs. Geometric Average
There are two primary ways to calculate average returns:
-
Arithmetic Average Return: This is the simple average of a series of returns. You sum all annual returns and divide by the number of years. For example, if returns were +20%, -10%, +15%, the arithmetic average would be (20 – 10 + 15) / 3 = 8.33%. While easy to calculate, it tends to overstate the actual growth rate of an investment over multiple periods, especially when volatility is high.
-
Geometric Average Return (Compound Annual Growth Rate – CAGR): This method accounts for the compounding effect of returns over time and is generally a more accurate representation of the actual growth an investor would have experienced. It measures the mean rate of return of an investment over a specified period. The geometric average for the S&P 500’s historical performance (10-12%) is the figure most commonly referenced and is generally more appropriate for evaluating investment returns because it reflects the impact of volatility. When returns fluctuate, the geometric average will always be lower than or equal to the arithmetic average.
For instance, if you start with $100, gain 100% in year one ($200), and lose 50% in year two ($100), the arithmetic average is (100% – 50%) / 2 = 25%. However, you ended up with the same amount you started with, so your actual growth rate (geometric average) is 0%. This illustrates why geometric average is preferred for investment returns.
The Impact of Time Horizon
The “average” return is highly dependent on the time horizon chosen. Short-term averages (e.g., 1-year, 5-year) can be significantly skewed by recent market conditions, bull runs, or bear markets. Long-term averages (e.g., 10-year, 20-year, 50-year) tend to smooth out these fluctuations and provide a more reliable indication of the market’s underlying growth trend. This is why investors are consistently advised to adopt a long-term perspective when investing in equities like the S&P 500.
Factors Influencing S&P 500 Returns
The S&P 500’s returns are not arbitrary; they are the cumulative result of a complex interplay of macroeconomic forces, corporate performance, and market sentiment. Understanding these drivers helps investors contextualize past performance and anticipate future trends.
Economic Growth and Corporate Earnings
At its core, the stock market reflects the health and growth potential of the underlying companies. Sustained economic growth typically leads to higher corporate revenues and profits, which in turn can drive stock prices upward. When companies within the S&P 500 report strong earnings and positive outlooks, investor confidence rises, leading to increased demand for their shares. Conversely, economic downturns or recessions often translate to lower earnings, which can depress stock prices and reduce overall index returns.
Interest Rates and Monetary Policy
Interest rates, primarily set by central banks like the U.S. Federal Reserve, play a significant role. Lower interest rates generally make borrowing cheaper for companies (enabling expansion) and make bonds less attractive, pushing investors towards higher-risk, higher-reward assets like stocks. Higher interest rates can have the opposite effect, increasing borrowing costs for companies and making fixed-income investments more appealing, potentially drawing capital away from equities. The Fed’s monetary policy, through tools like quantitative easing or tightening, profoundly impacts market liquidity and investor appetite for risk.
Inflation
Inflation erodes the purchasing power of money, and its impact on S&P 500 returns can be multifaceted. While companies might pass on higher costs to consumers (leading to higher revenues), unchecked inflation can squeeze profit margins and increase the cost of capital. High inflation can also pressure central banks to raise interest rates, potentially dampening stock market enthusiasm. Investors seek investments that can outpace inflation, and historically, the S&P 500 has demonstrated its ability to do so over the long run, thereby preserving and growing real wealth.
Geopolitical Events and Market Sentiment
Global events, from political instability and trade wars to pandemics and natural disasters, can trigger significant market volatility. These events often impact investor sentiment, leading to periods of fear or irrational exuberance. While such events can cause sharp short-term movements in the S&P 500, the market has historically shown a remarkable ability to recover and continue its upward trajectory over the long term, demonstrating resilience in the face of adversity.
Investing Strategies and the S&P 500
Understanding the S&P 500’s average annual return is not just an academic exercise; it has practical implications for investors. Many use this knowledge to inform their investment strategies, particularly those focused on long-term wealth accumulation.
The Power of Index Investing
Given its strong historical average returns, investing in an S&P 500 index fund or ETF is a popular strategy for many. This approach, often advocated by investment legends like Warren Buffett, offers diversification across 500 companies, typically at very low management fees. It removes the need for individual stock picking and aims to match the market’s performance rather than trying to beat it, which is a challenging endeavor for most investors.
Dollar-Cost Averaging
Recognizing that the S&P 500’s returns fluctuate annually, a strategy known as dollar-cost averaging can be highly effective. This involves investing a fixed amount of money at regular intervals, regardless of market conditions. When prices are high, your fixed investment buys fewer shares, and when prices are low, it buys more shares. Over time, this strategy helps to average out your purchase price and reduces the risk associated with trying to “time the market,” aligning well with the long-term growth potential of the S&P 500.
The Importance of Long-Term Perspective
The S&P 500’s 10-12% average annual return is a testament to the power of long-term investing and compounding. Short-term market movements can be unpredictable and stressful, but by focusing on decades rather than years, investors can harness the historical growth trend. This approach allows time for market downturns to recover and for dividends to compound, significantly increasing the probability of achieving satisfactory returns. Patience and discipline are key when investing in broad market indices like the S&P 500.
In conclusion, the S&P 500 has demonstrated an impressive average annual return of 10-12% over the long term, inclusive of reinvested dividends. This figure serves as a vital benchmark for investors, guiding their expectations and shaping their financial planning. While past performance is never a guarantee of future results, understanding the historical context, the nuances of return calculation, and the underlying factors that drive market performance provides invaluable insight for anyone looking to build wealth through equity investments. By adopting a long-term, disciplined approach, investors can effectively leverage the S&P 500’s historical track record to pursue their financial objectives.
aViewFromTheCave is a participant in the Amazon Services LLC Associates Program, an affiliate advertising program designed to provide a means for sites to earn advertising fees by advertising and linking to Amazon.com. Amazon, the Amazon logo, AmazonSupply, and the AmazonSupply logo are trademarks of Amazon.com, Inc. or its affiliates. As an Amazon Associate we earn affiliate commissions from qualifying purchases.