
For investors, economists, and even casual observers of the financial world, the daily performance of the S&P 500 is often the first metric consulted to gauge the health and sentiment of the U.S. stock market. Representing 500 of the largest publicly traded companies in the United States, this index is far more than just a number; it’s a dynamic reflection of corporate America, consumer confidence, and broader economic forces. While specific real-time data on “today’s” performance is impossible to provide in a static article, understanding the mechanisms, influences, and interpretive frameworks behind its daily movements is crucial for anyone engaging with the financial markets.
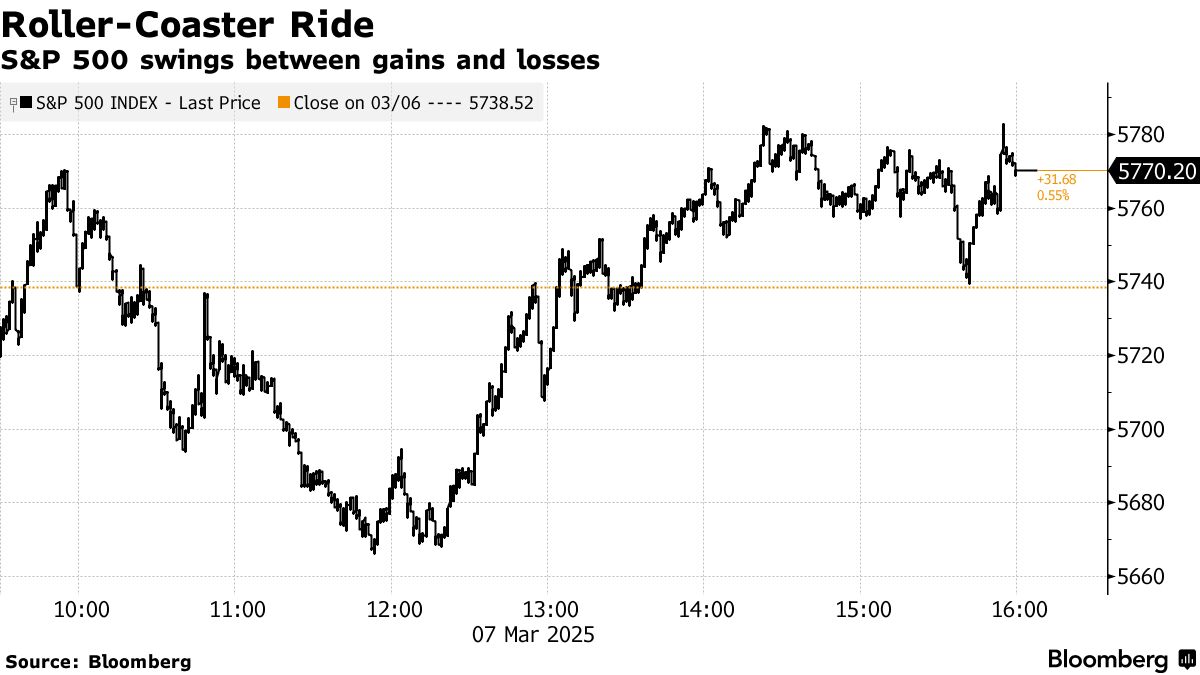
Today, as with any day, the S&P 500’s trajectory is a culmination of myriad factors, from immediate news headlines to long-term economic trends. It tells a story, albeit a complex one, about investor reactions to earnings reports, interest rate speculations, geopolitical developments, and shifts in consumer behavior. This article delves into the core aspects of the S&P 500, exploring what drives its daily performance, how investors can track and interpret its movements, and why its pulse matters so profoundly to the financial landscape.
Understanding the S&P 500: A Bellwether of the U.S. Economy
Before delving into daily fluctuations, it’s essential to grasp what the S&P 500 truly represents and why its movements are so closely watched. It is not just an arbitrary collection of stocks; it’s a carefully constructed index designed to be a comprehensive barometer.
What is the S&P 500?
The S&P 500, or Standard & Poor’s 500, is a market-capitalization-weighted index of 500 of the largest publicly traded companies in the United States. Unlike the Dow Jones Industrial Average, which is price-weighted and composed of just 30 stocks, the S&P 500 offers a broader and more accurate representation of the large-cap U.S. equity market. Its constituents span eleven major sectors, including technology, healthcare, financials, consumer discretionary, industrials, and energy, ensuring a diverse cross-section of the American economy. Companies are selected by a committee based on criteria such as market size, liquidity, public float, and sector representation, making inclusion a significant mark of corporate prestige and financial stability. The weighting by market capitalization means that companies with larger market values (like Apple, Microsoft, Amazon, and Alphabet) have a greater impact on the index’s overall performance.
Why its Performance Matters to You
The S&P 500’s performance is not just for institutional investors or Wall Street traders. It serves as a critical indicator for several reasons. For one, it’s widely regarded as the best single gauge of large-cap U.S. equities and a proxy for the overall health of the U.S. stock market and, by extension, the economy. Its movements often influence investor sentiment globally, impacting everything from consumer spending patterns to corporate investment decisions.
For individual investors, many mutual funds, exchange-traded funds (ETFs), and retirement accounts (like 401(k)s) are benchmarked against or directly invest in S&P 500 index funds. This means that the index’s performance directly affects the value of these investments. A rising S&P 500 generally indicates a healthy return for these portfolios, while a downturn can signal potential losses. Understanding its drivers helps investors make informed decisions, manage risk, and interpret the broader financial news cycle.
Key Components and Sector Influence
The diverse nature of the S&P 500 means that different sectors can have disproportionate impacts on its daily performance. For instance, the technology sector, often boasting some of the largest market-cap companies, can significantly sway the index’s direction on any given day. A strong earnings report from a tech giant, or regulatory news affecting the industry, can send ripples throughout the entire index. Conversely, a downturn in financials due to interest rate concerns or a slump in energy prices impacting oil companies can also exert substantial pressure. Investors often watch these sector-specific movements to understand the underlying currents driving the aggregate S&P 500 performance.
Decoding Daily Fluctuations: Factors Shaping Today’s Performance
The S&P 500’s daily movements are rarely arbitrary. They are the market’s collective response to a constant influx of information, perceived risks, and opportunities. Understanding these drivers is key to interpreting “how it’s doing today.”
Economic Indicators and Corporate Earnings
At the micro level, corporate earnings reports are paramount. When a major S&P 500 company releases its quarterly results, beating or missing analyst expectations, its stock price can move dramatically, impacting the entire index. Aggregated earnings trends across multiple companies can signal broader economic health or weakness.
On the macro front, a steady stream of economic data significantly influences market sentiment. Reports on inflation (Consumer Price Index, Producer Price Index), employment figures (non-farm payrolls, unemployment rate), manufacturing data (PMI), consumer confidence, and GDP growth provide crucial insights into the economy’s trajectory. Positive economic news often fuels optimism and pushes the S&P 500 higher, as it suggests stronger corporate profits. Conversely, signs of slowing growth or rising inflation can trigger sell-offs.
Geopolitical Events and Global Market Sentiment
The interconnectedness of the global economy means that events far beyond U.S. borders can profoundly affect the S&P 500. Geopolitical tensions, trade disputes, conflicts, and even natural disasters in other parts of the world can create uncertainty, disrupt supply chains, and impact corporate profitability, leading to market volatility. Major policy decisions by foreign governments or shifts in global economic conditions can also send ripples through U.S. markets. Investor sentiment is highly reactive; fears of instability or optimism about international cooperation can quickly translate into market movements.
Interest Rates and Central Bank Policies
The Federal Reserve’s monetary policy, particularly its stance on interest rates, is perhaps one of the most powerful influences on the S&P 500. Higher interest rates make borrowing more expensive for companies, potentially reducing their profitability and growth prospects. They also make bonds more attractive relative to stocks, as investors can earn a higher risk-free return. Conversely, lower interest rates stimulate economic activity and make stocks more appealing. The Fed’s rhetoric, meeting minutes, and actual rate decisions are scrutinized intensely by market participants, often causing significant intra-day and day-to-day movements in the S&P 500 as investors anticipate or react to changes.
Technological Shifts and Market Trends
Beyond fundamental economics, innovation and market trends play a critical role. Breakthroughs in technology, the emergence of new industries, or significant shifts in consumer preferences can create new market leaders and reshape existing sectors. For example, the rapid growth of AI, cloud computing, or renewable energy can boost the stocks of companies at the forefront of these trends, thereby lifting the entire S&P 500. Conversely, disruptive technologies can pose challenges to established companies, leading to declines. These long-term trends often manifest in shorter-term market movements as investors adjust their portfolios to capitalize on or mitigate risks from these shifts.
Tracking the S&P 500: Essential Tools and Information Sources
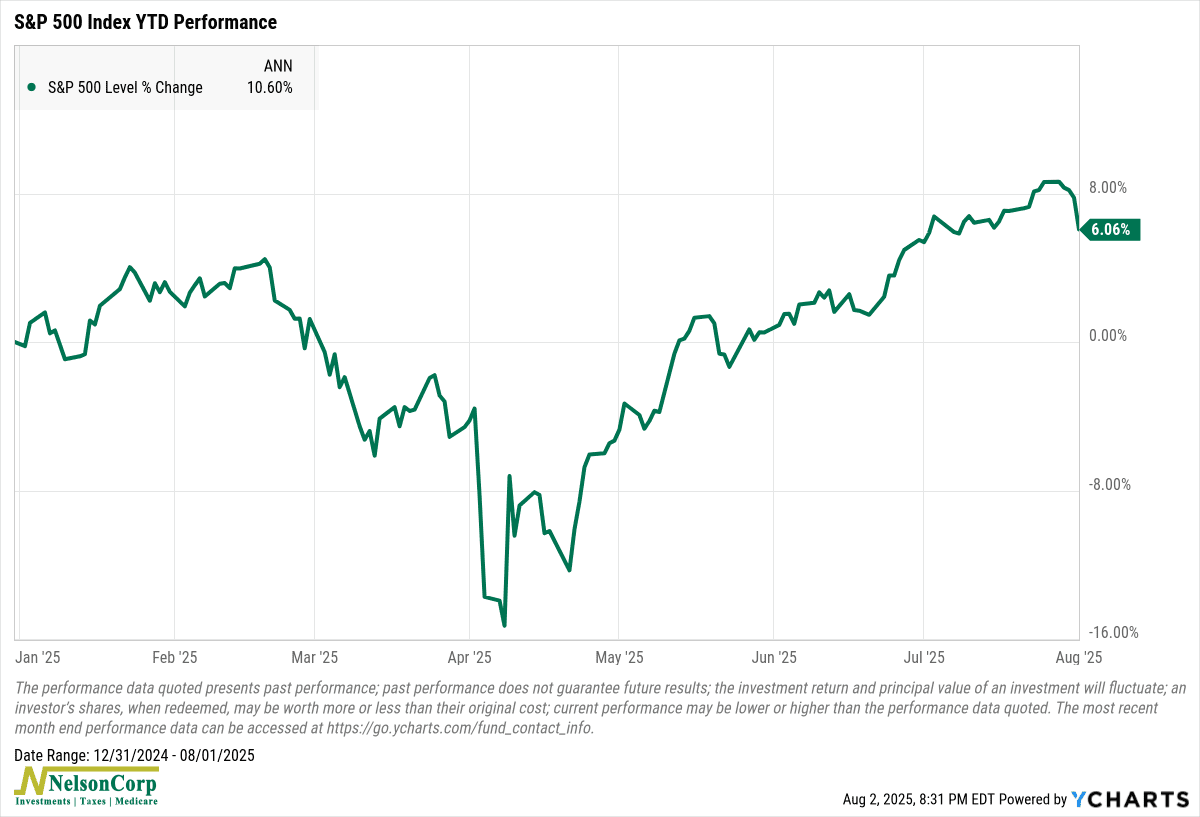
For an investor asking “how is S&P doing today,” access to real-time, reliable information is paramount. Fortunately, a wealth of tools and resources exists to track the index’s performance.
Real-Time Data Platforms
Numerous financial websites and brokerage platforms offer real-time or near-real-time data on the S&P 500. Reputable sources like Bloomberg, Reuters, Yahoo Finance, Google Finance, and the websites of major financial news outlets (e.g., The Wall Street Journal, CNBC, MarketWatch) provide live tickers, interactive charts, and historical data. These platforms allow users to see the current index value, its percentage change for the day, its high and low points, and often breakdown by sector or individual constituent performance. Many also offer customizable watchlists to monitor the S&P 500 alongside other key indices and individual stocks.
Financial News Outlets and Expert Commentary
Staying informed involves more than just looking at numbers; it requires understanding the “why” behind the movements. Major financial news channels (CNBC, Fox Business) and publications (The Wall Street Journal, Financial Times, Bloomberg) provide continuous coverage, expert analysis, and interviews with market strategists and economists. These sources offer context to the day’s market movements, explaining which economic reports, corporate news, or geopolitical events are driving the S&P 500’s performance. Subscribing to their newsletters or following their live blogs can provide timely updates and insights.
Understanding Market Hours and Data Delays
It’s important to remember that the S&P 500 primarily reflects the trading activity of U.S. stock exchanges (NYSE and Nasdaq), which typically operate from 9:30 AM to 4:00 PM Eastern Time on weekdays. While futures contracts on the S&P 500 trade almost 24 hours a day and can offer an indication of how the market might open, the official index value is based on these regular market hours. Some free data sources may have a 15-20 minute delay, so for truly real-time information, often a premium subscription or a brokerage account with live data feed is necessary. After-hours trading of individual stocks can also influence next day’s opening, adding another layer of complexity.
Interpreting Today’s Movement: Short-Term Volatility vs. Long-Term Strategy
Observing the S&P 500’s daily performance can be thrilling or nerve-wracking, but it’s crucial to put these movements into perspective.
The Impact of Daily Swings on Investors
A single day’s movement, whether up or down, rarely dictates an investor’s long-term financial success. While a significant daily drop might trigger anxiety, and a surge might induce euphoria, these short-term fluctuations are a natural part of market dynamics. Day traders might try to profit from these hourly or daily swings, but for most long-term investors, reacting impulsively to daily news can be detrimental. Over-trading based on short-term noise often leads to higher transaction costs and can disrupt a well-thought-out investment strategy.
The Importance of a Long-Term Perspective
Historically, the S&P 500 has demonstrated a powerful upward trend over extended periods, despite numerous corrections, bear markets, and crises. This resilience underscores the importance of a long-term investment horizon. Investors who maintain a diversified portfolio and resist the urge to sell during downturns are often rewarded as the market inevitably recovers and continues its upward trajectory driven by corporate innovation and economic growth. Focusing on the long-term allows investors to ride out the daily, weekly, or even monthly volatility and benefit from compounding returns.
Diversification and Risk Management in Volatile Markets
Regardless of the S&P 500’s daily performance, sound investment principles remain constant. Diversification across different asset classes (stocks, bonds, real estate), geographies, and sectors within the S&P 500 itself can help mitigate risk. A diversified portfolio is less susceptible to the poor performance of any single stock or sector. Additionally, regular rebalancing, dollar-cost averaging (investing a fixed amount regularly), and maintaining a clear investment plan based on one’s risk tolerance and financial goals are essential strategies for navigating the inherent volatility of the stock market.
Looking Ahead: What Drives the S&P 500’s Future Trajectory?
While today’s S&P 500 performance is a snapshot, its future trajectory is shaped by ongoing developments and expectations.
Anticipating Economic Growth and Inflation Trends
The forward path of the S&P 500 will largely be determined by the outlook for economic growth and inflation. Strong, sustainable economic expansion tends to foster higher corporate earnings and investor confidence. Conversely, persistent inflation can erode purchasing power and corporate margins, potentially leading central banks to tighten monetary policy, which can be a headwind for stock valuations. Investors continually weigh these factors, and any shifts in expectations can prompt significant market revaluations.
Corporate Innovation and Sectoral Evolution
The S&P 500’s composition is not static; it evolves as companies grow, merge, or decline. Future growth will be significantly driven by innovation across various sectors, particularly in technology, biotechnology, and sustainable energy. Companies that successfully adapt to changing consumer demands, leverage cutting-edge technologies, and expand into new markets will likely lead the index higher. Conversely, sectors and companies failing to innovate or facing structural headwinds may see their influence wane.

The Role of Investor Confidence
Ultimately, the market is a reflection of collective investor confidence. Factors like political stability, regulatory environment, and the overall narrative surrounding economic prospects play a crucial role in shaping this confidence. A stable and predictable environment generally encourages investment, while uncertainty can lead to caution and capital flight. As such, monitoring broader sentiment indicators and understanding the psychological aspects of market behavior remains vital for anticipating the S&P 500’s direction.
In conclusion, “how the S&P 500 is doing today” is a question with a multi-faceted answer. It’s a blend of immediate market reactions to news, underlying economic fundamentals, and long-term strategic positioning by investors. While daily fluctuations demand attention, a truly insightful understanding comes from appreciating the index’s role as a broad economic indicator, the complex interplay of forces that drive its movements, and the enduring importance of a disciplined, long-term investment approach.
aViewFromTheCave is a participant in the Amazon Services LLC Associates Program, an affiliate advertising program designed to provide a means for sites to earn advertising fees by advertising and linking to Amazon.com. Amazon, the Amazon logo, AmazonSupply, and the AmazonSupply logo are trademarks of Amazon.com, Inc. or its affiliates. As an Amazon Associate we earn affiliate commissions from qualifying purchases.