
The daily closing bell of the New York Stock Exchange and the Nasdaq is more than just a ceremonial signal; it represents the final consensus on the value of the world’s most influential companies. When an investor asks, “What did stocks close at today?” they are rarely looking for a single number. Instead, they are seeking a snapshot of global economic health, investor sentiment, and the relative strength of their own financial portfolios. The closing price is the official benchmark used by mutual funds to calculate Net Asset Value (NAV), by margin departments to determine collateral requirements, and by technical analysts to project future price movements.
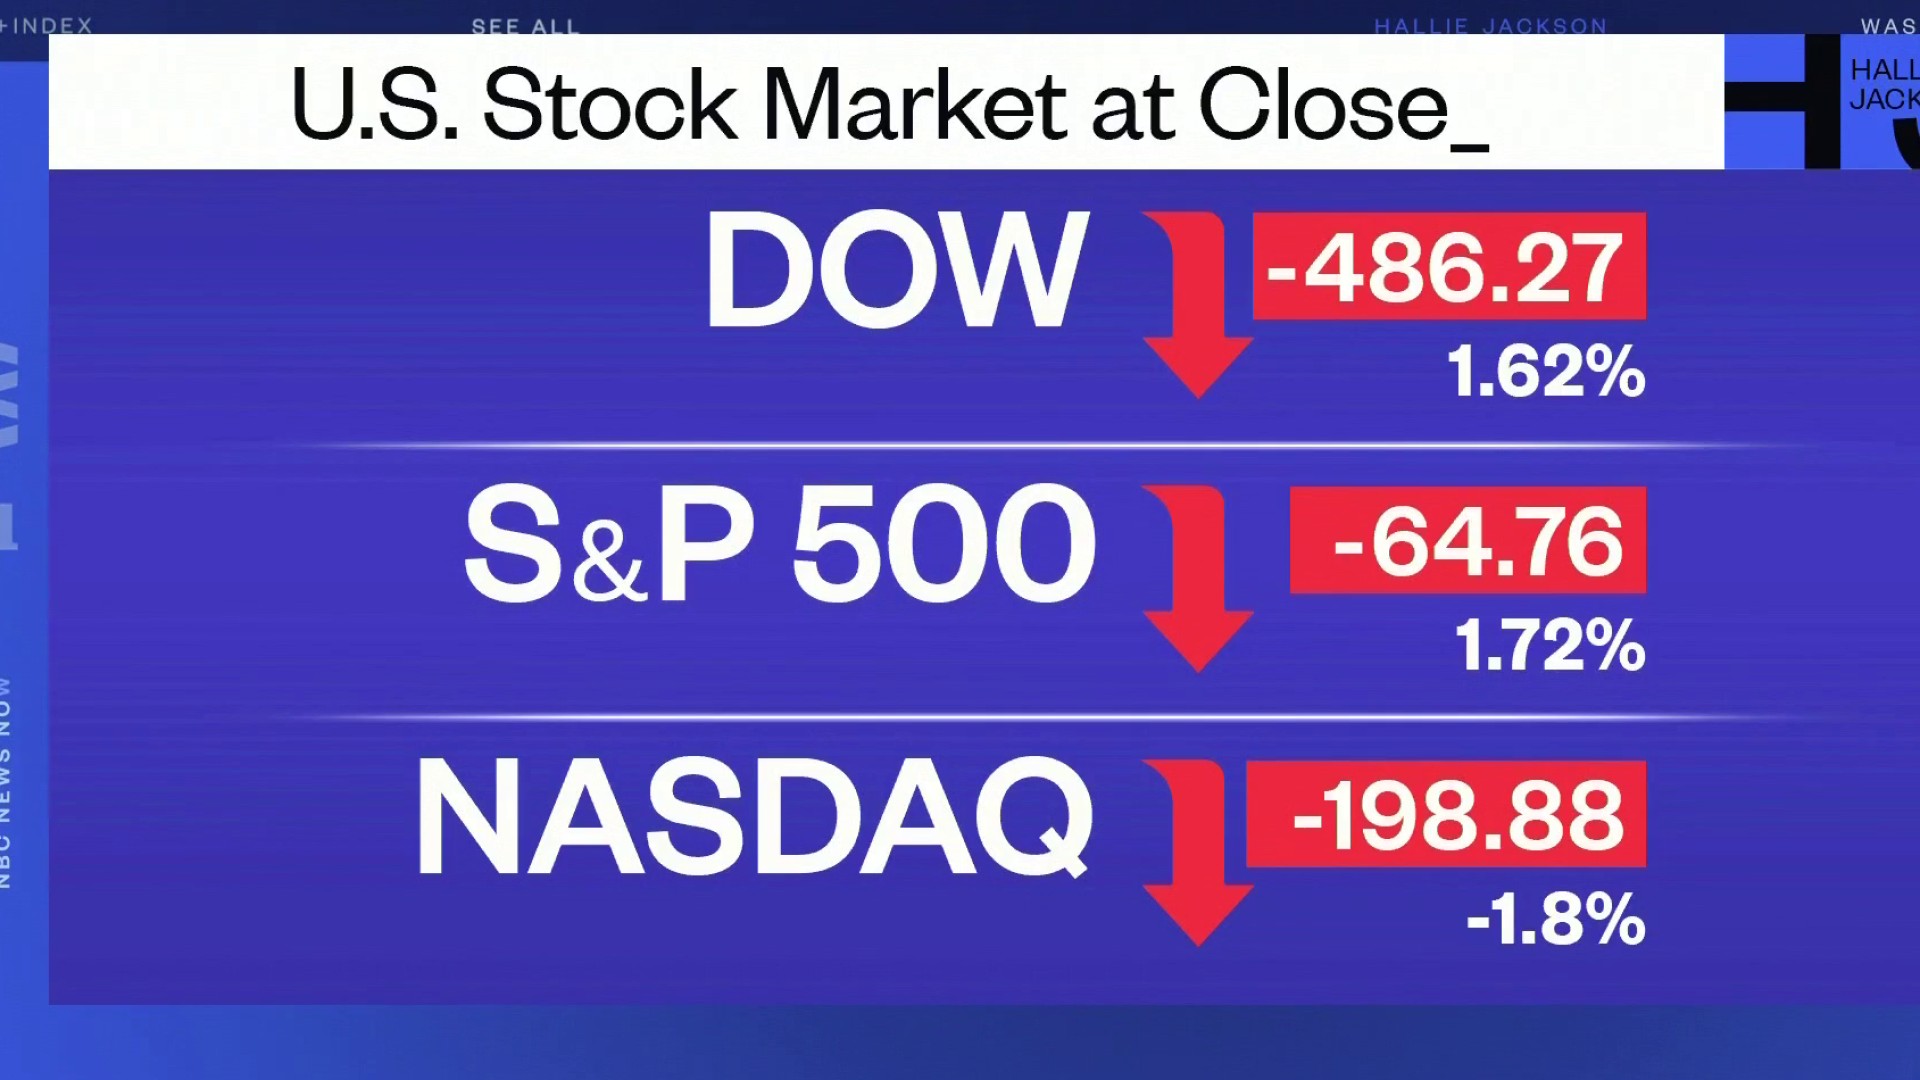
Understanding the closing price requires looking beyond the digits on a screen. It involves dissecting the indices that track market movement, the technical mechanisms that determine the final price, and the psychological weight that the financial community places on the final minutes of the trading day.
The Daily Pulse: Why the Closing Bell Matters
The significance of the market close is rooted in its role as a point of stabilization. Throughout the trading session, prices fluctuate based on real-time news, algorithmic trading, and individual liquidity needs. However, the closing price represents the most liquidity-rich environment of the day, where institutional buyers and sellers aggregate their interests to find a definitive equilibrium.
The Psychology of the Close
For many retail investors and institutional fund managers alike, the close is the “final word.” Professional traders often look at where a stock closes relative to its daily range. If a stock closes at the top of its daily range, it suggests strong “buying into the close,” indicating that investors are comfortable holding the position overnight. Conversely, a weak close near the daily lows often signals that participants are eager to exit positions before the market shuts, potentially leading to continued downward pressure the following morning. This collective psychology creates trends that can last for days or weeks.
Closing Price vs. Last Traded Price
It is a common misconception that the closing price is simply the very last trade executed before 4:00 PM Eastern Time. In reality, the major exchanges utilize a sophisticated “Closing Auction” process. This auction consolidates all buy and sell interest into a single price that maximizes the number of shares traded. This ensures that the closing price is a fair representation of the market’s aggregate demand, rather than a “stray” trade that might have occurred at an outlier price due to low liquidity in the final seconds.
Key Indicators to Watch Every Afternoon
When checking what stocks closed at, most market participants look toward three primary benchmarks. Each of these indices tells a different story about the economy and the specific sectors driving growth or contraction.
The S&P 500: The Broader Market Benchmark
The Standard & Poor’s 500 is widely considered the most accurate reflection of the U.S. stock market. Because it is market-cap weighted, its closing level is heavily influenced by the largest companies in the world, particularly in the technology and healthcare sectors. When the S&P 500 closes higher, it generally indicates that the core of the American corporate engine is humming. Investors use this index to gauge the “beta” or risk level of their diversified portfolios.
The Dow Jones Industrial Average: The Blue-Chip Pulse
The Dow is the oldest and perhaps most famous index, consisting of 30 “blue-chip” companies. Unlike the S&P 500, the Dow is price-weighted, meaning stocks with higher share prices have a greater impact on the index’s closing value. While some critics argue it is too narrow to represent the modern economy, the Dow remains a vital indicator of industrial strength and consumer stability. A strong close in the Dow often suggests that value-oriented, dividend-paying companies are in favor.
The Nasdaq Composite: A Tech-Heavy Sentiment Gauge
If you want to know how growth and innovation are performing, you look at the Nasdaq close. Dominated by technology, biotechnology, and internet companies, the Nasdaq is highly sensitive to interest rate changes and future growth projections. A sharp decline in the Nasdaq close, even if the Dow remains stable, often signals that investors are de-risking and moving away from speculative or high-multiple stocks.
Behind the Scenes: The Closing Auction and Price Discovery

The final minutes of the trading day, often referred to as “the witching hour” during certain periods, are characterized by intense activity. This is when institutional “rebalancing” occurs—where large pension funds and ETFs adjust their holdings to match their target allocations.
MOC and LOC Orders
To manage this massive volume, the exchanges use specific order types. Market-on-Close (MOC) and Limit-on-Close (LOC) orders are designed to be executed specifically at the closing price. These orders must be submitted by a certain cutoff time (usually 3:50 PM ET) to ensure an orderly auction. The transparent “imbalance” data—showing whether there are more buyers or sellers going into the close—helps traders understand which direction the final price is likely to lean.
Institutional Influence on the Final Minutes
Institutions often wait until the end of the day to execute large blocks of shares. By doing so, they can participate in the deepest liquidity pool of the day, minimizing the “slippage” or price impact their large orders might otherwise cause. This concentration of institutional activity makes the closing price the most “honest” price of the day, as it reflects the heavy-handed decisions of the world’s largest capital allocators rather than the noise of day traders.
Interpreting Today’s Close: Context Over Raw Numbers
Knowing that the market closed up 1% is only the first step. To truly understand what happened, an investor must look at the internals of the day’s performance.
Volume and Volatility
A market that closes higher on low trading volume is often viewed with skepticism. It suggests a lack of conviction among major players. However, a “breakout” close on high volume is a powerful technical signal that a new trend is being established. Similarly, high volatility leading into the close indicates a tug-of-war between bulls and bears, often setting the stage for a volatile opening the next day.
Sector Rotation and Breadth
Market breadth refers to how many individual stocks participated in the day’s move. If the S&P 500 closes at a record high, but only five or six massive tech stocks were actually up while the rest of the market languished, the “health” of the rally is considered poor. Conversely, a broad-based rally where small-cap, mid-cap, and large-cap stocks all close higher suggests a robust and sustainable economic outlook. Observing which sectors led the close—such as Energy, Financials, or Tech—provides clues into where the “smart money” is moving.
Actionable Strategies for Navigating Post-Close Realities
The 4:00 PM bell may stop regular trading, but the financial world does not sleep. Investors must know how to handle the information they receive at the close to make better decisions for the future.
After-Hours Trading Risks
Immediately following the close, “After-Hours” trading begins. This session is characterized by much lower liquidity and wider spreads between buy and sell prices. While it allows investors to react to earnings reports or late-breaking news, it can be a trap for the unwary. Prices in the after-hours session can be wildly different from the official close, but they often lack the volume to be truly representative of where the market will open the next day.
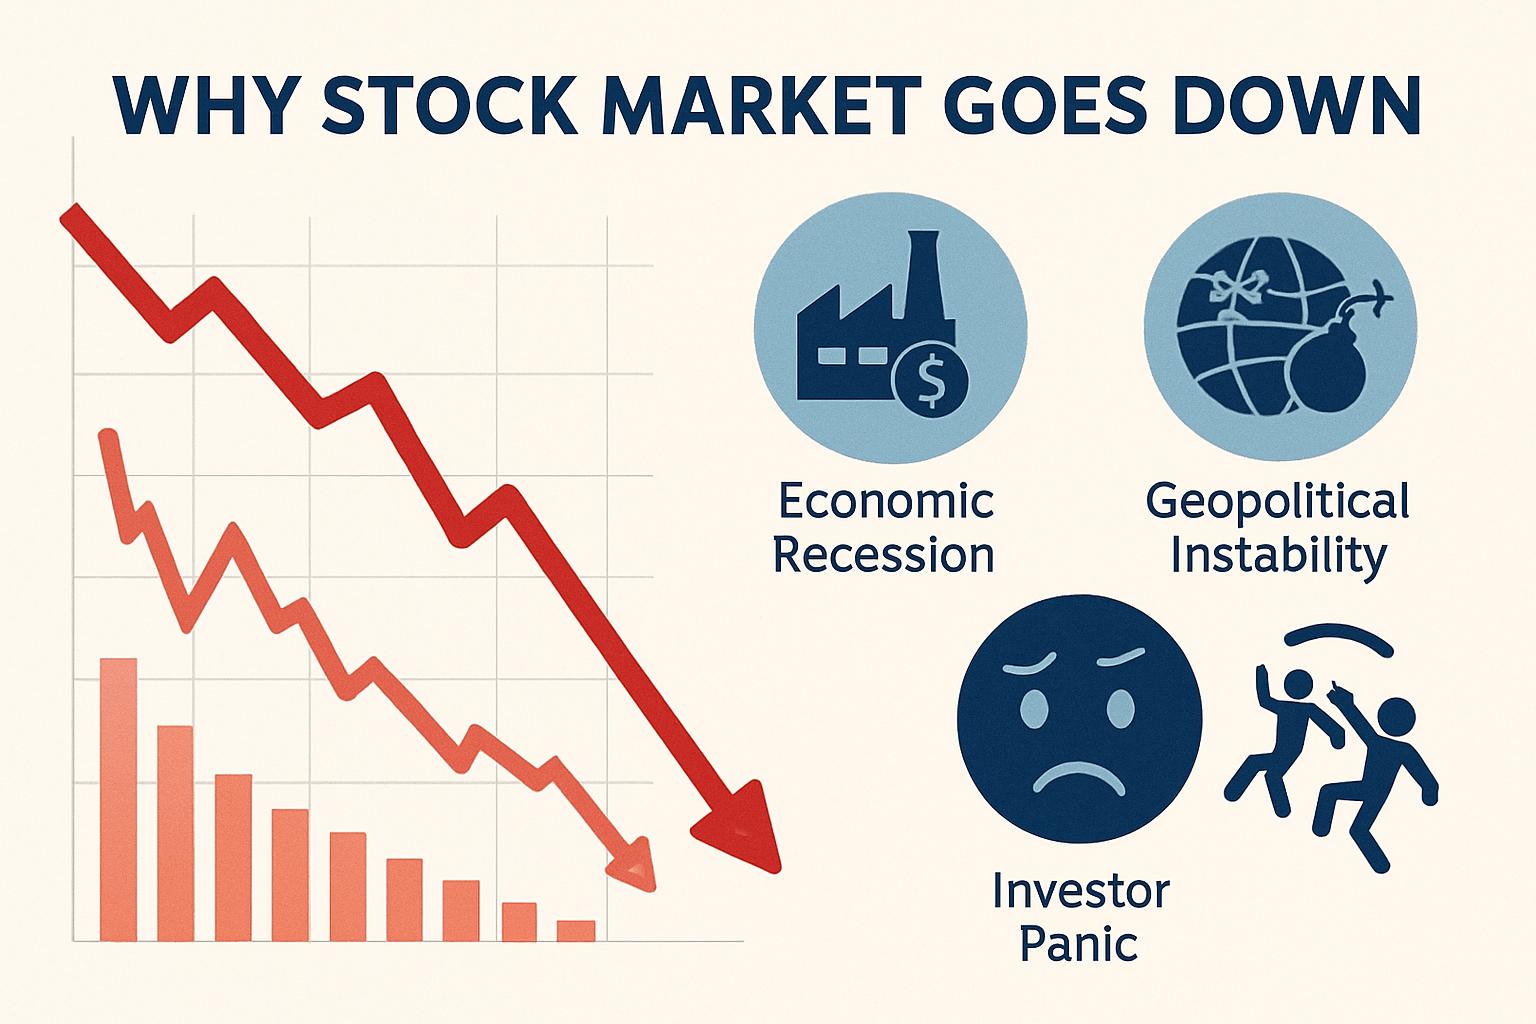
Preparing for the Next Open
Smart investors use the closing data to build their “watchlists” for the following morning. If a stock closed with significant momentum and positive news, it may “gap up” (open higher) the next day. By analyzing the closing levels relative to key moving averages (like the 50-day or 200-day average), investors can identify support and resistance levels. The close is not just an ending; it is the data set used to program the algorithms and strategies that will dictate the next day’s opening drive.
In summary, when you ask “what did stocks close at today,” you are checking the pulse of a complex, global system. By focusing on the closing auction mechanics, index benchmarks, and market breadth, you gain a professional edge in understanding not just where the price ended, but where it might be headed next. The close is the ultimate consensus, and in the world of finance, consensus is the foundation of value.
aViewFromTheCave is a participant in the Amazon Services LLC Associates Program, an affiliate advertising program designed to provide a means for sites to earn advertising fees by advertising and linking to Amazon.com. Amazon, the Amazon logo, AmazonSupply, and the AmazonSupply logo are trademarks of Amazon.com, Inc. or its affiliates. As an Amazon Associate we earn affiliate commissions from qualifying purchases.