
In the world of finance, few names are mentioned with as much frequency and gravitas as the “Dow” and the “Nasdaq.” For the seasoned investor, these terms are the shorthand of daily life, representing the pulse of the global economy. For the novice, however, they often appear as abstract numbers flashing across a television screen or a news ticker. Understanding what the Dow Jones Industrial Average and the Nasdaq Composite actually represent is fundamental to navigating the modern financial landscape. These indices are more than just numbers; they are sophisticated tools used to measure the performance of specific segments of the stock market, reflecting broader economic health, investor sentiment, and technological evolution.

Decoding the Dow Jones Industrial Average (DJIA)
The Dow Jones Industrial Average, often referred to simply as “the Dow,” is one of the oldest and most recognized stock market indices in the world. Founded by Charles Dow and Edward Jones in 1896, it was originally designed to track the performance of the industrial sector of the American economy. At its inception, it consisted of just 12 companies, primarily in the heavy industry, railroad, and energy sectors. Today, it has evolved into a list of 30 “blue-chip” companies—large, publicly owned firms based in the United States that are considered leaders in their respective industries.
The Composition of the Dow
Despite its name, the Dow is no longer strictly “industrial.” Its components span various sectors, including technology, healthcare, finance, and consumer goods. Companies like Microsoft, Apple, UnitedHealth Group, and Goldman Sachs are modern staples of the index. The selection process is unique; unlike many other indices, the Dow is not governed by a strict quantitative formula. Instead, it is managed by a committee at S&P Dow Jones Indices. The goal is to maintain a list that reflects the broader U.S. economy, selecting companies with excellent reputations and sustained growth.
The Methodology: Price-Weighted Indexing
The Dow is a price-weighted index, a methodology that is often the subject of debate among economists. In a price-weighted system, the value of the index is determined by the share price of the individual stocks, rather than the total market value of the companies. For example, a company with a share price of $200 has twice as much influence on the index’s movement as a company with a share price of $100, regardless of the relative sizes of the two companies.
To ensure the index remains consistent over time—accounting for stock splits, spin-offs, and other corporate actions—the sum of the 30 stock prices is divided by a mathematical constant known as the “Dow Divisor.” This divisor is updated periodically to ensure that structural changes in individual companies do not cause artificial jumps or drops in the overall index value.
Understanding the Nasdaq: Composite vs. Nasdaq 100
While the Dow represents the established giants of industry, the Nasdaq is synonymous with innovation, technology, and the digital age. It is important to distinguish between the Nasdaq as a stock exchange and the Nasdaq as an index. The Nasdaq Stock Market was the world’s first electronic stock market, launched in 1971. Today, when people talk about “how the Nasdaq performed,” they are usually referring to the Nasdaq Composite Index.
The Nasdaq Composite Index
The Nasdaq Composite includes almost all stocks listed on the Nasdaq Stock Market—more than 3,000 companies. This index is heavily weighted toward the technology sector, but it also includes significant representation from the biotechnology, retail, and financial sectors. Because of its broad base and tech-heavy nature, the Nasdaq Composite is often viewed as a barometer for the health of the “new economy” and growth-oriented stocks.
The Nasdaq 100: The Tech Elite
A frequent point of confusion for investors is the difference between the Composite and the Nasdaq 100. The Nasdaq 100 is a subset of the Composite, tracking the 100 largest non-financial companies listed on the Nasdaq exchange. This index includes the “Magnificent Seven” and other massive tech players. Because it excludes the banking and financial sector, the Nasdaq 100 is a more concentrated measure of high-growth, innovative industries.
Methodology: Market Capitalization Weighting
Unlike the Dow, the Nasdaq indices use a market-capitalization-weighted methodology. In this system, companies are weighted according to their total market value (share price multiplied by the number of outstanding shares). This means that a giant like Microsoft or Amazon has a significantly larger impact on the index’s movement than a mid-sized tech firm. Most modern investors and economists prefer this method, as it more accurately reflects the actual economic impact of a company’s growth or decline.
Crucial Differences: Comparing the Giants
To use these indices effectively in a financial strategy, one must understand how they differ in scope, risk, and representation. While they often move in the same general direction, their magnitude of movement can vary wildly depending on the economic climate.
Sector Concentration and Volatility
The Dow is often considered more stable and conservative. Because it consists of 30 established, dividend-paying companies, it tends to be less volatile during periods of market turbulence. However, it can also lag behind during periods of rapid technological expansion.
The Nasdaq, conversely, is highly concentrated in the technology and growth sectors. This concentration makes it more volatile; it often sees higher gains during bull markets but deeper losses during bear markets or periods of rising interest rates. Because many tech companies rely on future growth and borrowing, they are particularly sensitive to changes in Federal Reserve policy.
Breadth and Representation
The Dow is a narrow “snapshot” of the market. With only 30 companies, it is a focused look at the institutional heavyweights of American business. The Nasdaq Composite, with thousands of companies, offers a much broader view of the market, including small-cap and mid-cap companies that are in their early stages of growth. If you want to know how the “big players” are doing, you look at the Dow. If you want to know how the technology sector and growth stocks are performing, you look at the Nasdaq.
How to Use These Indices in Your Investment Strategy
For the individual investor, the Dow and Nasdaq serve two primary purposes: as benchmarks for performance and as vehicles for investment.
Benchmarking Your Portfolio
If you have a diversified portfolio, you likely compare your returns against these indices. If your investments are primarily in blue-chip stocks and value-oriented mutual funds, the Dow is your natural benchmark. If you are a growth-oriented investor with a heavy focus on tech, AI, and software, you should be comparing your performance against the Nasdaq. Understanding which index aligns with your strategy helps you determine if your individual stock picks are truly outperforming the market or simply riding a broader trend.
Investing via Index Funds and ETFs
You cannot “buy” the Dow or the Nasdaq directly, as they are mathematical constructs. However, you can invest in exchange-traded funds (ETFs) or mutual funds that track these indices.
-
The SPDR Dow Jones Industrial Average ETF Trust (DIA): Often called “Diamonds,” this ETF mirrors the performance of the 30 Dow components.
-
Invesco QQQ Trust (QQQ): This is one of the most popular ETFs in the world, tracking the Nasdaq 100. It provides investors with exposure to the 100 largest non-financial tech leaders.
Using these tools allows investors to gain instant diversification without having to purchase dozens or hundreds of individual stocks. It is a cornerstone of passive investing, a strategy that seeks to match the market’s returns rather than beat them.
The Broader Economic Significance of Market Tracking
Beyond personal gain, the Dow and Nasdaq are vital indicators of the global economic climate. They act as a feedback loop for government policy, corporate health, and consumer confidence.
Sentiment and Confidence
When the Dow hits an “all-time high,” it creates a psychological “wealth effect.” Consumers who see their 401(k)s and brokerage accounts growing are more likely to spend money, which in turn fuels corporate earnings. Conversely, a sharp drop in the Nasdaq can signal a “risk-off” environment, where investors pull money out of growth assets in anticipation of a recession or higher interest rates.
Global Interconnectedness
While both indices are American, they represent global interests. The companies within the Dow and Nasdaq earn a significant portion of their revenue from international markets. Therefore, a slowdown in the European or Asian markets will eventually manifest in the performance of these indices. They are essentially a thermometer for global capitalism.
The Role of Innovation
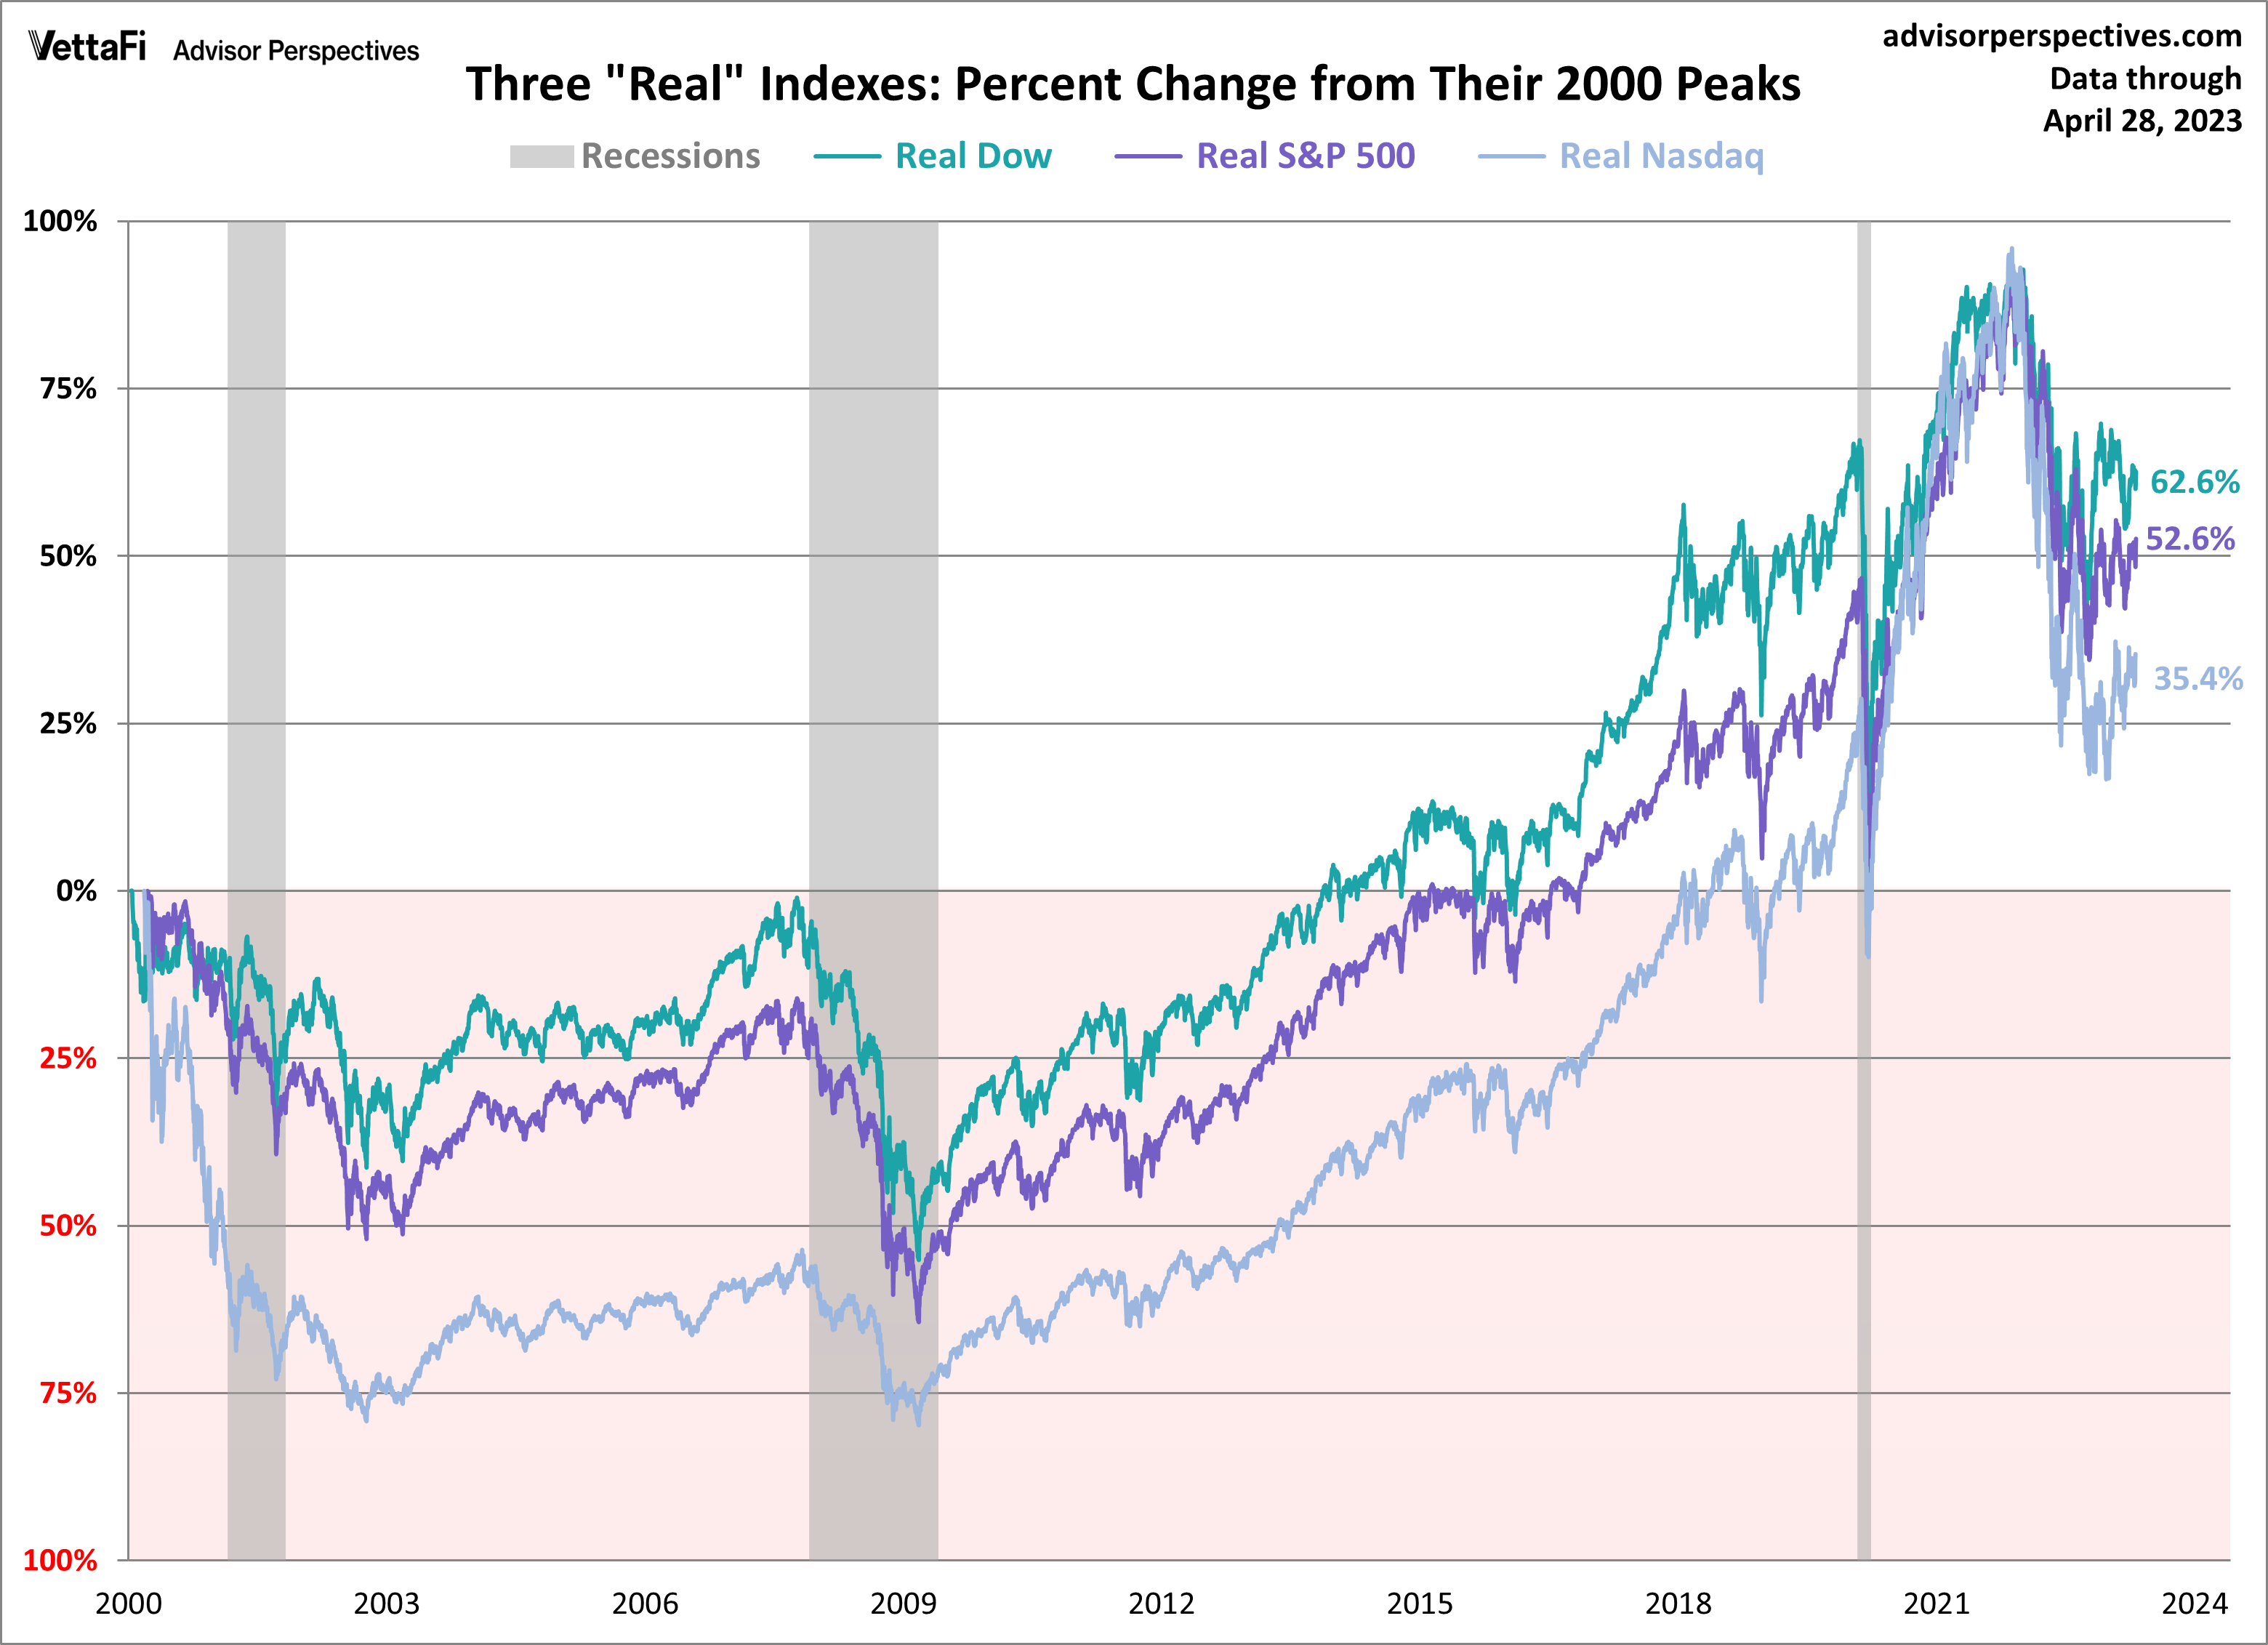
The Nasdaq’s rise over the last three decades highlights the shift from a manufacturing-based economy to an information-based one. By watching the divergence between the Dow and the Nasdaq, analysts can see where capital is flowing. If the Nasdaq is rising while the Dow is flat, it suggests that investors are betting on future innovation rather than current industrial output.
In conclusion, the Dow and the Nasdaq are complementary tools. The Dow offers a look at the stability and history of the American corporate landscape, while the Nasdaq offers a window into the future of technology and growth. For any investor looking to build wealth and understand the complexities of the financial world, mastering the nuances of these two indices is an essential first step. By tracking their movements and understanding their methodologies, you can gain a clearer perspective on where the economy has been, where it is now, and where it is headed next.
aViewFromTheCave is a participant in the Amazon Services LLC Associates Program, an affiliate advertising program designed to provide a means for sites to earn advertising fees by advertising and linking to Amazon.com. Amazon, the Amazon logo, AmazonSupply, and the AmazonSupply logo are trademarks of Amazon.com, Inc. or its affiliates. As an Amazon Associate we earn affiliate commissions from qualifying purchases.