
The US stock market remains the primary engine of global finance, acting as a barometer for economic health and a vehicle for long-term wealth creation. To understand how the market is doing today, one must look beyond a single daily percentage change and instead examine the complex interplay of macroeconomic data, corporate earnings, and investor psychology. Currently, the US equity landscape is characterized by a fascinating tug-of-war between high-growth technology narratives and the gravity of a high-interest-rate environment.
Whether you are looking at the blue-chip stability of the Dow or the innovation-driven volatility of the Nasdaq, the “state of the market” is rarely a singular story. It is a mosaic of sectoral shifts and global influences. Navigating this environment requires a deep understanding of the indices, the catalysts driving them, and the underlying technical health of the financial system.
Decoding the Major Indices: S&P 500, Dow Jones, and Nasdaq Performance
To gauge how the market is doing, investors typically look to the three major benchmarks. Each represents a different slice of the American economy, and their divergence or convergence tells a significant story about where capital is moving.
The Role of the S&P 500 as the Broad Market Gauge
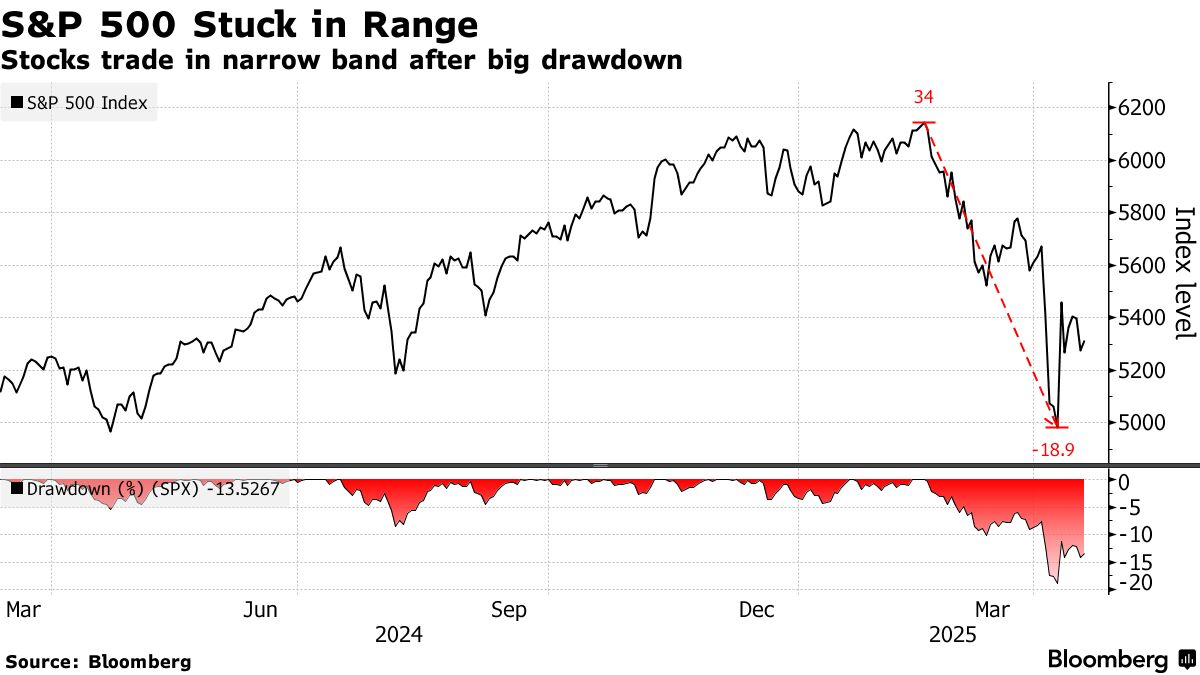
The S&P 500 is often considered the most accurate reflection of the overall US economy. Comprising 500 of the largest publicly traded companies, its performance is heavily influenced by market capitalization. In the current era, the S&P 500 has been heavily “top-heavy,” with a handful of massive technology firms driving a disproportionate amount of the index’s gains. When investors ask how the market is doing, they are usually asking about the S&P 500. Its current trajectory reflects a cautious optimism regarding a “soft landing”—a scenario where inflation cools without triggering a major recession.
The Tech-Heavy Nasdaq and Innovation Cycles
The Nasdaq Composite, and the Nasdaq 100 in particular, serves as the pulse of the growth and technology sectors. Today, the Nasdaq is largely driven by the “Magnificent Seven”—a group of tech giants that have pivoted their business models toward Artificial Intelligence (AI). Because growth stocks are sensitive to interest rates, the Nasdaq often experiences more significant swings than other indices. When the market is in a “risk-on” mode, the Nasdaq leads the charge. Conversely, any signal that interest rates will stay “higher for longer” tends to put pressure on these high-valuation stocks.
The Dow Jones Industrial Average: A Look at Blue-Chip Stability
The Dow Jones Industrial Average (DJIA) provides a different perspective by focusing on 30 established, “blue-chip” companies. Unlike the S&P 500, the Dow is price-weighted, meaning stocks with higher share prices have more influence. In periods of market uncertainty, the Dow often outperforms the Nasdaq as investors seek safety in dividends and established cash flows. Monitoring the Dow allows investors to see how the “Old Economy”—sectors like manufacturing, banking, and traditional retail—is weathering current economic headwinds.
Macroeconomic Catalysts Shaping Market Sentiment
The stock market does not operate in a vacuum. Today’s market performance is inextricably linked to the Federal Reserve’s monetary policy and the broader health of the American consumer.
Federal Reserve Policy and Interest Rate Projections
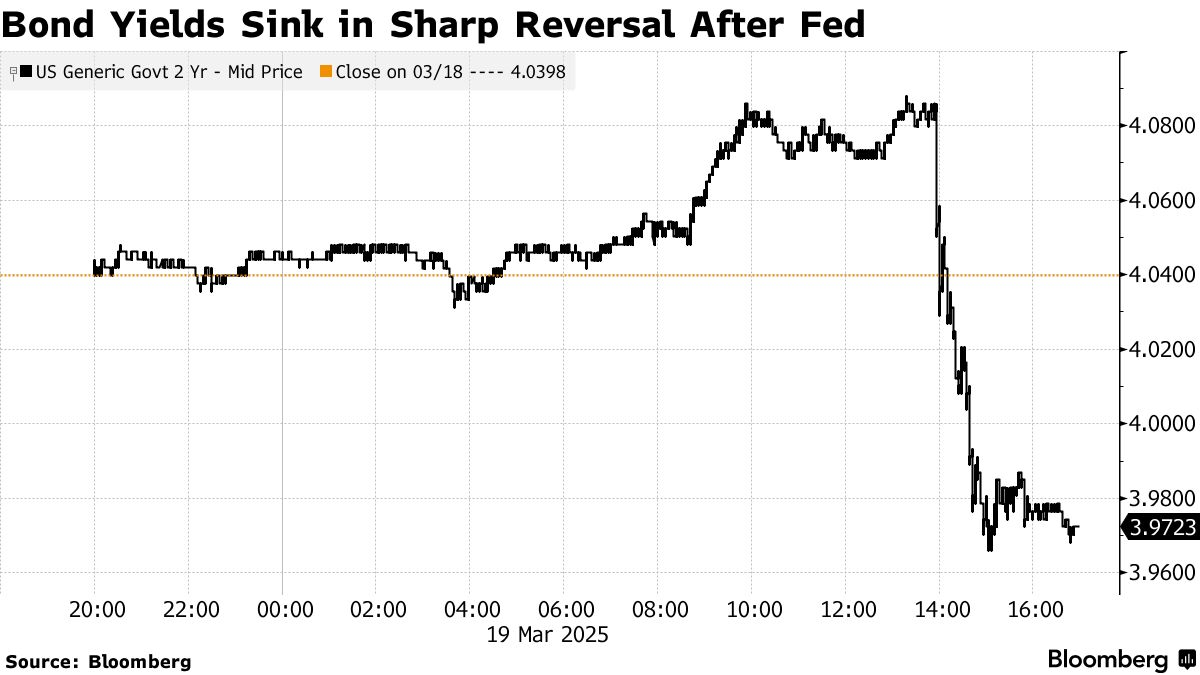
The single most influential factor in today’s market is the Federal Reserve. After a period of aggressive rate hikes to combat inflation, the market is now obsessed with the “pivot”—the point at which the Fed begins to lower rates. Every speech by Fed officials is scrutinized for clues. When the Fed indicates a dovish stance (leaning toward lower rates), stocks generally rally because lower borrowing costs boost corporate profits and make equities more attractive compared to bonds.
Inflation Data and Consumer Spending Power
Inflation, measured through the Consumer Price Index (CPI) and Personal Consumption Expenditures (PCE), remains a critical metric. The market’s current “mood” often depends on whether inflation is trending toward the Fed’s 2% target. If inflation data comes in “hotter” than expected, the market tends to sell off on fears of prolonged high rates. Furthermore, since the US economy is 70% driven by consumer spending, investors are keeping a close eye on retail sales and consumer confidence. As long as the consumer remains resilient, the market has a fundamental floor.
Employment Trends and Labor Market Resilience
A “Goldilocks” economy is one that is neither too hot (causing inflation) nor too cold (causing a recession). The monthly Non-Farm Payrolls report is a high-stakes event for the stock market. Strong job growth suggests that the economy is robust, which is good for corporate earnings. However, if the labor market is too strong, it could lead to wage-push inflation, prompting the Fed to keep rates high. The market currently favors a cooling, but stable, labor market that allows for a gradual easing of monetary policy.
Sector-Specific Performance: Where the Capital is Flowing
A “flat” day for the general indices can hide massive rotations happening beneath the surface. Understanding sector performance is key to identifying where the “smart money” is moving today.
The Artificial Intelligence Boom and Technology Stocks
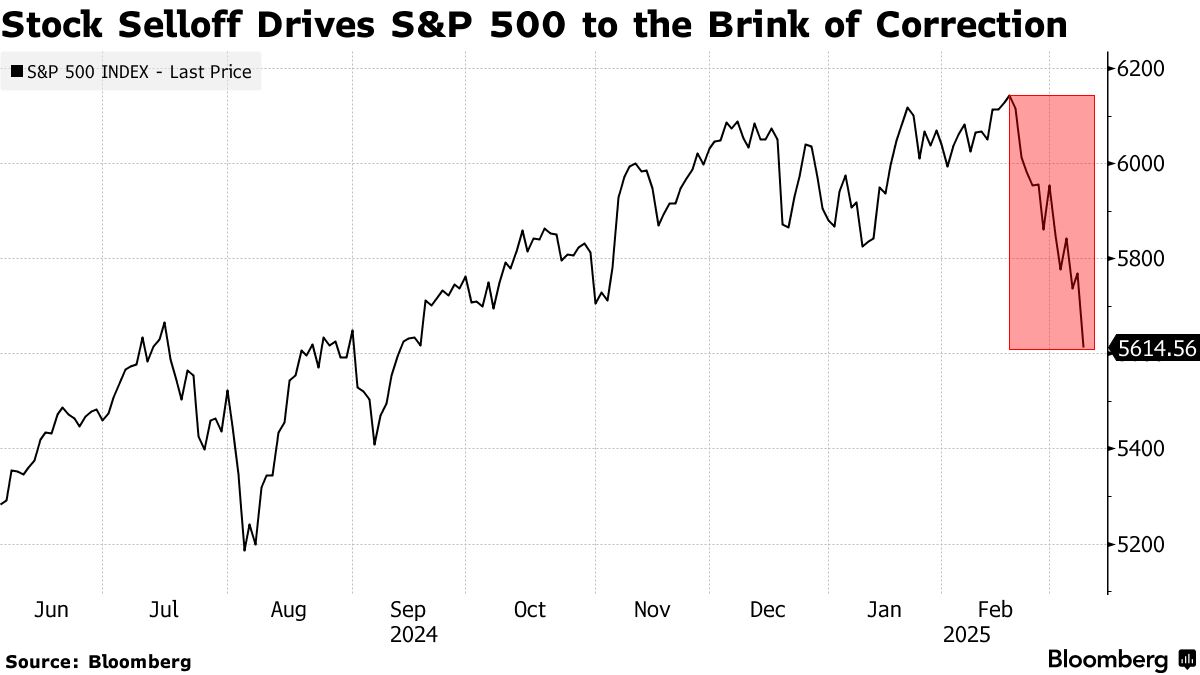
Technology remains the dominant theme in the modern market. The surge in generative AI has created a new industrial revolution in the eyes of many investors. This has led to massive capital inflows into semiconductor companies and cloud computing providers. However, this concentration also introduces risk. If the AI narrative faces a “reality check” regarding near-term monetization, the broader market could see a significant correction due to how much weight these companies carry in the indices.
Defensive vs. Cyclical Sectors: Healthcare, Energy, and Utilities
When the market expects a downturn, capital flows into defensive sectors like Healthcare and Utilities. These companies provide essential services that people need regardless of the economic climate, and they often pay reliable dividends. On the other hand, cyclical sectors like Consumer Discretionary and Industrials perform best when the market is optimistic about economic growth. Energy is a unique outlier, often moving based on geopolitical tensions and supply-demand dynamics in the oil and gas markets rather than domestic economic trends.
Financials and the Impact of Yield Curves
The banking sector is particularly sensitive to the “yield curve”—the difference between short-term and long-term interest rates. In a healthy market, long-term rates are higher than short-term rates. When the curve is inverted (short-term rates are higher), it often signals an impending recession, which can weigh heavily on bank stocks. Monitoring the Financial sector today provides insight into the health of the lending market and the stability of the broader financial infrastructure.
Technical Indicators and Market Psychology
Beyond fundamentals, the technical health of the market tells us about the “how” and “when” of price movements. Market psychology often creates self-fulfilling prophecies through technical levels.
Volatility Measures and the VIX Index
The CBOE Volatility Index, or VIX, is often called the “fear gauge.” When the VIX is low, it suggests investor complacency and a steady market. When the VIX spikes, it indicates panic and a “sell-first, ask-questions-later” mentality. Observing the VIX today helps traders understand whether the current market movement is a structural shift or a temporary emotional reaction to news.
Moving Averages and Support Levels
Institutional investors often look at moving averages—such as the 50-day and 200-day lines—to determine the market’s trend. If the S&P 500 is trading above its 200-day moving average, the long-term trend is considered bullish. If it breaks below, it can trigger automated sell programs. These technical “support levels” act as floorboards for the market; as long as they hold, the bullish narrative remains intact.
Investor Sentiment and Contrarian Indicators
Sometimes, the market is doing “too well.” When sentiment surveys show that everyone is extremely bullish, contrarian investors begin to worry that there is no one left to buy, which often precedes a pullback. Conversely, extreme “blood in the streets” and high levels of bearishness often mark a market bottom. Keeping a pulse on retail sentiment versus institutional positioning provides a balanced view of market “froth.”
Strategic Outlook: Navigating Current Market Conditions
Understanding how the market is doing today is only useful if it informs a long-term strategy. The current environment requires a blend of opportunism and risk management.
Diversification in a High-Interest Rate Environment
In an era where cash and bonds finally offer meaningful yields, the “TINA” (There Is No Alternative to stocks) era is over. Investors today are diversifying more aggressively into fixed income and high-yield savings to balance equity risk. A diversified portfolio that spans different asset classes and sectors is the best defense against the “flash crashes” or sector rotations that characterize the modern, high-speed trading environment.
Long-Term Investing vs. Short-Term Fluctuations
Ultimately, how the market is doing today is often just “noise” for the long-term investor. Historically, the US stock market has trended upward over decades despite wars, pandemics, and financial crises. The key to success in today’s market is distinguishing between temporary volatility and permanent loss of capital. By focusing on fundamental business quality and maintaining a disciplined contribution schedule, investors can leverage market fluctuations to their advantage rather than being victimized by them.
In conclusion, the US stock market today is a high-performance machine navigating a landscape of shifting interest rates and technological breakthroughs. While the headline numbers offer a snapshot, the true story lies in the resilience of the consumer, the strategic moves of the Federal Reserve, and the transformative power of innovation. Staying informed and maintaining a balanced perspective is the only way to thrive in this ever-evolving financial ecosystem.
aViewFromTheCave is a participant in the Amazon Services LLC Associates Program, an affiliate advertising program designed to provide a means for sites to earn advertising fees by advertising and linking to Amazon.com. Amazon, the Amazon logo, AmazonSupply, and the AmazonSupply logo are trademarks of Amazon.com, Inc. or its affiliates. As an Amazon Associate we earn affiliate commissions from qualifying purchases.