
The sheer scale of The Home Depot’s physical presence in the United States is more than just a testament to the nation’s obsession with DIY home improvement; it is a masterclass in corporate financial strategy and logistical dominance. As of the most recent fiscal reporting cycles, Home Depot operates approximately 2,000 stores within the United States alone, out of a total global footprint of over 2,300 locations including Canada and Mexico. For investors, financial analysts, and business strategists, the specific number of stores is a secondary metric to the more vital question: how does this massive physical infrastructure translate into market-leading margins and shareholder value?
To understand the financial weight of Home Depot, one must look past the orange aprons and into the capital allocation strategies that have made it a cornerstone of the S&P 500. The company’s growth trajectory has shifted over the last decade from aggressive square-footage expansion to the optimization of existing assets, a move that has fundamentally altered its balance sheet and dividend reliability.
Quantifying the Empire: Current Store Statistics and Geographical Distribution
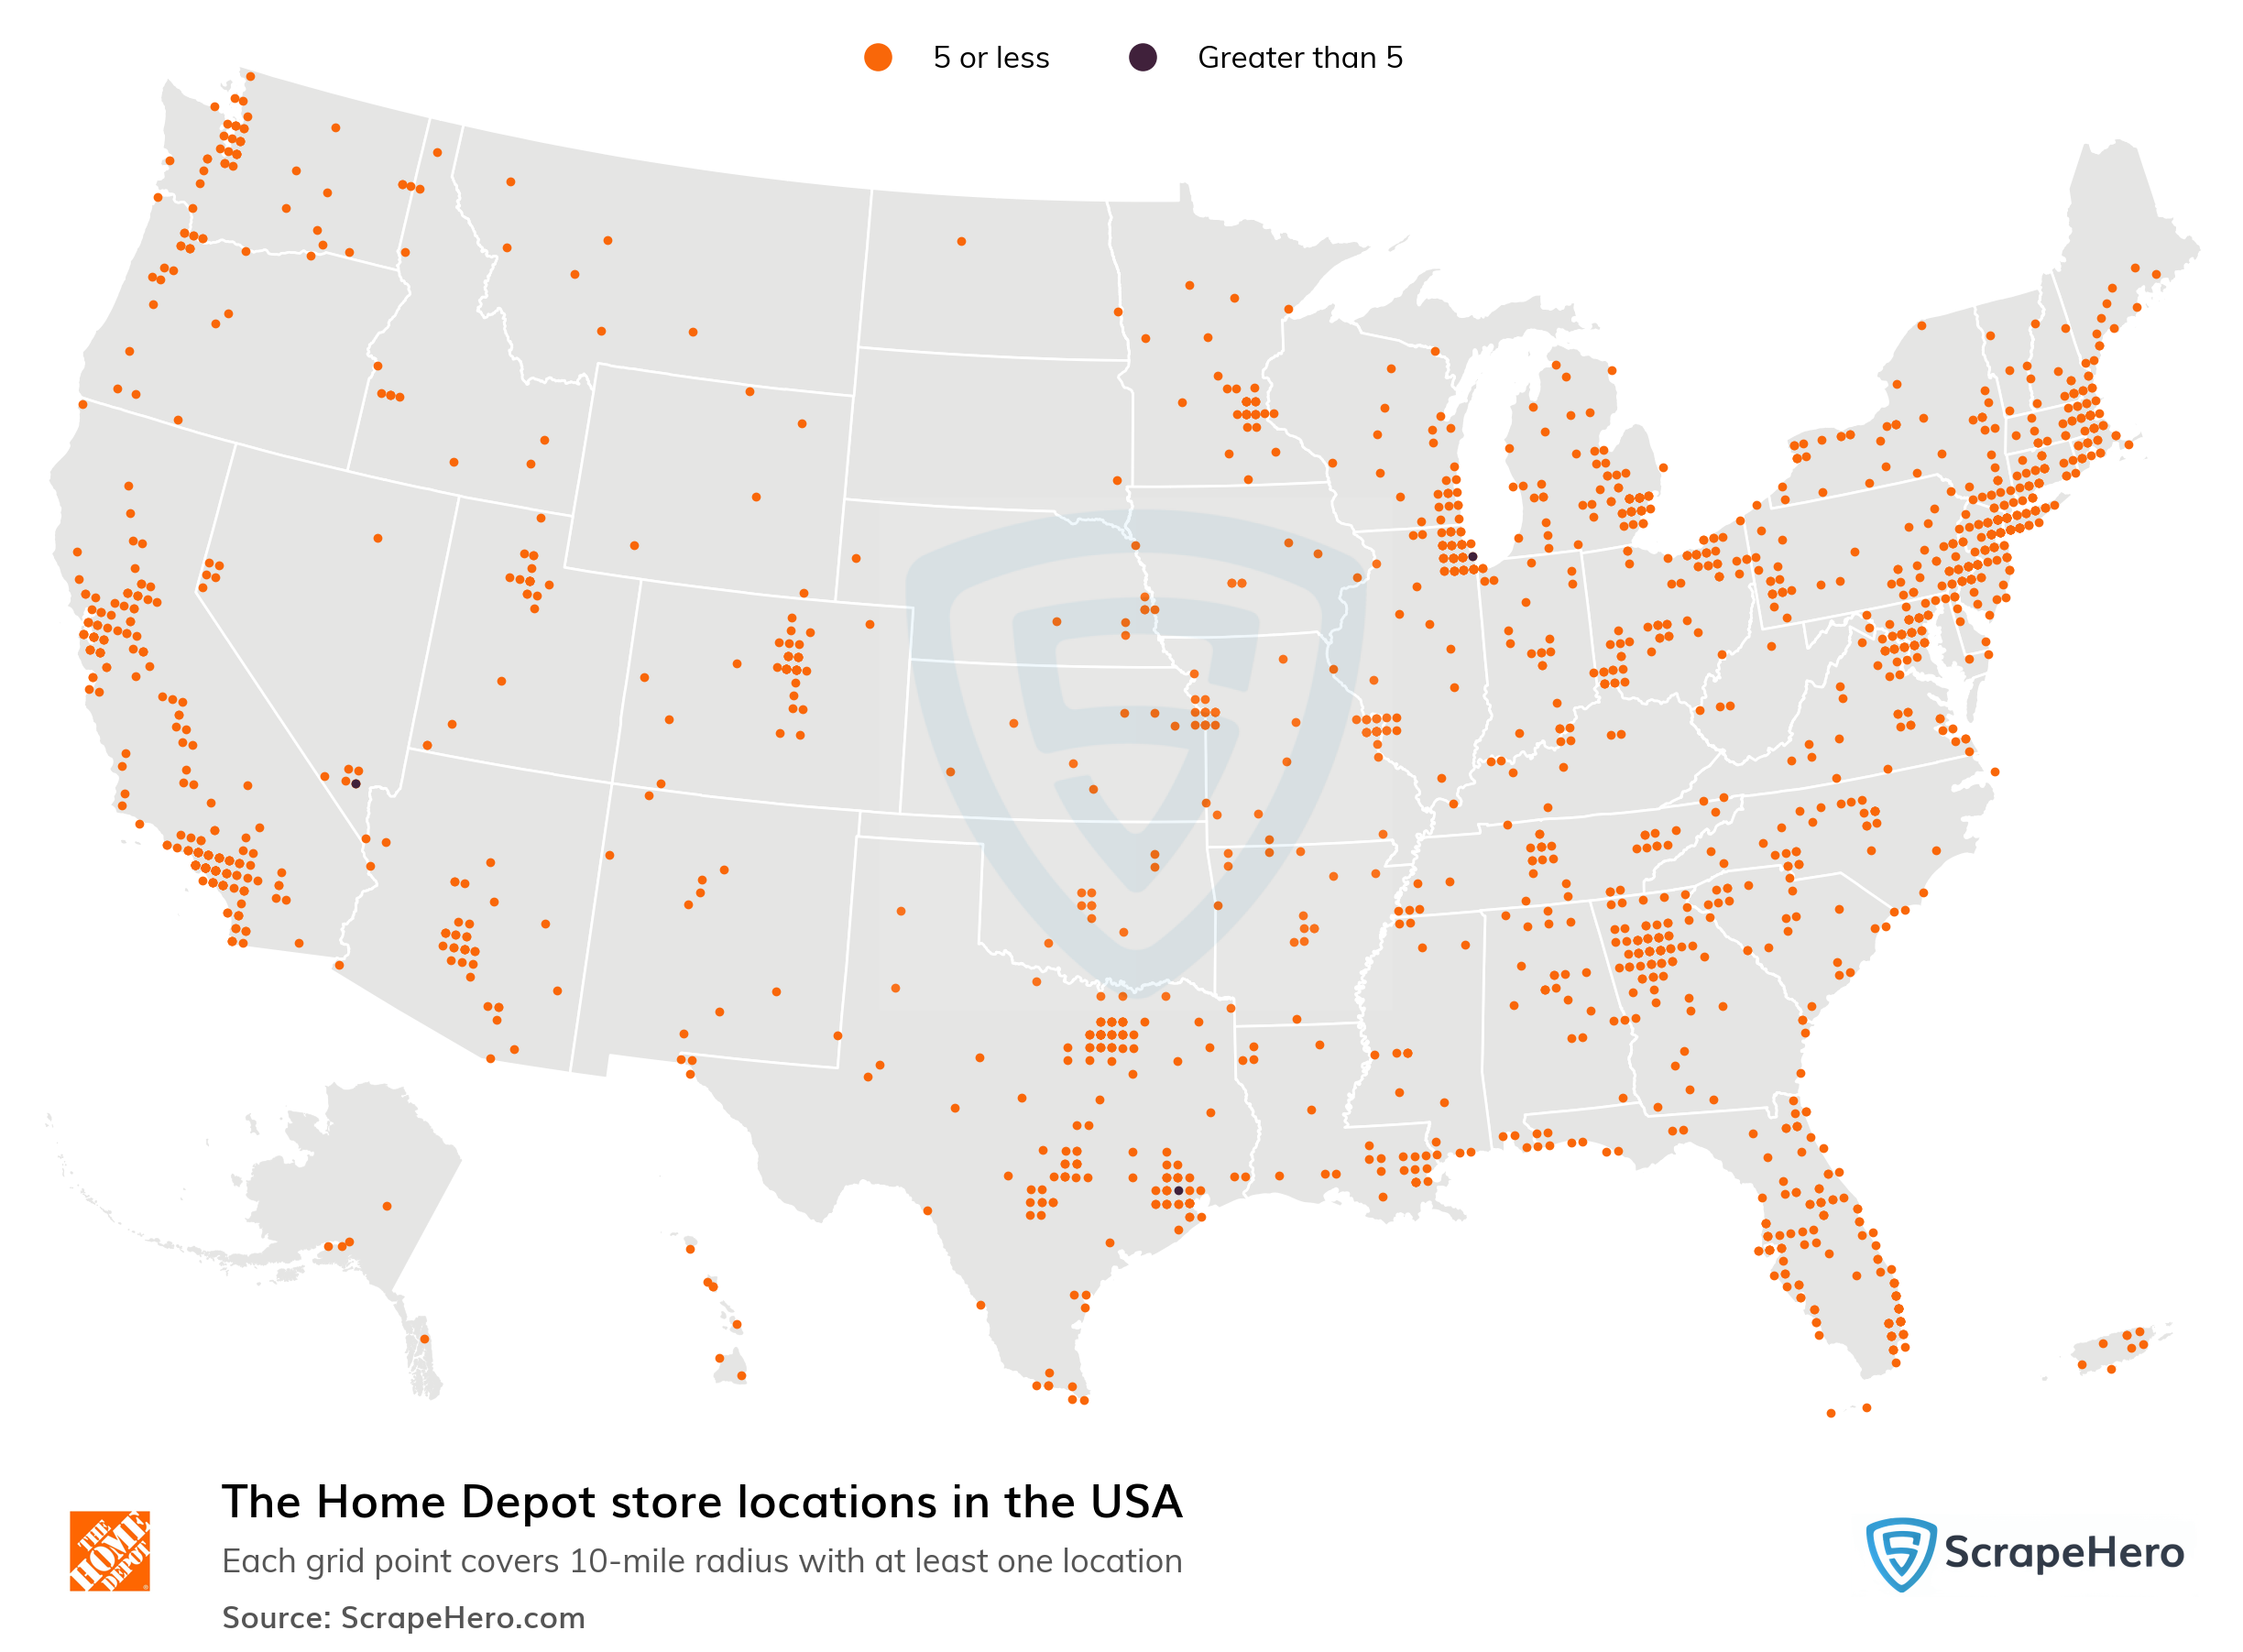
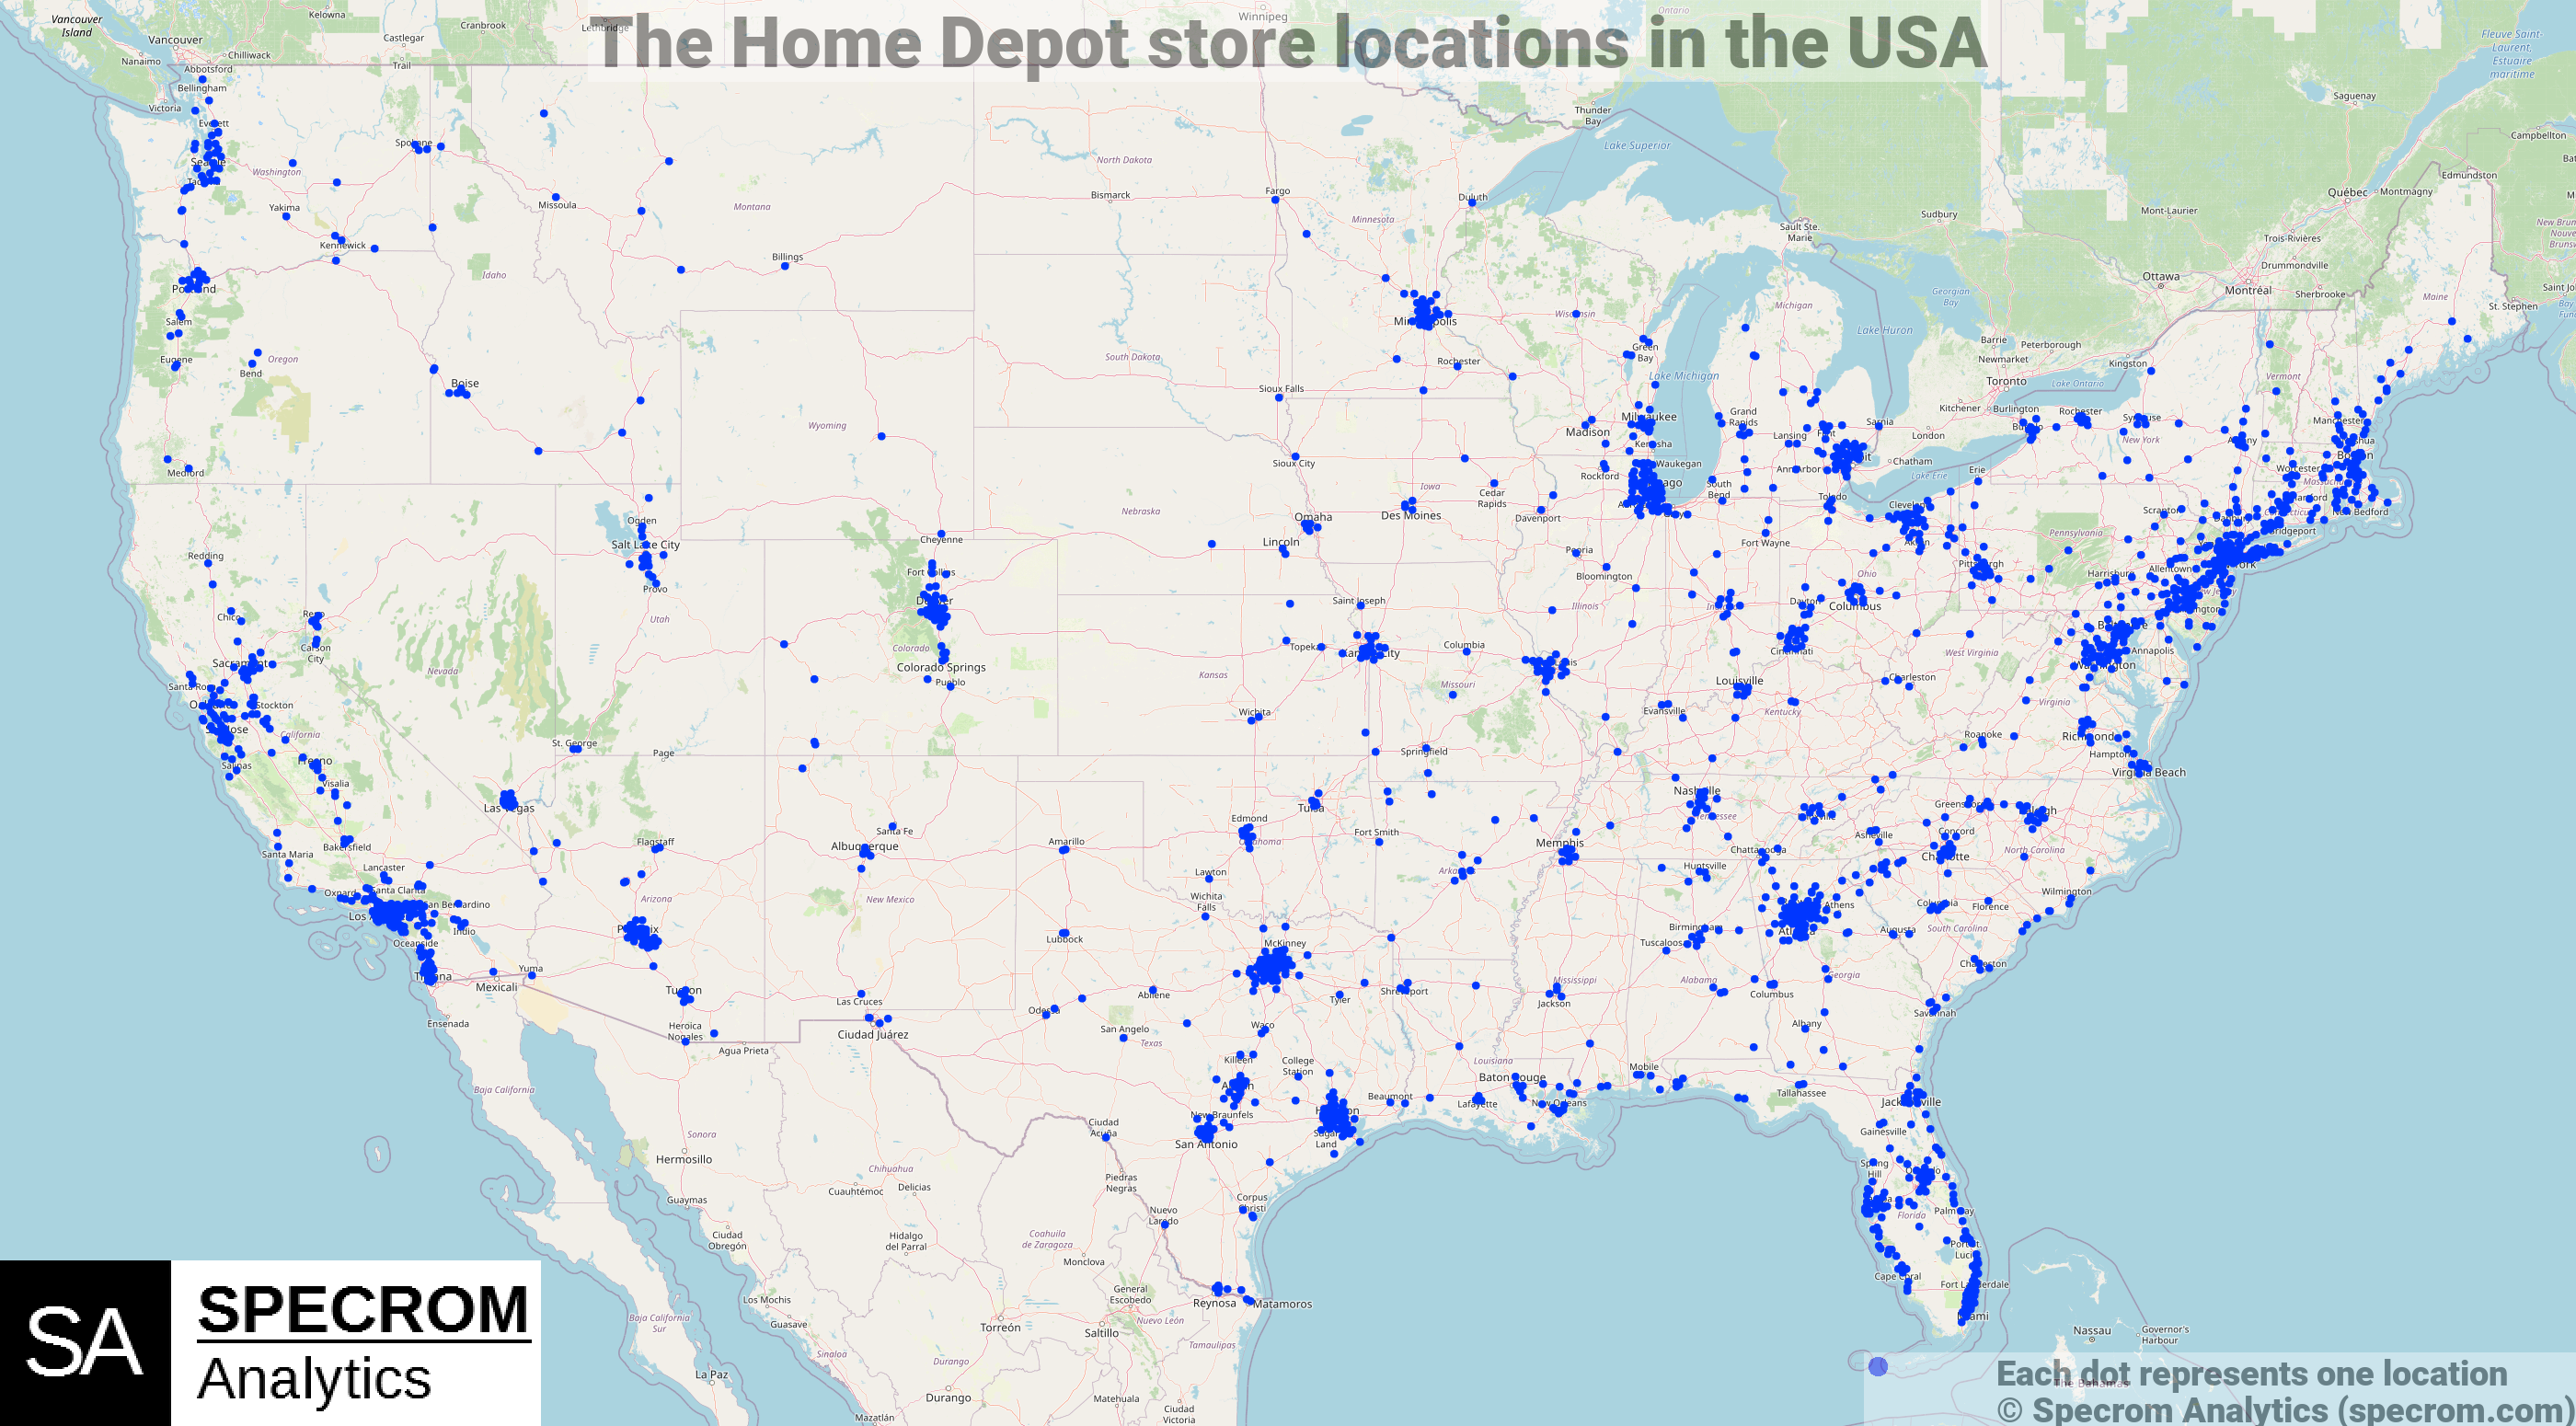
The Home Depot’s presence in the U.S. is not uniformly distributed; rather, it is a calculated map of economic density and housing market health. While the total number of stores fluctuates slightly due to new openings and the occasional relocation or consolidation, the figure remains steady at around 2,000 domestic locations. These stores are strategically positioned in high-density metropolitan areas and growing suburban hubs where homeownership rates—and subsequently, home improvement spending—are highest.
Regional Concentration and Market Capture
The distribution of Home Depot stores follows the money. States like California, Texas, and Florida boast the highest concentrations of stores. This is not coincidental. These regions represent the triad of American real estate growth: high property values, frequent turnover of existing homes, and consistent new construction. By saturating these markets, Home Depot creates a barrier to entry for smaller competitors and maintains a “convenience moat.” For a professional contractor, the distance to the nearest supply house is a direct factor in project profitability. By ensuring a store is within a ten-to-fifteen-minute drive of most major residential construction sites, Home Depot secures the lucrative “Pro” customer segment.
The Evolution of Store Format
While the standard “big box” format remains the primary vehicle for revenue, the company has experimented with varying footprints to maximize the return on invested capital (ROIC). This includes “urban-lite” formats in cities like New York, where traditional 100,000-square-foot layouts are impossible. From a financial perspective, these variations allow the company to capture high-income urban spenders without the astronomical overhead of traditional real estate footprints, thereby protecting the net profit margin.
The Financial Logic of Store Density: Revenue Per Square Foot and Market Penetration
In the world of retail finance, the number of stores is a vanity metric; revenue per square foot is the reality. Home Depot has historically outperformed its peers in this category, often generating significantly higher sales per square foot than its primary competitor, Lowe’s. This efficiency is driven by a sophisticated understanding of inventory turnover and localized product mix.
Maximizing Asset Utilization
A Home Depot store is not merely a warehouse for consumers; it is a high-functioning distribution node. The company’s financial success is predicated on its ability to move high-ticket items—such as appliances, lumber, and flooring—at a rapid clip. By maintaining high store density in specific regions, Home Depot can share inventory across locations more fluidly. This reduces the “dead capital” tied up in slow-moving stock. If one location is overstocked on a specific SKU of roofing shingles, the proximity of five other stores in the metropolitan area allows for rapid redistribution, ensuring that capital stays fluid.
The “Pro” Factor and Revenue Stability
Approximately half of Home Depot’s revenue is generated by professional customers—contractors, electricians, and remodelers—who represent only about 10% of the total customer base. The store count is critical here because “Pros” value time over almost everything else. A dense network of stores allows Home Depot to offer “buy online, pick up in-store” (BOPIS) services that are unparalleled. Financially, the Pro customer is more resilient to economic downturns than the average DIYer. Even when discretionary consumer spending dips, professional maintenance and repair work continue, providing Home Depot with a stable cash flow that supports its aggressive dividend policy.
Capital Allocation and the Strategy of “Interconnected Retail”

The most significant shift in Home Depot’s financial history occurred when management decided to pivot away from the “growth at all costs” model of the 1990s and early 2000s. Instead of using capital to build hundreds of new stores every year, the company began funneling billions into “Interconnected Retail”—the seamless blending of physical stores with a digital ecosystem.
Reinvesting for Efficiency
Between 2017 and 2024, Home Depot committed billions of dollars to its “One Home Depot” investment plan. The goal was not to increase the store count, but to increase the value of each existing store. This included upgrading point-of-sale systems, enhancing the mobile app for easier in-store navigation, and building out a sophisticated supply chain that utilizes stores as last-mile delivery hubs. From an investment perspective, this strategy is far more capital-efficient than building new physical structures. It improves the operating margin by leveraging existing real estate to fulfill online orders, effectively turning every store into a mini-fulfillment center.
Shareholder Returns and Buybacks
Because Home Depot is no longer spending the majority of its free cash flow on land acquisition and construction, it has been able to return an extraordinary amount of value to shareholders. The company has a storied history of increasing dividends and executing massive share buyback programs. This financial discipline is a direct result of the optimized store count. By maintaining a steady number of high-performing stores rather than a sprawling network of underperforming ones, the company ensures that its Return on Equity (ROE) remains among the highest in the retail sector.
Competitive Moats: Home Depot’s Real Estate Strategy vs. Lowe’s
When analyzing Home Depot’s store count, it is impossible to ignore the “duopoly” it shares with Lowe’s. While Lowe’s actually has a comparable number of stores, the financial profiles of the two companies differ due to their real estate and branding strategies.
Location, Location, Location
Home Depot’s early entry into many key markets allowed it to secure “prime-prime” real estate—locations that are easily accessible from major highways and situated in high-traffic commercial zones. The cost of acquiring such real estate today would be prohibitive, creating a natural competitive moat. Financially, owning the land under their stores (rather than leasing) provides Home Depot with significant asset backing on their balance sheet and protects them from the rising costs of commercial rents.
Market Share and Pricing Power
With 2,000 stores acting as a unified procurement engine, Home Depot possesses immense bargaining power with suppliers. This scale allows them to maintain lower Cost of Goods Sold (COGS) than smaller hardware chains or regional players. The ability to maintain these margins while offering competitive pricing is what fuels the company’s “virtuous cycle” of growth: lower prices lead to more volume, which leads to better supplier deals, which leads to higher profits.
The Future of the Physical Store in a High-Interest Rate Environment
The macro-economic landscape, defined by fluctuating interest rates and a cooling housing market, presents new challenges for Home Depot’s physical footprint. However, the company’s financial structure is built to weather these cycles.
The Resilience of Home Equity
Even as mortgage rates rise and new home sales slow, the “age of the housing stock” works in Home Depot’s favor. The average American home is now over 40 years old, requiring constant maintenance and renovation. Home Depot’s stores are positioned to capture this “nondiscretionary” spending. Financially, the company focuses on the “spend per basket,” which has remained robust even during inflationary periods.
Tech-Enabled Stores as the New Frontier
The future of Home Depot’s store count may not be about more buildings, but about smarter ones. The integration of AI-driven inventory management and automated checkout systems is designed to reduce labor costs—the largest operating expense for any retailer. By increasing the efficiency of its 2,000+ locations through technology, Home Depot can continue to grow its bottom line without the capital expenditure required for new store openings.
In conclusion, while the number of Home Depots in the USA—roughly 2,000—is an impressive figure of scale, its true value lies in how that footprint is leveraged. Through strategic regional concentration, a focus on the high-margin Pro customer, and a pivot toward digital integration, Home Depot has transformed its physical stores into a powerhouse of financial productivity. For the business analyst, these stores are not just retail outlets; they are the nodes of a high-efficiency financial engine that continues to set the standard for the modern corporate enterprise.
aViewFromTheCave is a participant in the Amazon Services LLC Associates Program, an affiliate advertising program designed to provide a means for sites to earn advertising fees by advertising and linking to Amazon.com. Amazon, the Amazon logo, AmazonSupply, and the AmazonSupply logo are trademarks of Amazon.com, Inc. or its affiliates. As an Amazon Associate we earn affiliate commissions from qualifying purchases.