
In the intricate world of finance, few mathematical concepts hold as much power and pervasive utility as the simple calculation: “what percentage is a number of another.” Far from being a mere academic exercise, this fundamental principle underpins virtually every aspect of personal finance, investment strategy, business analysis, and economic understanding. From dissecting your monthly budget to evaluating investment returns, from understanding a company’s profit margins to grasping the impact of inflation, mastering this calculation is not just beneficial—it is absolutely indispensable for informed financial decision-making and wealth creation.
The Foundational Math of Financial Acumen
At its core, calculating what percentage one number is of another is about understanding proportion and relative value. It provides context, allowing us to compare disparate figures, track changes over time, and assess performance in a standardized way.
The Basic Calculation: A Quick Refresher
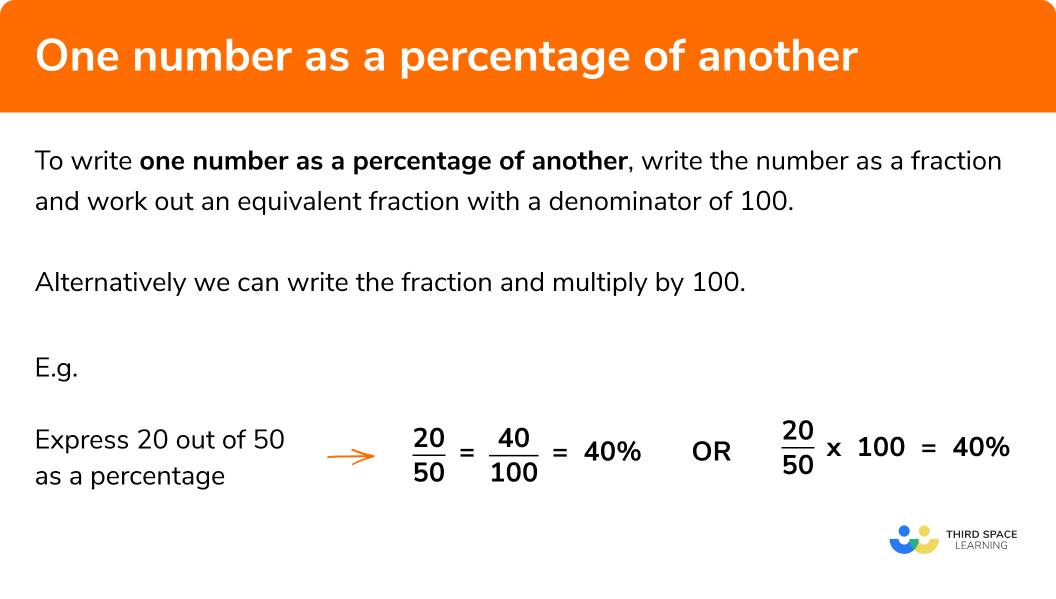
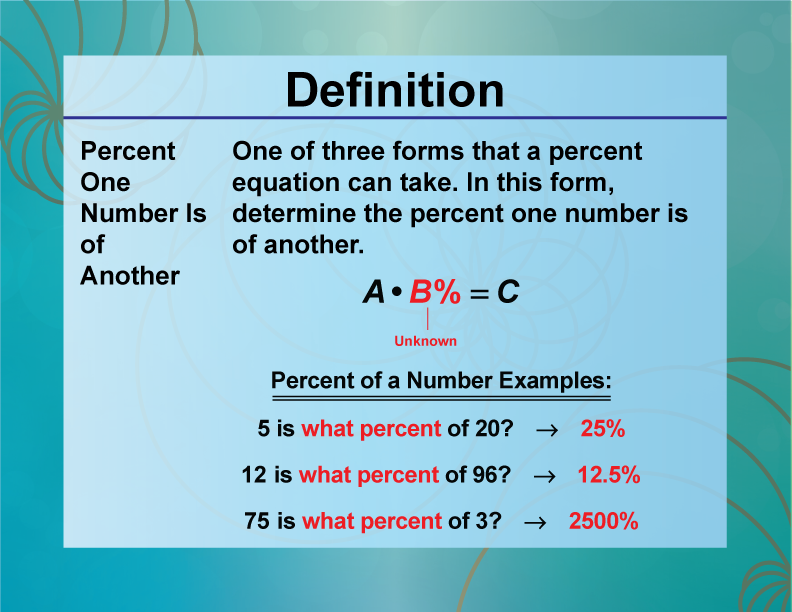
The formula is straightforward: (Part / Whole) * 100 = Percentage.
If you want to know what percentage ‘X’ is of ‘Y’, you simply divide X by Y and then multiply the result by 100 to express it as a percentage. For example, if you earned $50 in interest on an initial investment of $1,000, then ($50 / $1,000) * 100 = 5%. This 5% represents your return on investment for that period. This deceptively simple equation serves as the bedrock for countless financial analyses.
Why This Simple Calculation Matters in Finance
Without the ability to express relationships as percentages, financial discussions would be bogged down in absolute numbers that often lack meaningful context. A $100 increase in revenue means vastly different things for a small startup versus a multinational corporation. However, expressing it as a 10% increase versus a 0.001% increase immediately clarifies the relative impact. Percentages allow for:
-
Standardization: Comparing different scales on an equal footing.
-
Clarity: Providing an intuitive understanding of proportions.
-
Tracking: Measuring growth, decline, or allocation over periods.
-
Decision-Making: Informing choices based on relative performance or impact.
Personal Finance: Budgeting, Savings, and Debt
For individuals, understanding percentages is the key to unlocking true financial control. It’s how we measure our financial health, identify areas for improvement, and set realistic goals.
Budgeting for Financial Health: Allocating Your Income
One of the most immediate applications of percentage calculation in personal finance is budgeting. Common budgeting rules, like the 50/30/20 rule (50% for needs, 30% for wants, 20% for savings and debt repayment), are entirely built upon this concept. To apply this, you calculate what percentage each expenditure category represents of your total take-home income. For example, if your monthly take-home pay is $4,000 and your housing costs (a “need”) are $1,800, then ($1,800 / $4,000) * 100 = 45%. This tells you that 45% of your income goes to housing, allowing you to assess if you’re within your desired percentage allocation and adjust as needed. This clarity helps in identifying overspending and reallocating funds more effectively.
Measuring Savings Progress and Goals
Whether you’re saving for a down payment, retirement, or an emergency fund, percentages help track progress and quantify goals. If you aim to save $10,000 and you currently have $2,500, then you’ve achieved ($2,500 / $10,000) * 100 = 25% of your goal. This provides a clear, motivating benchmark. Furthermore, calculating your savings rate—what percentage of your income you save each month—is a critical metric for long-term financial independence. A higher savings rate means a faster path to financial freedom.
Understanding and Tackling Debt Percentages
Debt is often quantified in percentages. Interest rates on credit cards, mortgages, and personal loans are all expressed this way. Understanding your interest rate helps you grasp the true cost of borrowing. Beyond that, calculating your debt-to-income (DTI) ratio is a crucial metric for lenders and for your own financial assessment. If your total monthly debt payments (excluding mortgage) are $500 and your gross monthly income is $3,000, your DTI is ($500 / $3,000) * 100 = 16.67%. A high DTI indicates potential financial strain and can hinder access to new credit or favorable loan terms. Strategically tackling debt often involves prioritizing high-interest debts, which again, means comparing their percentage rates.
Investing and Wealth Growth: Harnessing Compound Power
In the realm of investing, percentages are the language of returns, risk, and diversification. They allow investors to compare opportunities and understand the dynamics of wealth accumulation.
Calculating Returns on Investment (ROI)
The primary metric for evaluating any investment is its Return on Investment (ROI). This tells you what percentage your investment has grown (or shrunk) relative to your initial capital. If you invested $5,000 and it grew to $5,500, your gain is $500. Your ROI is ($500 / $5,000) * 100 = 10%. This simple percentage allows you to compare the performance of different stocks, funds, real estate, or other assets, regardless of their absolute cost or scale. It’s the universal scorecard for investment success.
The Magic of Compound Interest: Percentage Growth Over Time
Perhaps the most celebrated application of percentages in finance is compound interest, often called the “eighth wonder of the world.” This concept explains how your earnings generate further earnings, leading to exponential growth. When an investment earns, say, 7% interest annually, that 7% is calculated not just on your initial principal but also on the accumulated interest from previous periods. Understanding this percentage-based growth mechanism is fundamental to long-term wealth building, highlighting the importance of starting early and reinvesting returns.
Portfolio Allocation and Risk Management
Sophisticated investors use percentages to allocate their assets across various classes (stocks, bonds, real estate, cash) to manage risk and optimize returns. A common strategy might be 60% stocks, 30% bonds, 10% cash. These percentages reflect an investor’s risk tolerance and financial goals. Regularly rebalancing a portfolio means adjusting these percentages back to their target allocations, ensuring the investment strategy remains aligned with objectives. Furthermore, assessing the percentage decline of an asset during a market downturn (e.g., a 20% drop from its peak) helps investors understand potential risks and volatility.
Business Finance: Profitability, Performance, and Projections
For businesses, percentages are vital metrics for measuring operational efficiency, market position, and overall financial health. They guide strategic decisions, from pricing to expansion.
Deciphering Profit Margins and Revenue Growth
Business success is often distilled into percentages. Gross profit margin (Gross Profit / Revenue * 100) shows the percentage of revenue left after deducting the cost of goods sold. Net profit margin (Net Profit / Revenue * 100) reveals the percentage of revenue that translates into actual profit after all expenses. These percentages are critical for assessing a company’s efficiency and competitive strength. Similarly, revenue growth is expressed as a percentage increase over a prior period, indicating the pace of expansion and market penetration. A 15% year-over-year revenue growth often signals a healthy, expanding business.
Market Share and Competitive Analysis
Companies constantly analyze their market share—what percentage of the total market revenue they capture. If the total market for a product is $1 billion and a company sells $200 million worth, its market share is ($200 million / $1 billion) * 100 = 20%. This percentage is a key indicator of competitive position and industry dominance. Tracking changes in market share over time helps businesses understand their competitive landscape and the effectiveness of their marketing and sales strategies.
Discounts, Markups, and Cost Efficiency
Pricing strategies heavily rely on percentages. Retailers calculate markups (the percentage added to the cost to determine the selling price) and offer discounts (a percentage reduction from the original price). Understanding these percentages directly impacts profitability. Furthermore, businesses constantly strive for cost efficiency, often expressed as a percentage reduction in expenses. For example, reducing operational costs by 5% can significantly boost the bottom line, directly impacting profit percentages.
Economic Indicators and Financial Products: Beyond Personal Scope
At a broader economic level, percentages are the language of national economies and global financial markets, influencing everything from interest rates to the cost of living.
Interest Rates, APR, and Loan Payments
Interest rates—the cost of borrowing money or the return on saving it—are universally expressed as percentages. A mortgage with a 6% annual interest rate, a credit card with 22% Annual Percentage Rate (APR), or a savings account offering 0.5% yield are all examples where this core calculation dictates significant financial outcomes. Understanding how these percentages translate into actual dollar amounts for payments or earnings is crucial for managing debt and growing savings. The difference of just a few percentage points can mean thousands, even tens of thousands, of dollars over the life of a loan or investment.
Inflation and Purchasing Power Erosion
Inflation, the rate at which the general level of prices for goods and services is rising, is always expressed as a percentage. If inflation is 3% annually, it means that, on average, your purchasing power has eroded by 3% over that year. This percentage directly impacts the real value of your savings and investments, making it a critical consideration in financial planning and investment strategy. To maintain purchasing power, investments need to yield returns that at least match, if not exceed, the inflation rate.

Understanding Tax Rates and Deductions
Taxation is inherently percentage-based. Income tax rates, sales tax rates, property tax rates, and capital gains tax rates are all expressed as percentages. Understanding your marginal tax rate (the percentage of tax paid on your next dollar of income) is vital for tax planning. Similarly, tax deductions and credits are often framed as their impact on your taxable income or tax liability, indirectly tying back to the percentage of income you ultimately pay in taxes.
In conclusion, “what percentage is a number of another” is far more than a simple arithmetic problem. It is the analytical lens through which the vast and complex world of money becomes comprehensible, comparable, and actionable. From personal budgeting to global economic trends, mastering this fundamental calculation empowers individuals and businesses alike to make more informed decisions, manage risks effectively, and strategically build wealth. It is, without exaggeration, the universal language of financial literacy.
aViewFromTheCave is a participant in the Amazon Services LLC Associates Program, an affiliate advertising program designed to provide a means for sites to earn advertising fees by advertising and linking to Amazon.com. Amazon, the Amazon logo, AmazonSupply, and the AmazonSupply logo are trademarks of Amazon.com, Inc. or its affiliates. As an Amazon Associate we earn affiliate commissions from qualifying purchases.