
In the dynamic world of business, understanding your financial performance is paramount to success. Among the myriad metrics available, the “percentage of sales” stands out as a fundamental, versatile, and incredibly insightful tool. Far from being a mere academic exercise, calculating and interpreting various sales percentages empowers business owners, managers, and investors to dissect financial statements, identify trends, assess efficiency, and make informed strategic decisions. This guide delves into the essence of sales percentages, explaining not just how to calculate them, but why they are indispensable for cultivating financial health and driving sustainable growth.

At its core, a percentage of sales expresses a particular financial figure as a proportion of total revenue. Whether you’re analyzing the cost of producing goods, the efficiency of your marketing spend, or the ultimate profitability of your operations, framing these figures as a percentage of sales provides a standardized lens for comparison, allowing for apples-to-apples evaluations across different periods, product lines, or even against industry benchmarks. This foundational understanding is the first step toward transforming raw financial data into actionable intelligence.
Understanding the Fundamentals of Sales Percentages
To effectively leverage sales percentages, one must first grasp their definition, significance, and the basic mathematical principles behind their calculation. These percentages act as a universal translator for financial data, simplifying complex reports into easily digestible and comparable figures.
Defining Percentage of Sales
A “percentage of sales” refers to any financial line item expressed as a proportion of total sales revenue, multiplied by 100. It’s a relative measure, indicating how much of each sales dollar is allocated to a particular expense, cost, or profit. For instance, if your Cost of Goods Sold (COGS) is 30% of sales, it means that for every dollar of revenue generated, 30 cents went directly into producing or acquiring the goods sold. This allows for a clear, concise understanding of how different components of your business relate to the revenue it generates. It moves beyond absolute numbers, which can be misleading without context, to provide a relational insight that scales with your business operations.
Why Sales Percentages Matter
The importance of sales percentages extends across virtually every facet of financial analysis and strategic planning. They offer several critical benefits:
-
Performance Evaluation: They provide a standardized way to measure operational efficiency and profitability over time, regardless of fluctuations in total sales volume.
-
Benchmarking: Businesses can compare their performance against industry averages or competitors, identifying areas where they outperform or underperform. This is crucial for understanding competitive positioning.
-
Budgeting and Forecasting: By understanding historical percentages, businesses can more accurately project future costs and profits based on anticipated sales, making budgeting a more precise exercise.
-
Cost Control: Highlighting disproportionately large expenses relative to sales can pinpoint inefficiencies and prompt cost-cutting measures or strategic shifts.
-
Pricing Strategy: Analyzing gross profit margins as a percentage of sales can inform pricing decisions, ensuring products are priced effectively to cover costs and generate desired profit levels.
-
Investment Decisions: Investors frequently use these percentages to evaluate a company’s financial health, management efficiency, and long-term viability before making investment commitments.
Basic Formulae and Concepts
The fundamental formula for calculating any percentage of sales is straightforward:
Percentage of Sales = (Specific Financial Figure / Total Sales Revenue) * 100
Here, the “Specific Financial Figure” can be any line item from your income statement or other financial reports, such as Cost of Goods Sold, operating expenses, marketing expenses, or various levels of profit. “Total Sales Revenue” (also known as Net Sales or simply Revenue) represents the total income generated from your primary business activities before any expenses are deducted. Understanding this core formula allows you to apply it to a multitude of financial metrics, unlocking a deeper understanding of your business’s financial structure.
Practical Applications: Calculating Key Sales-Related Percentages
While the core formula remains consistent, its application varies depending on the specific insight you seek. Different percentages of sales illuminate different aspects of a business’s financial performance, from production efficiency to overall profitability.
Gross Profit Margin (as a % of Sales)
The Gross Profit Margin is a crucial indicator of a company’s pricing strategy and the efficiency of its production or procurement processes. It reveals how much profit a company makes from each sale after accounting for the direct costs associated with producing or acquiring the goods sold.
-
Formula:
((Revenue - Cost of Goods Sold) / Revenue) * 100 -
Explanation: A higher gross profit margin suggests effective pricing, efficient production, or strong cost control over direct inputs. A declining margin might indicate increased supplier costs, ineffective pricing, or production inefficiencies.
-
Example: A boutique clothing store with $100,000 in monthly sales and $40,000 in COGS has a Gross Profit of $60,000. Their Gross Profit Margin is ($60,000 / $100,000) * 100 = 60%. This means for every dollar of sales, 60 cents remain to cover operating expenses and generate net profit.
Operating Expense Ratio (as a % of Sales)
This percentage measures how efficiently a company manages its day-to-day operations. It encompasses all non-production-related costs, such as administrative salaries, rent, utilities, marketing, and research and development, relative to sales.
-
Formula:
(Operating Expenses / Revenue) * 100 -
Explanation: A lower operating expense ratio indicates better cost control and operational efficiency. Comparing this ratio over time can reveal trends in spending relative to sales growth, highlighting whether the business is scaling efficiently.
-
Example: A software company with $500,000 in quarterly revenue and $150,000 in operating expenses (salaries, office rent, software licenses) has an Operating Expense Ratio of ($150,000 / $500,000) * 100 = 30%. This suggests that 30% of their revenue is consumed by the costs of running the business, independent of the direct cost of delivering their software product.
Net Profit Margin (as a % of Sales)
The Net Profit Margin is the ultimate measure of a company’s profitability, showing how much profit a business makes from each dollar of sales after all expenses, including COGS, operating expenses, interest, and taxes, have been deducted.
-
Formula:
(Net Income / Revenue) * 100 -
Explanation: This percentage reflects the overall effectiveness of a company’s operations, cost management, and financial structure. It’s a critical indicator for investors and stakeholders, showing the ‘bottom line’ efficiency.
-
Example: An e-commerce business generating $1,000,000 in annual revenue with a Net Income of $80,000 has a Net Profit Margin of ($80,000 / $1,000,000) * 100 = 8%. This means for every dollar of revenue, 8 cents translates into actual profit for the business owners or shareholders.
Cost of Goods Sold (COGS) as a % of Sales
This specific ratio directly measures the proportion of sales revenue that is spent on the direct costs of producing the goods sold or services rendered.
-
Formula:
(Cost of Goods Sold / Revenue) * 100 -
Explanation: A high COGS percentage might indicate inefficient production, rising supplier costs, or insufficient pricing. A low percentage is generally favorable, suggesting healthy margins on core products/services.
-
Example: If a manufacturing company has COGS of $250,000 on sales of $500,000, their COGS as a % of sales is 50%. This signifies that half of their revenue is immediately consumed by the direct costs of their products.
Sales Growth Percentage
While not a direct “percentage of sales” in the same vein as the others (it doesn’t relate an expense to current sales), sales growth percentage is a vital related metric that measures the rate at which a company’s sales revenue is increasing or decreasing over a period.
-
Formula:
((Current Period Sales - Prior Period Sales) / Prior Period Sales) * 100 -
Explanation: This metric indicates the business’s expansion and market acceptance. Positive growth is often a sign of a healthy, expanding business, while negative growth can signal market saturation, increased competition, or operational issues.
-
Example: If a business had sales of $750,000 last year and $900,000 this year, its sales growth percentage is (($900,000 – $750,000) / $750,000) * 100 = 20%.
Leveraging Sales Percentages for Strategic Business Decisions
Calculating these percentages is only half the battle; the true value lies in their interpretation and application to strategic decision-making. These metrics provide a powerful lens through which to evaluate past performance and chart a course for future success.
Performance Benchmarking and Industry Comparison
One of the most potent uses of sales percentages is for benchmarking. By comparing your company’s percentages (e.g., Gross Profit Margin, Net Profit Margin, Operating Expense Ratio) against industry averages, key competitors, or best-in-class companies, you can identify areas of strength and weakness. If your COGS as a % of sales is significantly higher than the industry average, it might signal an issue with your supply chain, production efficiency, or pricing model. Conversely, a higher net profit margin could indicate superior operational efficiency or a strong competitive advantage. This comparison provides invaluable context, helping you understand where your business stands in the competitive landscape.
Budgeting and Forecasting
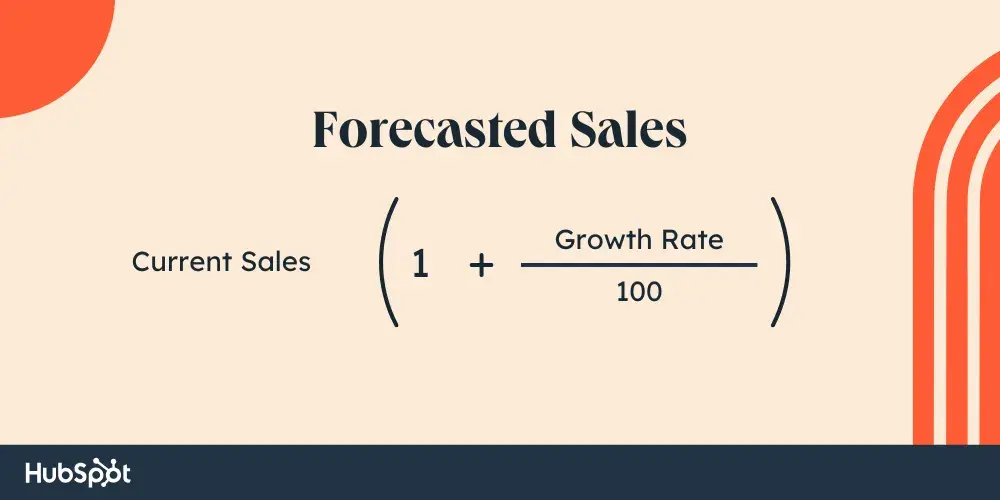
Sales percentages form the bedrock of robust budgeting and financial forecasting. Many expenses, particularly variable costs and certain operating expenses, tend to move in tandem with sales revenue. By establishing historical percentages for these costs, businesses can project future expenses with greater accuracy based on anticipated sales figures. For instance, if your marketing budget has historically been 5% of sales, you can allocate future marketing spend based on projected revenue. This “percentage of sales” method simplifies the budgeting process, making it more dynamic and responsive to revenue fluctuations, and helps in creating more realistic financial models for future periods.
Identifying Trends and Anomalies
Consistent tracking of sales percentages over multiple periods (monthly, quarterly, annually) allows businesses to identify significant trends and anomalies. A steady decline in gross profit margin might signal rising input costs or increased competitive pressure that requires a pricing review. A sudden spike in the operating expense ratio could point to uncontrolled overheads or a one-off significant expense that needs investigation. Early detection of such trends—both positive and negative—enables timely interventions, adjustments to strategy, and proactive problem-solving, preventing minor issues from escalating into major financial challenges.
Pricing Strategies and Product Mix Optimization
Understanding the profit margins of individual products or service lines as a percentage of their respective sales is critical for optimizing pricing and product mix. If one product has a significantly lower gross profit margin than others, a business might consider repricing it, seeking more cost-effective suppliers, or even phasing it out if it drags down overall profitability. Conversely, identifying high-margin products allows for strategic focus, potentially increasing marketing efforts or production capacity for those items to maximize overall profitability. This granular analysis ensures that every product or service contributes optimally to the company’s financial health.
Tools and Best Practices for Accurate Calculation and Analysis
Accuracy in calculating sales percentages is paramount, as flawed data can lead to misguided decisions. Leveraging the right tools and adhering to best practices ensures your financial analysis is reliable and actionable.
Essential Financial Tools
-
Spreadsheets (Excel, Google Sheets): These are indispensable for most businesses. They allow for manual data input, formula application, and the creation of dynamic reports. Advanced features like pivot tables and charting can help visualize trends and perform sophisticated “what-if” analyses. Templates for income statements and ratio analysis are widely available.
-
Accounting Software (QuickBooks, Xero, Sage): Modern accounting software automates much of the data entry and financial reporting processes. They can generate income statements, balance sheets, and cash flow statements, from which sales percentages can be easily derived. Some even offer built-in financial ratio analysis features.
-
Business Intelligence (BI) Dashboards: For larger or data-intensive businesses, BI tools (e.g., Tableau, Power BI) can connect directly to various data sources, providing real-time, interactive dashboards. These tools automate the calculation and visualization of sales percentages and other key performance indicators (KPIs), offering deeper insights and faster decision-making capabilities.
Data Integrity and Consistency
The accuracy of your sales percentage analysis hinges entirely on the quality of your underlying financial data. It is crucial to:
-
Ensure Accurate Data Entry: Mistakes in recording sales, expenses, or COGS will inevitably lead to incorrect percentages. Implement robust internal controls for financial data entry.
-
Maintain Consistency in Accounting Methods: Use the same accounting principles and definitions consistently across periods. Changes in how revenue or expenses are classified can distort comparisons over time.
-
Standardize Reporting Periods: Ensure that you are comparing apples to apples—for instance, always compare monthly figures from the same month year-over-year, or consistent quarterly periods.
Interpreting the Numbers in Context
Numbers alone tell only part of the story. To gain true insight, sales percentages must be interpreted within their broader context:
-
Industry Specifics: What is considered a “good” profit margin varies significantly by industry. A grocery store will have a much lower net profit margin than a software company, for example. Always compare your figures against relevant industry benchmarks.
-
Economic Conditions: Economic downturns, inflation, or boom periods can all impact sales and expenses, influencing percentages. Consider the prevailing economic climate when analyzing trends.
-
Business Lifecycle Stage: A startup might intentionally run at a lower profit margin to gain market share, while a mature business might prioritize stable, higher margins. The stage of your business affects what percentages are deemed acceptable or strategic.
-
Holistic View: Never rely on a single percentage in isolation. A high gross profit margin is great, but if operating expenses are eating away all of it, your net profit margin will suffer. Always look at multiple metrics in conjunction to get a comprehensive financial picture.
Common Pitfalls and How to Avoid Them
Even with the right tools and best practices, businesses can fall into common traps when analyzing sales percentages. Awareness of these pitfalls is key to extracting genuinely valuable insights.
Ignoring Industry Benchmarks
One of the most common mistakes is to analyze sales percentages solely in isolation or against internal historical data without considering external industry benchmarks. An internal trend might look positive, but if your company is significantly underperforming compared to competitors, there’s still a critical issue. Always seek out industry reports, trade associations, and competitor financial statements to put your percentages in context.
Misinterpreting Short-Term Fluctuations
A sudden spike or dip in a percentage over a single period might be a one-off event (e.g., a large, infrequent expense; a seasonal sales surge) rather than a sustained trend. Overreacting to short-term noise can lead to misguided strategic shifts. It’s crucial to analyze data over longer periods to identify genuine trends and distinguish them from temporary fluctuations. Look for consistent patterns over several months or quarters.
Neglecting External Factors
Businesses operate within a broader ecosystem. External factors like economic downturns, changes in consumer preferences, new regulations, supply chain disruptions, or the emergence of disruptive technologies can profoundly impact sales and costs, thereby affecting percentages. Failing to consider these macro and micro-environmental influences can lead to an incomplete or incorrect interpretation of your financial data. Always integrate external market analysis into your financial review process.
Relying Solely on Percentages
While powerful, sales percentages are relative measures. They don’t provide the complete picture without also considering absolute figures and cash flow. For instance, a small business with a 20% net profit margin on $100,000 in sales ($20,000 profit) is less financially robust than a larger business with a 5% net profit margin on $10 million in sales ($500,000 profit), in terms of absolute cash generated. Moreover, high profitability percentages don’t guarantee cash flow, as accounts receivable might be high. Always complement percentage analysis with an examination of absolute dollar amounts and a robust cash flow statement to ensure a holistic understanding of financial health.

Conclusion
Mastering the art of finding and interpreting percentages of sales is not merely an accounting exercise; it’s a strategic imperative for any business aiming for sustained growth and profitability. From understanding the fundamentals of gross and net profit margins to leveraging these insights for budgeting, forecasting, and competitive benchmarking, these financial ratios provide an unparalleled level of clarity into a company’s operational efficiency and financial health.
By integrating accurate calculations, utilizing appropriate financial tools, and applying a critical, contextual lens to the numbers, businesses can transform raw data into powerful intelligence. Avoiding common pitfalls—such as ignoring industry benchmarks or relying solely on percentages—ensures that decisions are well-informed and strategically sound. In an increasingly competitive landscape, the ability to dissect and understand the story told by your sales percentages is not just a valuable skill; it’s a non-negotiable component of effective financial management and a clear pathway to achieving your long-term business objectives. Embrace this essential financial analysis, and empower your business to navigate the complexities of the market with confidence and precision.
aViewFromTheCave is a participant in the Amazon Services LLC Associates Program, an affiliate advertising program designed to provide a means for sites to earn advertising fees by advertising and linking to Amazon.com. Amazon, the Amazon logo, AmazonSupply, and the AmazonSupply logo are trademarks of Amazon.com, Inc. or its affiliates. As an Amazon Associate we earn affiliate commissions from qualifying purchases.