
In the dynamic world of finance, understanding change is paramount. Whether you’re tracking personal spending, evaluating investment performance, or analyzing business financials, the ability to quantify reductions is a powerful skill. One of the most fundamental calculations for this purpose is finding the percentage decrease between two numbers. This metric provides a clear, standardized way to compare a current value against an older, larger value, revealing the magnitude of a decline in relative terms. Far more insightful than a simple absolute difference, percentage decrease puts changes into context, empowering individuals and businesses to make informed decisions, strategize effectively, and navigate financial landscapes with greater clarity.
From assessing a drop in a stock’s value to measuring the success of a cost-cutting initiative, knowing how to accurately calculate and interpret percentage decrease is an indispensable tool in any financial toolkit. It’s not merely a mathematical exercise; it’s a window into financial health, risk, and opportunity.
The Fundamentals of Percentage Decrease for Financial Analysis
At its core, percentage decrease is a measure of relative change, specifically a reduction from an initial value. Unlike an absolute decrease (which only tells you the raw numerical difference), the percentage decrease tells you how significant that drop is in proportion to the original amount. This relative perspective is crucial in finance, where the absolute value of a change can be misleading without context. A $100 drop from a $1000 investment is vastly different in impact than a $100 drop from a $10,000 investment, and percentage decrease accurately reflects this distinction.
Understanding the Core Concept and Its Financial Utility
Imagine you’re tracking your monthly expenses. If your grocery bill goes from $500 one month to $400 the next, you’ve saved $100. But is that a good saving? To truly understand its impact, you need to know what percentage of your original bill that $100 represents. This is where percentage decrease shines. It normalizes changes, allowing for easier comparison across different financial categories or over varying periods. For investors, it helps quantify losses or pullbacks; for businesses, it can illuminate revenue dips or efficiency gains in expense reduction. It provides a standardized language for discussing financial declines, making it easier to set goals, assess performance, and communicate financial health.
The Simple Formula Explained: A Step-by-Step Breakdown
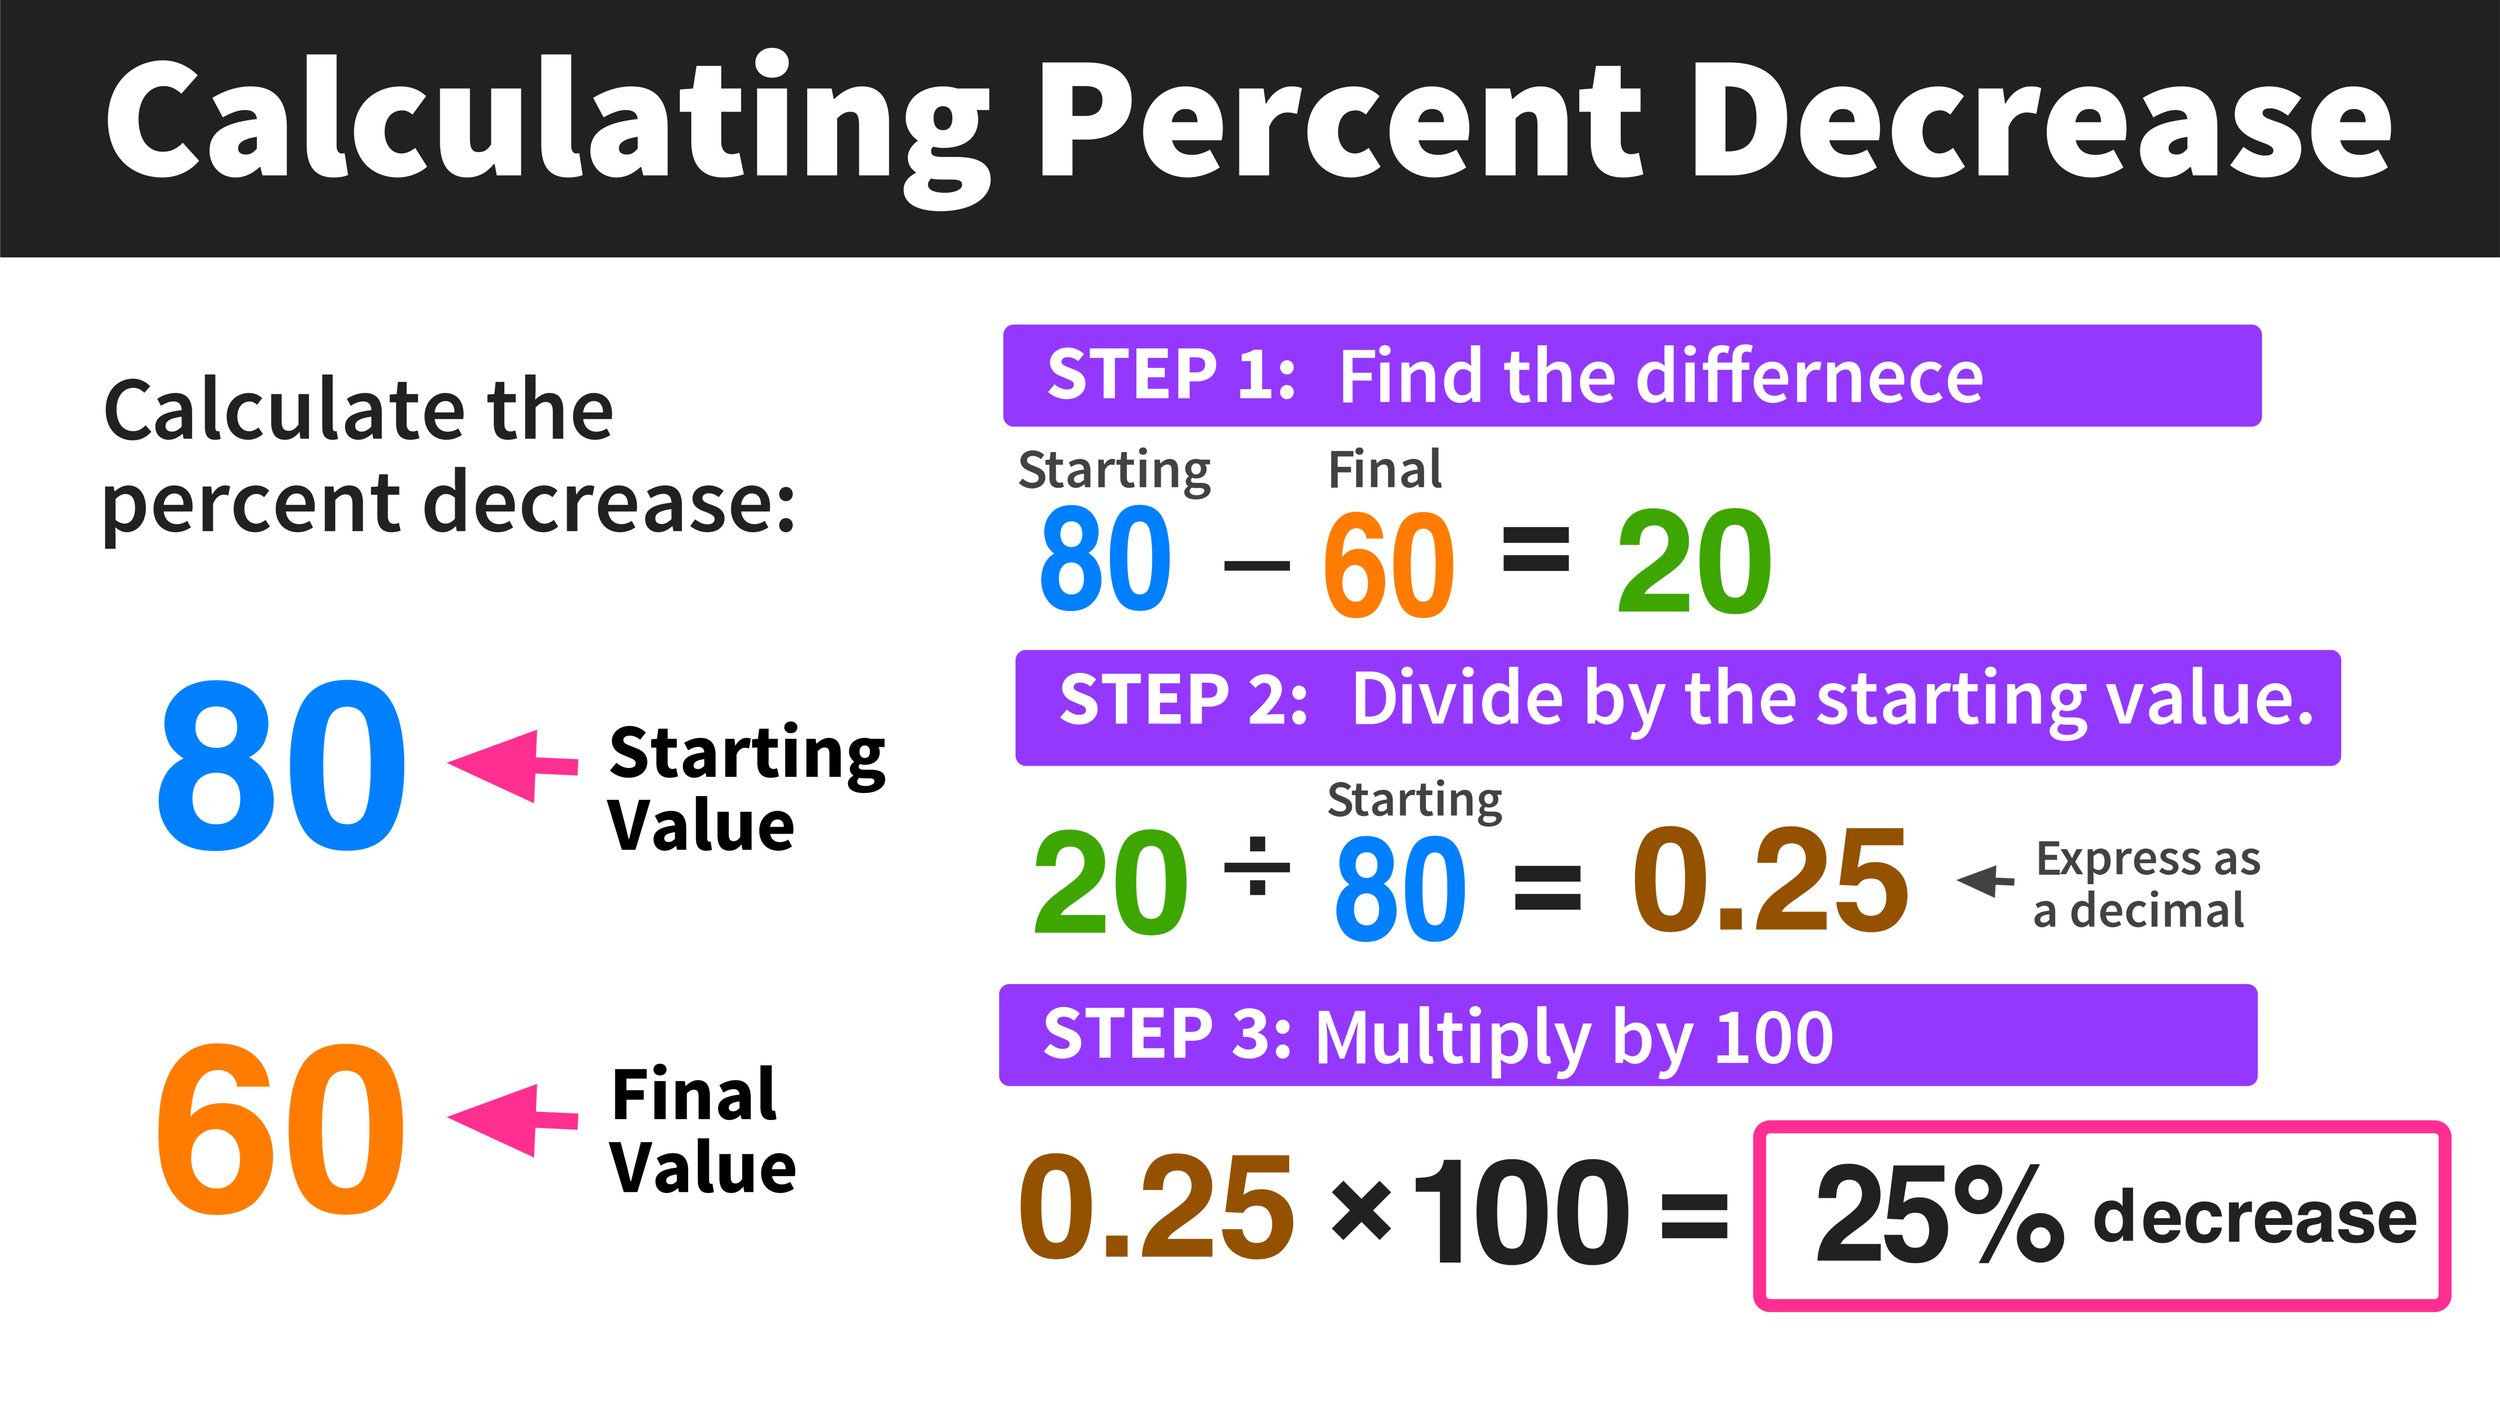
The formula for percentage decrease is straightforward and universally applicable:
Percentage Decrease = [(Original Value – New Value) / Original Value] * 100%
Let’s break down each component:
-
Original Value: This is your starting point, the initial or higher number you are comparing against. In financial terms, it could be last quarter’s revenue, last month’s budget, or a stock’s purchase price.
-
New Value: This is the subsequent or lower number after the decrease has occurred. It could be current quarter’s revenue, this month’s actual spending, or the stock’s current market price.
-
Original Value – New Value: This first step calculates the absolute amount of the decrease. It tells you the raw numerical difference between the starting and ending points.
-
Divide by Original Value: By dividing the absolute decrease by the original value, you convert the raw decrease into a decimal fraction, representing the proportion of the original value that was lost.
-
Multiply by 100%: Finally, multiplying by 100 converts this decimal fraction into a percentage, making it easily understandable and comparable.
A Basic Financial Example: Calculating an Investment Loss
Let’s say you invested in a stock at $50 per share. Over a period of market volatility, its price drops to $42 per share. To calculate the percentage decrease:
-
Original Value: $50
-
New Value: $42
-
Absolute Decrease: $50 – $42 = $8
-
Fractional Decrease: $8 / $50 = 0.16
-
Percentage Decrease: 0.16 * 100% = 16%
This stock has experienced a 16% decrease in value. This single number tells you more about the impact of the price drop than just knowing it fell by $8, especially if you were comparing it to another stock that fell by $8 but started at a much higher price.
Practical Applications in Personal Finance
For individuals managing their money, understanding percentage decrease is not just an academic exercise; it’s a vital skill that impacts daily financial well-being and long-term planning. It helps in assessing progress, identifying problem areas, and making smarter spending and saving decisions.
Budgeting and Expense Management: Tracking Spending Reductions
One of the most common and powerful applications of percentage decrease in personal finance is within budgeting. Regularly tracking your expenses allows you to identify areas where you can cut back. Percentage decrease helps quantify the success of these efforts.
- Example: If your monthly dining-out expense was $300 last month and you managed to reduce it to $210 this month, the percentage decrease is: (($300 – $210) / $300) * 100% = 30%. This 30% reduction is a clear indicator of success in your budgeting efforts, far more impactful than just knowing you saved $90. By tracking these percentages across various categories, you can pinpoint where your cost-cutting strategies are most effective.
Debt Reduction Strategies: Measuring Progress
For those on a debt repayment journey, percentage decrease is an excellent motivator and progress tracker. Whether it’s credit card debt, student loans, or a mortgage, seeing the principal balance shrink as a percentage of the original amount can provide significant encouragement.
- Example: You started with a credit card balance of $5,000. After six months of dedicated payments, the balance is now $3,500. The percentage decrease in your debt is: (($5,000 – $3,500) / $5,000) * 100% = 30%. This figure not only shows your progress but can also be used to project future repayment timelines based on maintaining a certain percentage reduction rate.
Saving Goals: Assessing How Much Spending Has Decreased
Achieving saving goals often involves consciously reducing spending in certain areas. Percentage decrease helps you monitor how effectively you’re making these cuts to free up funds for savings.
- Example: To save for a down payment, you aimed to reduce your discretionary spending from an average of $800 per month to $500. If you successfully hit $500, you’ve achieved a percentage decrease of: (($800 – $500) / $800) * 100% = 37.5%. This quantification allows you to adjust your strategies or celebrate reaching milestones towards your financial aspirations.

Analyzing Investments and Business Finance
Beyond personal budgets, percentage decrease is a critical metric for understanding the health and performance of investments and the overall financial standing of businesses. It provides a standardized way to evaluate declines and assess risk.
Investment Performance: Understanding Market Pullbacks and Portfolio Depreciation
In the world of investing, volatility is a constant. Stock prices, bond values, and entire portfolios can experience declines. Percentage decrease helps investors objectively measure these pullbacks and understand their impact.
-
Stock Price Drops: If a stock you own was trading at $100 and has fallen to $85, that’s a 15% decrease (($100 – $85) / $100 * 100%). This percentage is crucial for making decisions about holding, selling, or buying more, often in comparison to broader market indexes or sector performance.
-
Portfolio Depreciation: If your investment portfolio was valued at $100,000 at the start of the year and is now $92,000 due to market corrections, you’ve experienced an 8% decrease. Understanding this percentage helps in re-evaluating your asset allocation, risk tolerance, and long-term financial plan.
-
Commodity Value Decrease: For those invested in commodities like gold or oil, tracking percentage decrease is vital. A barrel of oil falling from $90 to $72 represents a 20% decrease, which directly impacts energy sector investments.
Business Finance Metrics: Analyzing Sales Declines and Profit Margin Erosion
For businesses, percentage decrease is a cornerstone of financial reporting and strategic planning. It helps identify weaknesses, evaluate the effectiveness of initiatives, and forecast future performance.
-
Sales Decline: If a company’s quarterly revenue drops from $1,000,000 to $850,000, that’s a 15% decrease. This metric can trigger investigations into marketing effectiveness, product relevance, or competitive pressures.
-
Profit Margin Erosion: A decrease in gross or net profit margin is a critical warning sign. If a gross profit margin falls from 40% to 35%, while this is an absolute 5 percentage point drop, the percentage decrease in the margin itself is ((40% – 35%) / 40%) * 100% = 12.5%. This indicates significant pressure on profitability, perhaps due to rising costs or pricing issues.
-
Expense Reduction Initiatives: Conversely, a business might aim for a percentage decrease in operating expenses. Reducing administrative costs from $50,000 to $40,000 represents a 20% decrease, indicating successful cost control.
Real Estate Market Analysis: Interpreting Property Value Depreciation
In real estate, property values can fluctuate. Understanding percentage decrease helps homeowners, investors, and analysts assess market trends and potential losses. If a property appraised at $400,000 last year is now valued at $380,000, it’s a 5% decrease, which is a key indicator for potential sellers or for calculating equity.
Leveraging Financial Tools for Accuracy and Efficiency
While the formula for percentage decrease is simple, applying it across numerous data points or integrating it into larger financial models requires efficient tools. Modern financial tools simplify these calculations, reducing the chance of human error and enabling deeper analysis.
Spreadsheet Software: Your Go-To Financial Calculator
Spreadsheet programs like Microsoft Excel or Google Sheets are indispensable for financial analysis. They allow you to input large datasets and automatically calculate percentage decreases.
- Basic Setup: If your Original Value is in cell A2 and your New Value is in cell B2, the formula to calculate percentage decrease would be
=(A2-B2)/A2. To display this as a percentage, simply format the cell as a percentage. This instantly calculates the decrease and can be dragged down to apply to hundreds or thousands of rows of data, making trend analysis remarkably efficient for personal budgets, investment tracking, or business sales figures.
Online Calculators and Financial Software: Simplifying Complex Analysis
For quick, one-off calculations, numerous online percentage decrease calculators are available. For more comprehensive financial management, specialized software (e.g., personal finance apps like Mint, investment tracking platforms, or business accounting software like QuickBooks) often incorporates these calculations automatically into their dashboards and reports. These tools not only compute the percentages but also present them visually, highlighting trends and anomalies, thereby saving time and providing immediate insights.
Interpreting the Results: Moving Beyond Just the Number
Calculating the percentage decrease is only half the battle. The real value comes from interpreting what that number signifies in its specific financial context.
-
Context is Key: A 10% decrease in investment value might be alarming, but a 10% decrease in your monthly utility bill is usually a positive outcome. Always relate the percentage decrease back to its original financial goal or benchmark.
-
Actionable Insights: What does the decrease tell you? Is it a minor blip, a significant trend, or an expected outcome? A large percentage decrease in sales might necessitate a marketing campaign overhaul, while a consistent small decrease in loan interest paid might mean you should explore refinancing.
-
Forecasting and Planning: Understanding historical percentage decreases can help in forecasting future scenarios. For instance, if you consistently see a seasonal percentage decrease in sales during Q3, you can plan your inventory and staffing accordingly.
Common Pitfalls and Key Considerations
While invaluable, percentage decrease calculations come with their own set of nuances and potential misinterpretations that financial practitioners must be aware of.
The Importance of the Original Value
The “Original Value” is the anchor of this calculation. Using the wrong starting point will lead to an incorrect and potentially misleading percentage decrease. Always ensure you are comparing the “New Value” to the true, most relevant “Original Value” for the period or scenario you are analyzing. For instance, comparing current stock price to its all-time high versus its price last month will yield very different, but equally valid, percentage decreases, each telling a different story.
Context Is King: Not All Decreases Are Negative
It’s vital to remember that a decrease is not inherently bad. As highlighted earlier, a percentage decrease in expenses, liabilities (like debt), or negative metrics (like customer complaints) is generally a positive financial outcome. Conversely, a percentage decrease in revenue, profit, or asset value is typically a concern. Always consider the financial goal or the nature of the metric when interpreting the result.
Avoiding Misinterpretation: Absolute vs. Relative Impact
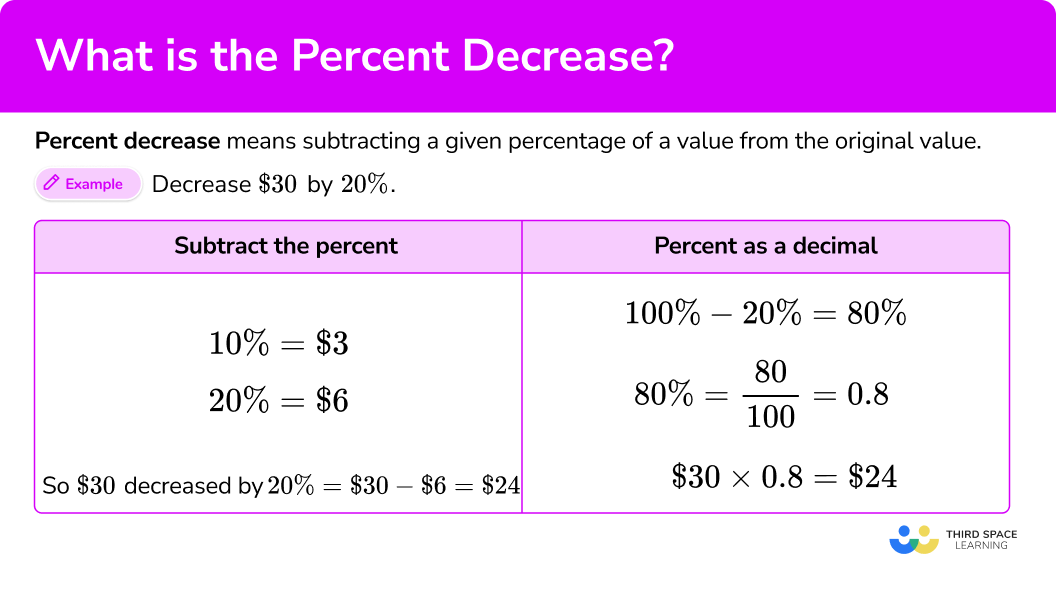
While percentage decrease offers valuable relative context, it’s also important not to entirely disregard the absolute numbers, especially for very large or very small figures. A 50% decrease in a $10 item is just $5, which might be negligible. A 1% decrease in a $10 million investment, however, is $100,000, which is very significant. Financial decision-making often requires a holistic view, combining both absolute and relative changes.
In conclusion, the ability to calculate and interpret percentage decrease is a foundational skill in personal and business finance. It empowers individuals to manage budgets, track investments, and reduce debt with greater precision. For businesses, it’s essential for monitoring sales, managing costs, and assessing overall financial health. By mastering this seemingly simple calculation and applying it thoughtfully with appropriate financial tools and contextual understanding, you unlock a deeper level of insight into monetary flows, enabling more strategic planning and ultimately, more informed and successful financial outcomes.
aViewFromTheCave is a participant in the Amazon Services LLC Associates Program, an affiliate advertising program designed to provide a means for sites to earn advertising fees by advertising and linking to Amazon.com. Amazon, the Amazon logo, AmazonSupply, and the AmazonSupply logo are trademarks of Amazon.com, Inc. or its affiliates. As an Amazon Associate we earn affiliate commissions from qualifying purchases.