
Understanding and calculating percent increase is a fundamental skill for anyone managing their finances, whether personal or business-related. It provides a clear, standardized way to measure growth, change, and performance over time, offering insights that absolute numbers alone cannot. From evaluating investment returns to tracking salary raises or monitoring business revenue growth, mastering this calculation is an essential component of financial literacy and strategic decision-making.
Understanding the Essence: What is Percent Increase?
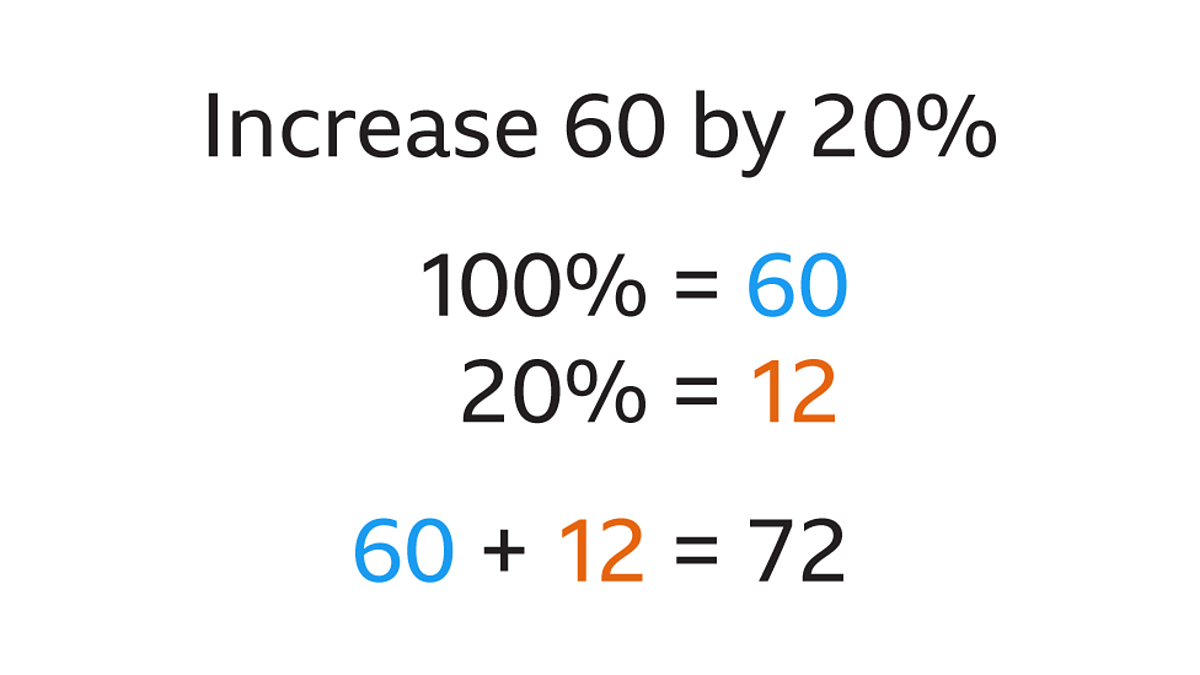
Percent increase is a mathematical concept used to describe the magnitude of change between an initial value and a final value when the final value is greater than the initial value. Expressed as a percentage, it quantifies growth, progress, or appreciation relative to the starting point. This metric is invaluable because it normalizes changes, allowing for meaningful comparisons even when the base numbers vary significantly.
Defining the Metric for Financial Growth
In the realm of money, percent increase is the language of progress. It tells you by what proportion something has grown. For instance, if your investment portfolio grew from $10,000 to $12,000, the absolute increase is $2,000. However, stating it as a 20% increase ($2,000 / $10,000) provides a more insightful perspective. This percentage allows you to compare the performance of this investment against another that might have started at a different value, say, one that grew from $100 to $110, an absolute increase of $10 but still a 10% increase. The relative measure offers a clearer picture of efficiency and growth rate.
Why This Simple Calculation is Crucial for Your Finances
The ability to calculate percent increase empowers you to make informed financial decisions. Without it, you might misinterpret the significance of changes in your financial landscape.
-
For Personal Finance: It helps you assess salary raises, understand the impact of inflation on your expenses, track the appreciation of assets like real estate, or evaluate the growth of your savings account. A 3% raise might sound small in absolute dollars, but understanding it as a percent increase helps you compare it against the inflation rate to gauge if your purchasing power is actually improving.
-
For Investing: It’s the bedrock of performance measurement. Investors constantly calculate the percent increase in stock prices, mutual fund values, or total portfolio worth to determine returns on investment (ROI) and compare different opportunities. A stock rising from $50 to $75 represents a significant 50% increase, guiding decisions on holding, buying more, or selling.
-
For Business Finance: Companies meticulously track percent increase in revenue, profit margins, market share, and customer acquisition to measure success, identify trends, and strategize for future growth. A 15% increase in quarterly sales signals a different trajectory than a 2% increase, influencing operational adjustments and marketing efforts.
In essence, percent increase translates raw data into actionable intelligence, making it an indispensable tool for financial analysis.
The Fundamental Formula: A Step-by-Step Guide
Calculating percent increase is straightforward once you understand the core formula and the values it requires. The process involves identifying your initial and final figures, finding the absolute difference, and then expressing that difference as a proportion of the initial value.
Identifying Your Starting and Ending Values
Before you can apply any formula, you need two critical pieces of information:
-
Starting Value (or Initial Value): This is the original number or amount you are measuring from. It represents the baseline.
-
Ending Value (or Final Value): This is the new number or amount after the change has occurred. It represents the current or subsequent state.
For example, if you want to calculate the percent increase of your rent from last year to this year, last year’s rent is your starting value, and this year’s rent is your ending value.
The Calculation: ((Ending Value – Starting Value) / Starting Value) * 100
Here’s the step-by-step breakdown of the formula:
-
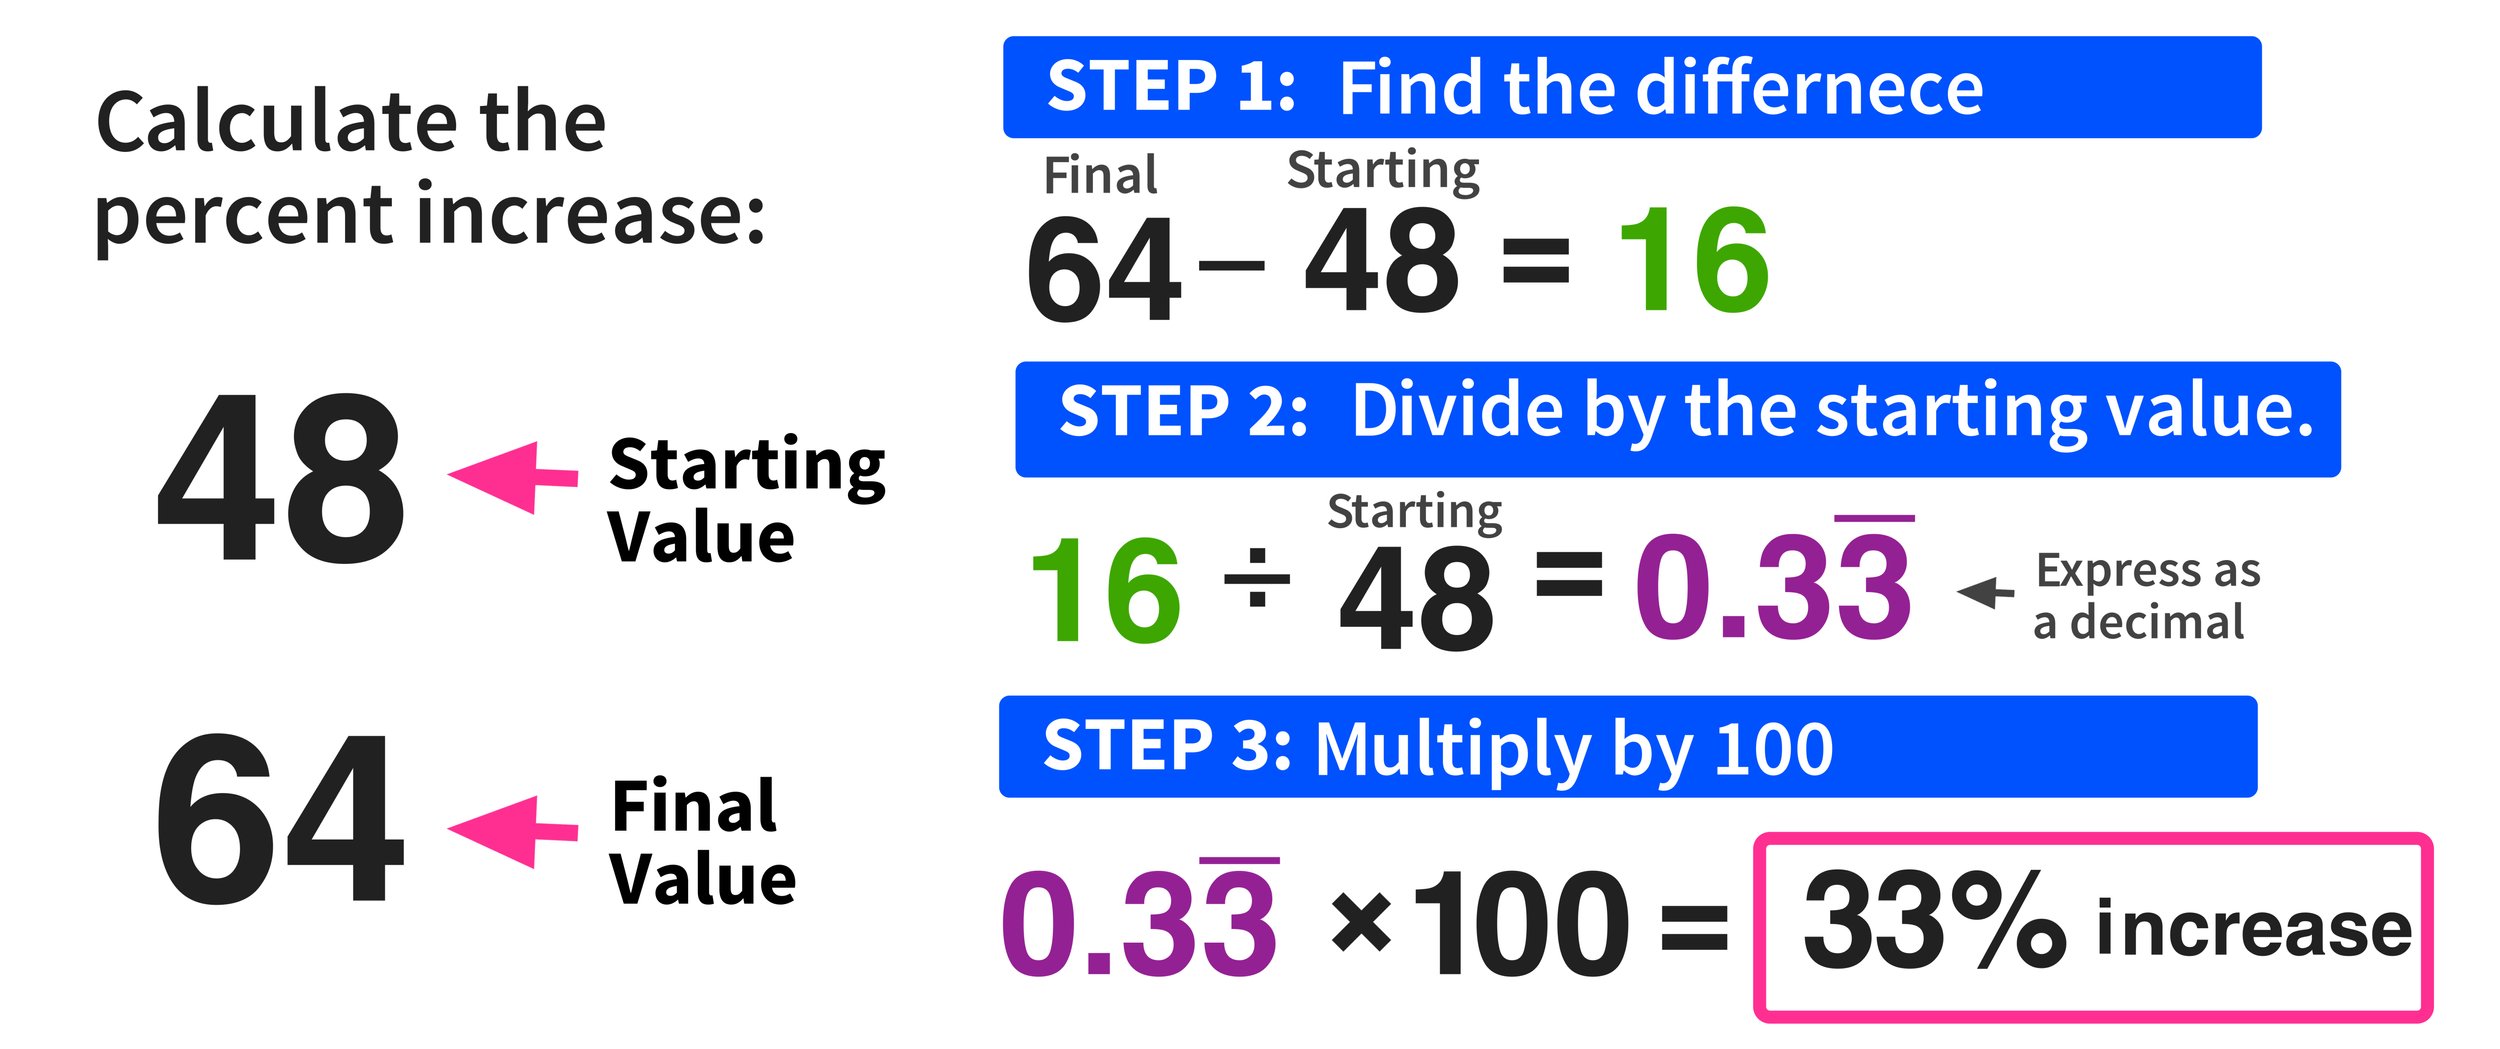
Find the absolute difference: Subtract the starting value from the ending value. This gives you the raw amount of the increase.
Difference = Ending Value - Starting Value
-
Divide by the starting value: Divide the difference you calculated in step 1 by the original starting value. This converts the absolute increase into a decimal ratio relative to the starting point.
Ratio = Difference / Starting Value
-
Multiply by 100: Multiply the decimal ratio by 100 to convert it into a percentage.
Percent Increase = Ratio * 100
Let’s put this into practice with a couple of financial examples.
Example 1: Personal Salary Growth
Imagine your annual salary increased from $50,000 last year to $53,000 this year.
-
Starting Value: $50,000
-
Ending Value: $53,000
-
Difference: $53,000 – $50,000 = $3,000
-
Ratio: $3,000 / $50,000 = 0.06
-
Percent Increase: 0.06 * 100 = 6%
Your salary increased by 6%.
Example 2: Investment Portfolio Appreciation
Suppose your investment portfolio was valued at $100,000 at the beginning of the year and grew to $115,000 by year-end.
-
Starting Value: $100,000
-
Ending Value: $115,000
-
Difference: $115,000 – $100,000 = $15,000
-
Ratio: $15,000 / $100,000 = 0.15
-
Percent Increase: 0.15 * 100 = 15%
Your investment portfolio appreciated by 15%.
These examples demonstrate how consistently applying the formula reveals clear, comparable growth metrics.
Real-World Applications Across Your Financial Landscape
The utility of percent increase extends across virtually every facet of financial management. From personal budgeting to sophisticated investment analysis and corporate financial reporting, this calculation provides essential insights into performance and trends.
Personal Finance: Tracking Income, Expenses, and Debt
For individuals, understanding percent increase is fundamental to managing personal wealth effectively.
-
Salary Raises: When negotiating a raise or evaluating a job offer, knowing the percent increase helps you gauge its real impact on your purchasing power. A $5,000 raise on a $50,000 salary (10%) is more significant than a $5,000 raise on a $100,000 salary (5%).
-
Inflation Impact on Spending: To truly understand how much more expensive your daily life is becoming, you can calculate the percent increase in the cost of goods and services. If your grocery bill goes from $100 to $105 per week, that’s a 5% increase in your food costs, helping you adjust your budget.
-
Mortgage Interest Rate Changes: If you have an adjustable-rate mortgage, tracking the percent increase in your interest rate is crucial for anticipating changes in your monthly payments.
-
Savings and Investments: Beyond the portfolio example, tracking the percent increase in your savings account balance or specific retirement funds offers a clear view of your financial growth over time.
Investing: Measuring Returns and Performance
In the investment world, percent increase is the primary metric for evaluating success and comparing different assets.
-
Stock Gains: When a stock you own rises from $100 to $120, that’s a 20% increase, indicating a strong return on your initial capital for that specific holding.
-
Mutual Fund Growth: Investment managers report performance as a percent increase over various periods (e.g., year-to-date, 1-year, 5-year) to allow investors to compare funds effectively.
-
Cryptocurrency Volatility: Given their rapid price fluctuations, percent increase (and decrease) are constantly used to track and report the dramatic shifts in cryptocurrency values.
-
Real Estate Appreciation: The value of a property bought for $300,000 that is now worth $360,000 has seen a 20% increase, a key indicator for real estate investors.

Business Finance: Assessing Growth and Profitability
Businesses rely heavily on percent increase to measure operational success, financial health, and strategic effectiveness.
-
Revenue Growth: A company reporting a 10% increase in quarterly revenue signals expansion and market acceptance of its products or services.
-
Profit Margin Expansion: If a company’s net profit margin increases from 10% to 12%, that represents a 20% increase in the margin itself ((12-10)/10 * 100), indicating improved efficiency or pricing power.
-
Cost Escalation: Tracking the percent increase in raw material costs, labor expenses, or operational overhead helps businesses identify areas for cost control and efficiency improvements.
-
Customer Base Expansion: A 25% increase in the number of active subscribers or clients is a critical metric for subscription-based businesses.
Economic Indicators: Understanding Market Shifts
On a broader scale, percent increase is used to interpret macroeconomic trends and government data.
-
GDP Growth: The growth rate of a country’s Gross Domestic Product (GDP) is expressed as a percent increase, indicating economic expansion or contraction.
-
Inflation Rates: The Consumer Price Index (CPI) measures the average change over time in the prices paid by urban consumers for a market basket of consumer goods and services. Its percent increase signifies the rate of inflation, directly impacting purchasing power.
-
Interest Rate Hikes: Central banks communicate changes in benchmark interest rates as percent increases (or decreases), which have ripple effects across lending, borrowing, and investment markets.
Across all these applications, percent increase provides a standardized, intuitive metric for understanding change and making data-driven financial decisions.
Navigating Nuances and Avoiding Common Misinterpretations
While the basic calculation of percent increase is straightforward, there are subtleties and common pitfalls that can lead to misinterpretations if not properly understood. Being aware of these nuances is crucial for accurate financial analysis.
The Difference Between Percent Increase and Absolute Increase
It’s vital to distinguish between an absolute increase and a percent increase. An absolute increase is simply the raw numerical difference between the ending and starting values (e.g., $100). A percent increase expresses this raw difference as a proportion of the starting value.
Consider two investments:
-
Investment A: Goes from $100 to $200. Absolute increase = $100. Percent increase = 100%.
-
Investment B: Goes from $1,000 to $1,100. Absolute increase = $100. Percent increase = 10%.
Both have the same absolute increase, but Investment A clearly had a far greater relative growth. Focusing solely on absolute numbers can be misleading, especially when comparing items with vastly different starting values. Percent increase provides the context.
When to Use Percent Change vs. Basis Points
While percent change is widely used, in finance, particularly when discussing interest rates, bond yields, or very small changes, basis points (bps) are often preferred. One basis point is equal to one-hundredth of one percent (0.01%), or 0.0001.
-
If an interest rate increases from 3.00% to 3.25%, you could say it increased by 0.25 percentage points. However, it’s more precise to say it increased by 25 basis points.
-
Using percent increase on the rate itself would be ((3.25 – 3.00) / 3.00) * 100 = 8.33%. This measures the percentage change of the rate, not the absolute change in the rate. Be clear about what you are intending to convey. For most everyday financial calculations of growth, percent increase is appropriate.
Annualized vs. Cumulative Percent Increase
It’s important to distinguish between increases over a specific period and those annualized to a yearly rate.
-
Cumulative Percent Increase: This is the total percent increase over a specified duration, which might be less or more than a year. For example, an investment might have a 3-month cumulative return of 5%.
-
Annualized Percent Increase: This adjusts the cumulative return to an equivalent annual rate, allowing for comparisons of performance over different timeframes. If that 5% return happened over 3 months, the annualized return would be approximately 21.55% (calculated using compounding). Always clarify the time period when discussing percent increases in investment returns.
The Impact of Negative Starting Values
The standard formula for percent increase is designed for situations where both the starting and ending values are positive, and the ending value is greater than the starting value.
If the starting value is zero, the division by zero in the formula makes the calculation undefined. If the starting value is negative, the interpretation of percent increase becomes complex and often not directly comparable or meaningful using the standard formula. In such cases, it’s usually more appropriate to discuss the absolute change or the magnitude of change in relation to context, rather than a “percent increase.” For example, if a debt goes from -$100 to -$50, this is a positive absolute change of $50, but calculating a “percent increase” might be confusing.
Understanding these nuances ensures that your interpretation of percent increases is accurate and contextually relevant, leading to better financial analysis and decision-making.
Leveraging Technology: Financial Tools for Effortless Calculation
While the formula for percent increase is simple enough for manual calculation, modern financial tools can automate this process, save time, and reduce errors, especially when dealing with large datasets or frequent calculations. From ubiquitous spreadsheet software to specialized online calculators, leveraging technology enhances your financial analytical capabilities.
Spreadsheet Software: Excel and Google Sheets
Spreadsheets are arguably the most powerful and versatile tools for financial calculations, including percent increase. They allow you to organize data, apply formulas to entire columns or rows, and visualize trends.
The formula for percent increase in Excel or Google Sheets directly mirrors the mathematical formula:
((Ending Value - Starting Value) / Starting Value) * 100
Let’s assume:
-
Your Starting Value is in cell
A2. -
Your Ending Value is in cell
B2.
The formula you would enter into a cell (e.g., C2) to calculate the percent increase would be:
=((B2-A2)/A2)*100
Example:
| | A (Starting Value) | B (Ending Value) | C (Percent Increase) |
|—|——————–|——————|———————-|
| 1 | | | |
| 2 | $50,000 | $53,000 | =((B2-A2)/A2)*100 |
| 3 | $100,000 | $115,000 | =((B3-A3)/A3)*100 |
After entering the formula in C2 and C3, the cells would display 6 and 15 respectively. You can then format these cells as percentages (e.g., 6.00%, 15.00%) directly within the spreadsheet software, often by just changing the cell format and not multiplying by 100 in the formula itself (i.e., =(B2-A2)/A2).
Spreadsheets are invaluable for:
-
Tracking portfolio performance: Update investment values regularly and instantly see percent changes.
-
Budget analysis: Monitor percent increases in various expense categories over months or years.
-
Business metrics: Automatically calculate revenue growth, profit margin changes, and other key performance indicators.
Online Calculators and Financial Apps
For quick, one-off calculations or if you don’t need a full spreadsheet setup, a plethora of online calculators and financial apps are readily available.
-
Dedicated Percent Change Calculators: A simple web search for “percent increase calculator” will yield numerous tools where you just input the starting and ending values, and it instantly provides the result.
-
Investment Platform Tools: Many online brokerage accounts and investment tracking apps include built-in features to show the percent increase (or decrease) of your holdings, often with options for various timeframes.
-
Budgeting Apps: Modern personal finance apps can often categorize expenses and report the percent increase in your spending for specific categories month-over-month or year-over-year.
These tools are convenient for rapid analysis and can be accessed from nearly any device with an internet connection.
The Power of Automation for Continuous Monitoring
The real power of leveraging technology lies in automation. Once a formula is set up in a spreadsheet or a financial app is configured, it can continuously monitor and report percent increases as new data becomes available. This frees you from repetitive manual calculations, allowing you to focus on interpreting the data and making strategic financial decisions. Automated reporting means you’re always up-to-date on your financial growth, whether it’s your personal net worth, your investment portfolio, or your business’s bottom line.
aViewFromTheCave is a participant in the Amazon Services LLC Associates Program, an affiliate advertising program designed to provide a means for sites to earn advertising fees by advertising and linking to Amazon.com. Amazon, the Amazon logo, AmazonSupply, and the AmazonSupply logo are trademarks of Amazon.com, Inc. or its affiliates. As an Amazon Associate we earn affiliate commissions from qualifying purchases.