
In the landscape of business finance, understanding the relationship between costs, sales volume, and profit is not just a secondary administrative task; it is the cornerstone of strategic decision-making. Cost-Volume-Profit (CVP) analysis, often referred to as break-even analysis, is a financial modeling technique that helps managers and business owners understand how changes in these variables affect their bottom line. By dissecting the interplay between fixed costs, variable costs, selling prices, and the quantity of goods sold, CVP analysis provides a roadmap for achieving profitability and maintaining financial health.
For any organization—from a fledgling startup to a multinational corporation—mastering CVP analysis is essential for answering critical questions: How many units must we sell to cover our expenses? How will a 10% reduction in price affect our operating income? Can we afford a planned increase in our advertising budget? By providing a clear mathematical framework for these queries, CVP analysis transforms raw accounting data into actionable financial intelligence.
Understanding the Fundamentals of CVP Analysis
At its core, CVP analysis is built upon the classification of costs based on their behavior relative to production or sales activity. Unlike traditional financial accounting, which often focuses on historical reporting for external stakeholders, CVP is a tool of managerial finance designed for internal planning and forecasting.
Fixed vs. Variable Costs
To perform a CVP analysis, a business must first categorize its expenses into two primary types: fixed costs and variable costs.
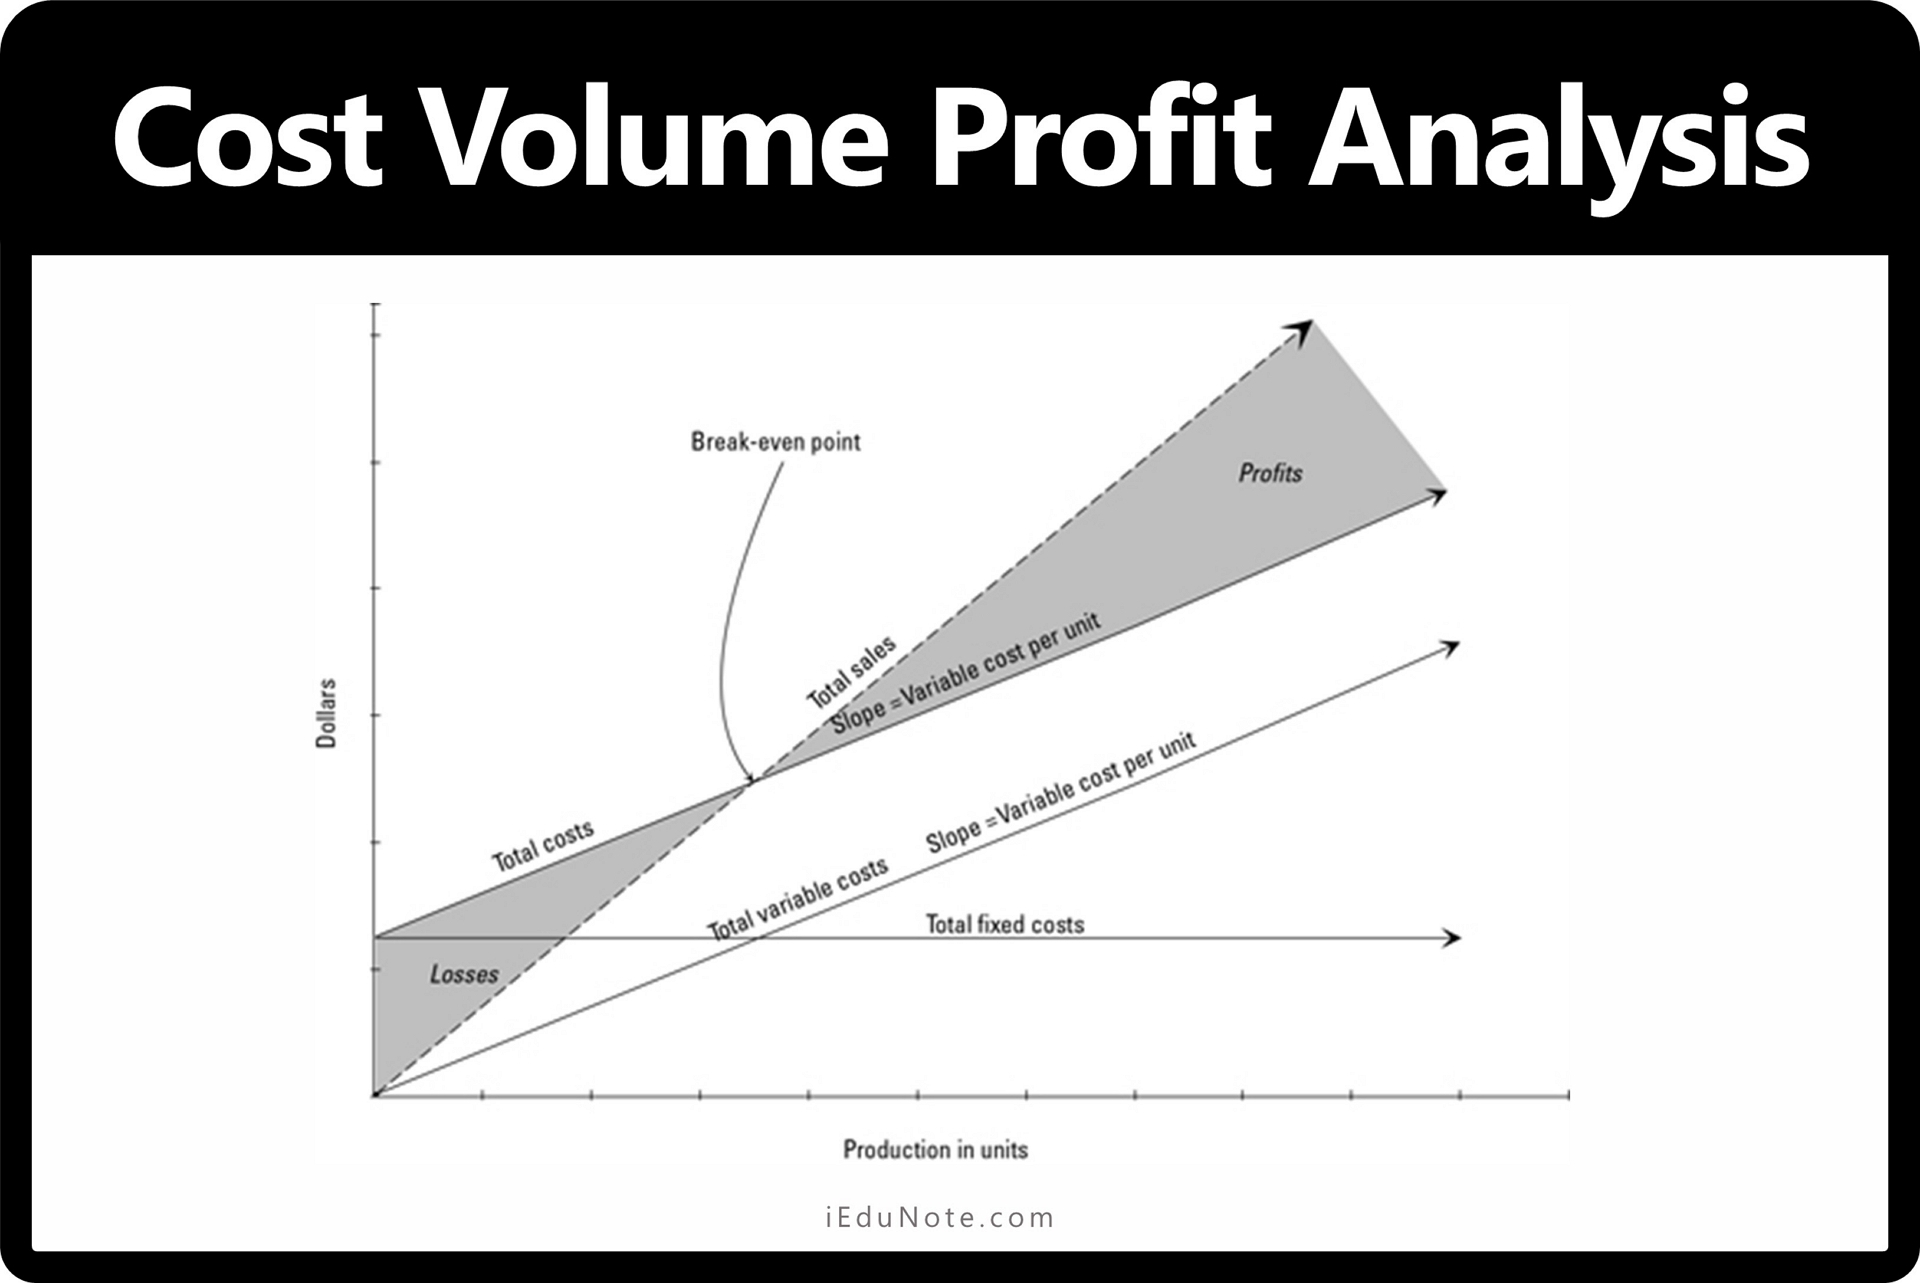
Fixed costs are those expenses that do not change in total, regardless of the level of production or sales volume, at least within a relevant range of activity. These typically include rent, insurance, salaries of administrative staff, and depreciation of equipment. Because these costs remain constant, the fixed cost per unit decreases as production increases, creating economies of scale.
Variable costs, conversely, fluctuate in direct proportion to changes in activity levels. Common examples include raw materials, direct labor involved in production, and sales commissions. If a company produces zero units, its variable costs are zero. As production ramps up, these costs climb linearly. The variable cost per unit remains constant, but the total variable cost grows with volume.
Contribution Margin: The Engine of Profitability
The most critical metric derived from CVP analysis is the contribution margin. This represents the amount of revenue remaining after all variable costs have been subtracted from sales. It is essentially the “pool” of money available to cover fixed costs and, once those are satisfied, to generate profit.
The contribution margin can be expressed in three ways:
- Total Contribution Margin: Total Sales minus Total Variable Costs.
- Contribution Margin Per Unit: Selling Price per unit minus Variable Cost per unit.
- Contribution Margin Ratio: Contribution Margin divided by Total Sales (expressed as a percentage).
Understanding the contribution margin is vital because it reveals the true profitability of individual products or services. A product might have a high selling price, but if its variable costs are equally high, its contribution toward covering the firm’s fixed overhead is minimal.
Calculating the Break-Even Point and Target Income
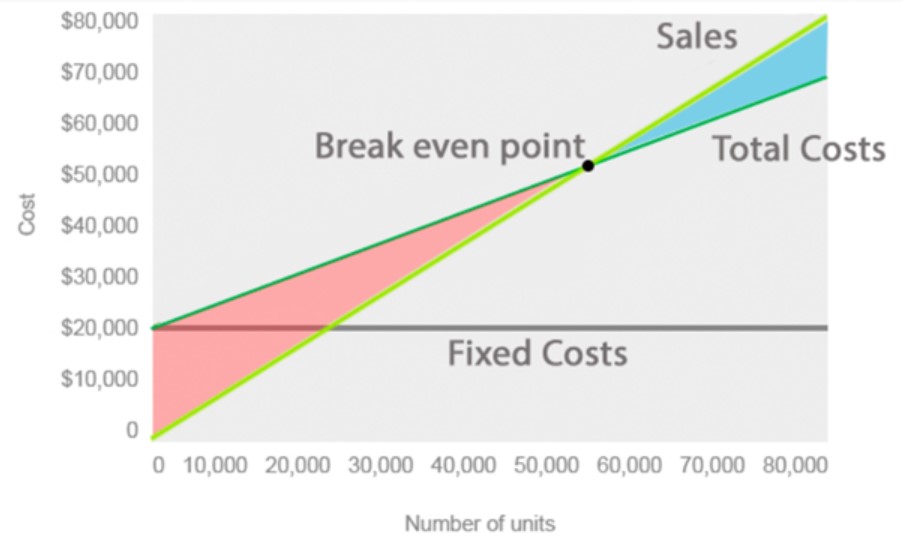
The primary application of CVP analysis is determining the break-even point—the stage at which total revenues exactly equal total costs, resulting in zero profit and zero loss. Identifying this threshold is a fundamental milestone for any business venture, as it represents the minimum level of activity required to remain solvent.
The Break-Even Formula
The break-even point can be calculated in units or in total sales dollars. To find the break-even point in units, the formula is:
Break-Even Units = Total Fixed Costs / Contribution Margin per Unit
To find the break-even point in sales dollars, the formula is:
Break-Even Sales = Total Fixed Costs / Contribution Margin Ratio
For example, if a company has $100,000 in fixed costs and sells a product for $50 with a variable cost of $30, the contribution margin per unit is $20. The break-even point would be 5,000 units ($100,000 / $20). Any unit sold beyond 5,000 contributes directly to the company’s profit at a rate of $20 per unit.
Planning for Specific Profit Targets
Beyond merely breaking even, CVP analysis is used to set sales targets necessary to achieve a specific net income. This is known as target profit analysis. By treating the desired profit as an additional “cost” that needs to be covered, managers can determine the required sales volume.

The formula for target profit in units is:
Target Sales (Units) = (Total Fixed Costs + Desired Profit) / Contribution Margin per Unit
This forward-looking approach allows finance teams to align their sales quotas and marketing strategies with the company’s broader financial goals.
The Margin of Safety
The margin of safety is a crucial risk assessment metric within CVP analysis. It measures the difference between actual (or budgeted) sales and the break-even sales volume. In essence, it tells a business how much its sales can drop before it begins to incur a loss.
A high margin of safety suggests a “cushion” that protects the business during economic downturns or periods of increased competition. Conversely, a low margin of safety indicates a precarious financial position where even a minor dip in demand could lead to insolvency. This metric is often expressed as a percentage:
Margin of Safety % = (Current Sales – Break-Even Sales) / Current Sales
The Assumptions Underlying CVP Models
While CVP analysis is a powerful tool, its accuracy depends on several simplifying assumptions. In the complex world of business finance, these assumptions rarely hold perfectly, but they are necessary to create a workable model for decision-making.
Linear Relationships and Constant Pricing
CVP analysis assumes that both total costs and total revenues behave in a linear fashion. It presumes that the selling price per unit will remain constant regardless of the volume sold. In reality, businesses often offer bulk discounts or face price pressure at higher volumes. Similarly, the model assumes that variable costs per unit remain the same. However, companies often benefit from “learning curve” efficiencies or volume discounts from suppliers as production increases.
Product Mix Stability
Most businesses sell more than one product, each with its own selling price and variable cost structure. CVP analysis assumes that the “sales mix”—the relative proportion of each product sold—remains constant. If a company sells a mix of high-margin and low-margin items, a shift in consumer preference toward the low-margin product could lead to a loss, even if total sales volume remains the same as predicted. Financial managers must frequently update their CVP models to reflect shifts in the product mix to maintain the relevance of their forecasts.
Inventory and Production Levels
Another standard assumption is that the number of units produced equals the number of units sold. This implies that there are no significant changes in inventory levels. In practice, if a company produces significantly more than it sells, some fixed manufacturing costs are “trapped” in inventory on the balance sheet rather than being expensed on the income statement (under absorption costing). CVP analysis typically operates under the assumption of variable costing, where all fixed manufacturing overhead is treated as a period expense.
Leveraging CVP for Strategic Decision-Making
The true value of CVP analysis lies in its ability to facilitate “what-if” scenarios. It allows financial leaders to simulate the outcomes of various strategic choices before committing resources.
Pricing Decisions and Competitive Positioning
CVP analysis is indispensable when evaluating pricing strategies. If a competitor lowers their prices, a firm can use CVP to determine if they should match the price cut. By analyzing the contribution margin, the firm can see how much additional volume would be required to maintain the same level of profit at a lower price point. Often, the analysis reveals that a slight price decrease requires an impossibly high jump in volume to stay profitable, leading the firm to focus on value-added differentiation instead of a price war.
Optimizing the Product Mix
In scenarios where resources like machine hours, labor, or raw materials are limited, CVP analysis helps determine the most profitable use of those constraints. By calculating the “contribution margin per unit of constraint” (e.g., profit per machine hour), managers can prioritize the production of items that generate the highest return relative to the limited resource, thereby maximizing total organizational profit.
Make-or-Buy Decisions
Strategic finance often involves deciding whether to manufacture a component in-house or outsource it to a third party. CVP analysis provides the framework for this “make-or-buy” decision. By comparing the incremental variable costs of internal production and the avoidable fixed costs against the purchase price from an external supplier, a company can make a data-driven choice that optimizes its cost structure.
Ultimately, Cost-Volume-Profit analysis is more than just a set of formulas; it is a mindset of fiscal discipline and strategic foresight. By understanding the levers of cost and volume, business leaders can navigate the complexities of the market with confidence, ensuring that every operational move is a calculated step toward long-term financial success.
aViewFromTheCave is a participant in the Amazon Services LLC Associates Program, an affiliate advertising program designed to provide a means for sites to earn advertising fees by advertising and linking to Amazon.com. Amazon, the Amazon logo, AmazonSupply, and the AmazonSupply logo are trademarks of Amazon.com, Inc. or its affiliates. As an Amazon Associate we earn affiliate commissions from qualifying purchases.