
For centuries, astronomers and enthusiasts alike have turned their gaze toward the largest planet in our solar system, Jupiter, to witness one of the most enduring mysteries of the cosmos: the Great Red Spot. While the answer to which planet hosts this massive storm is simple, the technology required to observe, analyze, and understand this atmospheric phenomenon is anything but. The Great Red Spot is not merely a visual landmark; it is a complex laboratory for fluid dynamics, high-resolution imaging, and advanced sensor technology.
To understand the Great Red Spot today is to understand the cutting-edge intersection of aerospace engineering and data science. From the early days of grainy telescopic observations to the hyper-detailed, AI-enhanced imagery provided by the Juno spacecraft, the story of this Jovian storm is a testament to the rapid evolution of imaging hardware and computational analysis.
The Technological Evolution of Jovian Observation
The journey to understand Jupiter’s Great Red Spot began with rudimentary optics. When Gian Domenico Cassini or Robert Hooke first noted a “permanent spot” in the 17th century, they were utilizing the peak technology of their time—hand-ground glass lenses that provided minimal magnification. Today, we observe the Great Red Spot through a sophisticated stack of digital sensors, infrared spectrometers, and orbital hardware that operates millions of miles from Earth.
From Optical Lenses to CCD Sensors
The transition from analog observation to digital data collection revolutionized our view of the planet. Modern telescopes, both ground-based and space-borne, utilize Charge-Coupled Devices (CCDs) and Complementary Metal-Oxide-Semiconductor (CMOS) sensors that are far more sensitive than the human eye. These sensors allow scientists to capture light across various wavelengths, revealing that the “Red” spot is actually a multi-layered storm system with varying chemical compositions.
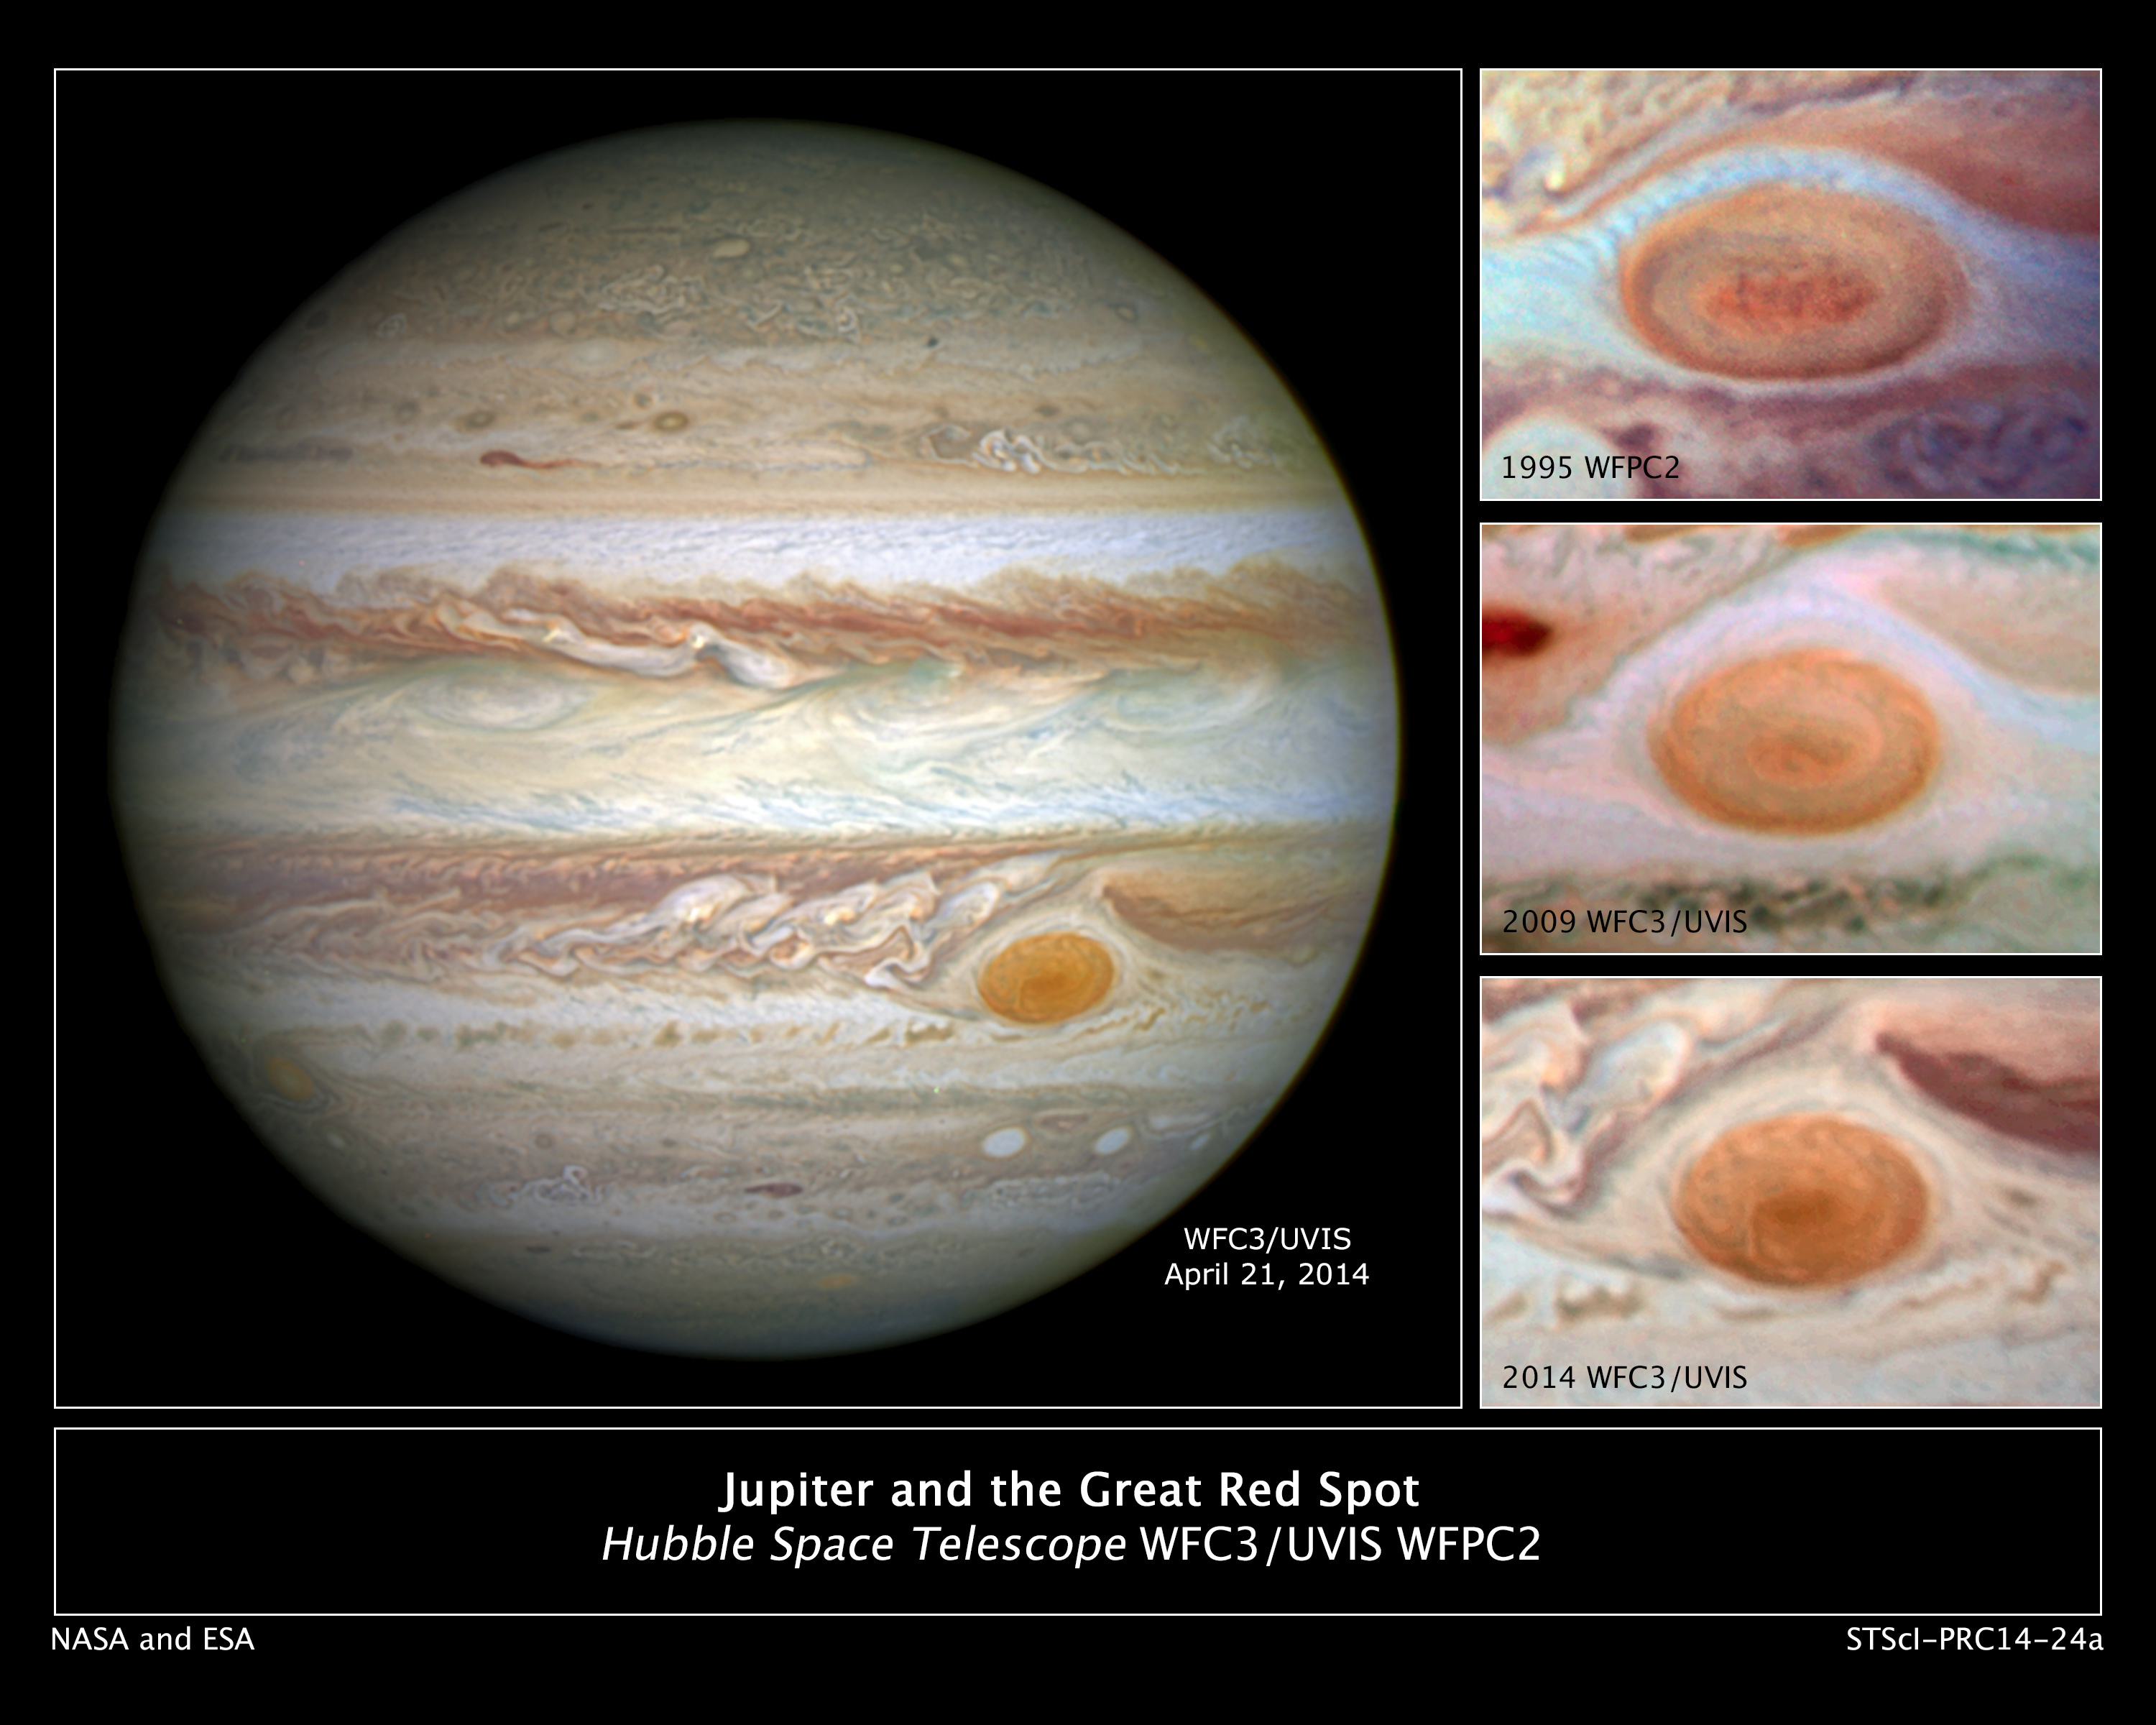
The Hubble Space Telescope has played a critical role in this technological progression. By using its Wide Field Camera 3 (WFC3), NASA can track the shrinking size and changing color of the spot over decades. This longitudinal data is processed using specialized software that compensates for atmospheric distortion, providing a clear high-definition record of the storm’s evolution.
The Juno Mission: Sensors at the Edge
The most significant leap in our technological understanding of the Great Red Spot comes from the Juno spacecraft. Launched in 2011 and arriving at Jupiter in 2016, Juno carries an array of instruments designed to peer beneath the clouds. The “JunoCam,” a high-resolution visible-light camera, was specifically designed to capture the intricate swirls of the Jovian atmosphere.
However, the real technological breakthrough lies in Juno’s Microwave Radiometer (MWR). This instrument allows scientists to “see” 200 miles below the visible cloud tops of the Great Red Spot. By measuring microwave radiation, the MWR provides data on the storm’s depth, revealing that the roots of this massive vortex extend far deeper into the planet than previously theorized. This type of remote sensing hardware represents the pinnacle of current space-exploration tech, operating in an environment of extreme radiation that would fry standard consumer electronics in seconds.
AI and Machine Learning in Planetary Image Processing
The raw data transmitted from Jupiter to Earth is not the beautiful, swirling crimson image we see in magazines. It arrives as packets of digital noise, radio waves, and raw sensor readings. The process of turning this data into a coherent visual representation—and more importantly, a scientific model—relies heavily on artificial intelligence and advanced image-processing algorithms.
Computational Photography and Noise Reduction
Deep-space communication is inherently lossy. Due to the vast distances involved, the signal-to-noise ratio is a constant challenge for engineers. To combat this, NASA utilizes sophisticated error-correction algorithms and AI-driven denoising tools. These programs can identify patterns in the data, distinguishing between actual atmospheric features of the Great Red Spot and digital artifacts caused by cosmic radiation or transmission interference.
Furthermore, computational photography techniques like “lucky imaging” are used for ground-based observations. This involves taking thousands of short-exposure frames and using software to select only the ones least affected by Earth’s atmospheric turbulence. The frames are then stacked and aligned using AI to create a single, high-resolution image that rivals the clarity of space-based telescopes.
Predictive Modeling and Fluid Dynamics
The Great Red Spot is a giant anticyclonic storm, and understanding its behavior requires massive computational power. Researchers use supercomputers to run fluid dynamics simulations that model the Jovian atmosphere. By feeding historical data into machine learning models, scientists can predict how the storm might evolve.
These AI models analyze the interaction between the Great Red Spot and the smaller storms that frequently collide with it. By observing these “meals”—where the Great Red Spot absorbs smaller vortices—AI can help determine if the spot is actually shrinking toward extinction or simply entering a new phase of its lifecycle. This level of predictive analysis would be impossible without the integration of modern software architecture and high-performance computing.

The Hardware of Deep Space Communication
One of the most overlooked aspects of the technology used to study the Great Red Spot is the infrastructure required to get the data back to Earth. The “Downlink” is a feat of engineering that bridges the 500-million-mile gap between Jupiter and our home planet.
The Deep Space Network (DSN)
The Deep Space Network is a global array of giant radio antennas managed by NASA’s Jet Propulsion Laboratory (JPL). To receive data from probes like Juno, the DSN must be incredibly precise. The hardware involves massive 70-meter (230-foot) diameter dishes that utilize cryogenic cooling to reduce thermal noise in the receivers.
When Juno passes over the Great Red Spot, it collects gigabytes of data. This information is compressed using advanced algorithms to maximize the limited bandwidth available for deep-space transmission. The DSN then captures these incredibly faint signals, which are often no more powerful than the energy of a refrigerator lightbulb by the time they reach Earth.
Solid-State Storage and Radiation Hardening
The tech inside the spacecraft itself must be uniquely robust. Standard solid-state drives (SSDs) would fail almost immediately in Jupiter’s intense radiation belts. Instead, the “brains” of the missions studying the Great Red Spot use radiation-hardened components. These are specialized microchips and memory modules designed with redundant circuits and shielding to ensure that the data captured—whether it be high-res photos or spectral maps—remains intact until it can be beamed back home.
The evolution of this hardware has allowed for higher data rates and more frequent updates. Whereas the Voyager missions in the late 1970s could only send back limited, low-resolution snapshots, modern missions provide a continuous stream of telemetry and high-fidelity imagery that allows for real-time (or near-real-time) analysis of the storm’s dynamics.
Spectral Analysis and the Chemistry of Red
Why is the Great Red Spot red? This question has driven the development of specialized hardware called spectrometers. By analyzing the “fingerprint” of light reflecting off the storm, scientists can determine its chemical makeup, but this requires technology that goes far beyond the visible spectrum.
Infrared and Ultraviolet Mapping
The Great Red Spot appears different when viewed through infrared or ultraviolet filters. Using instruments like the Near-Infrared Spectrograph (NIRSpec) on the James Webb Space Telescope, astronomers can see the heat signature of the storm. This reveals which parts of the spot are rising and cooling, and which are sinking and warming.
Technologically, these sensors must be kept at extremely low temperatures to function. The James Webb, for example, uses a massive sunshield and active cooling systems to maintain the thermal stability necessary for its infrared sensors to detect the faint heat from Jupiter. This data is then cross-referenced with ultraviolet observations to identify “chromophores”—the chemical compounds that react with solar radiation to produce the spot’s iconic red hue.
Lab-on-a-Chip and Future Prospects
While we currently rely on remote sensing, the future of studying the Great Red Spot may involve “in-situ” (on-site) technology. Engineers are currently developing “lab-on-a-chip” sensors that could one day be deployed into the Jovian atmosphere via atmospheric probes. These miniaturized devices would use microfluidics and integrated circuits to analyze the chemical composition of the storm’s clouds directly, transmitting the results via a relay orbiter.
This represent the next frontier in the tech stack for planetary exploration: moving from looking at the storm to “touching” it. The integration of nanotechnology and advanced materials science is paving the way for sensors that can withstand the crushing pressures and corrosive chemicals found deep within Jupiter’s atmosphere.
The Intersection of Tech and Curiosity
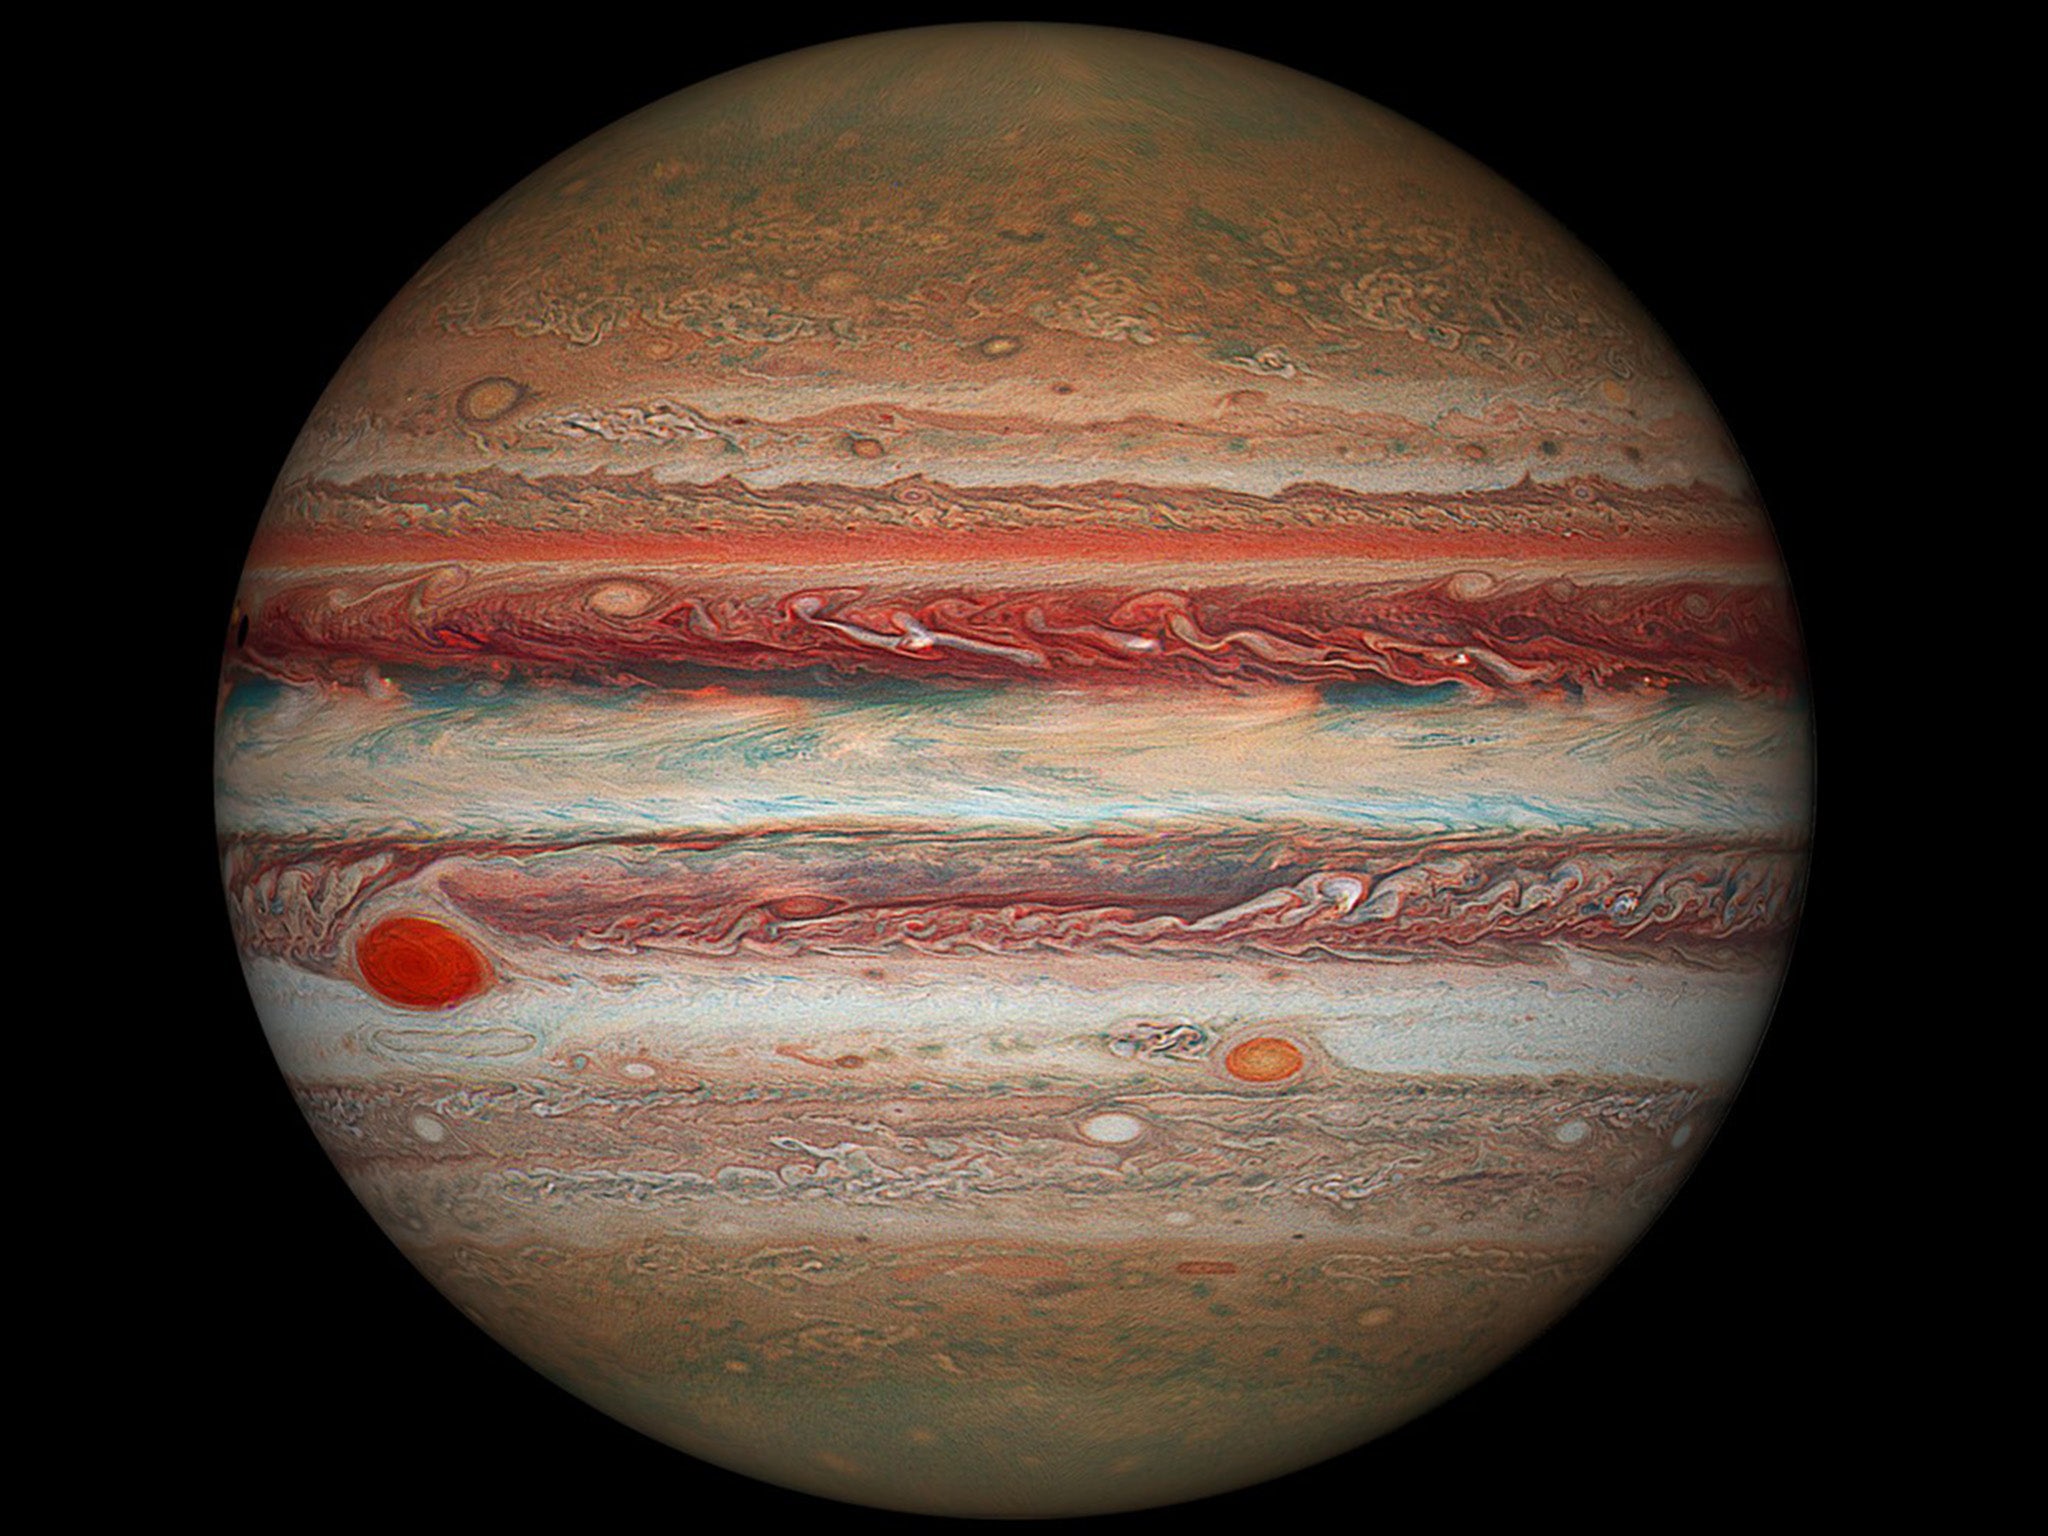
The Great Red Spot on Jupiter remains one of the most fascinating features of our solar system, but our ability to appreciate it is entirely dependent on the tools we build. Every high-resolution image, every wind-speed measurement, and every chemical analysis is a product of intense technological innovation.
From the AI that sharpens our view to the radiation-hardened processors that survive the journey, the study of Jupiter is a showcase of human ingenuity. As software becomes more capable of handling massive datasets and hardware becomes more resilient to the hazards of space, our understanding of this ancient storm will only deepen. The Great Red Spot is more than a planetary feature; it is a catalyst for the next generation of technological breakthroughs in imaging, communication, and artificial intelligence.
aViewFromTheCave is a participant in the Amazon Services LLC Associates Program, an affiliate advertising program designed to provide a means for sites to earn advertising fees by advertising and linking to Amazon.com. Amazon, the Amazon logo, AmazonSupply, and the AmazonSupply logo are trademarks of Amazon.com, Inc. or its affiliates. As an Amazon Associate we earn affiliate commissions from qualifying purchases.