
For the modern investor, the question “What is the market doing today?” is more than a casual inquiry; it is a daily ritual. Whether you are a seasoned portfolio manager or a retail investor checking an app during a lunch break, the fluctuations of the financial markets represent the collective heartbeat of global commerce, psychology, and geopolitical shifts. However, understanding what the market is doing requires more than just looking at a green or red percentage on a screen. It requires an appreciation for the underlying mechanics that drive price action, the indicators that signal health or distress, and the discipline to separate short-term noise from long-term signals.
Understanding the Major Indices and Global Indicators
To answer what the market is doing, one must first define “the market.” In most contexts, this refers to the major equity indices that track the performance of various segments of the economy. These indices serve as the primary barometer for investor sentiment and economic expectations.
The Big Three: S&P 500, Dow Jones, and Nasdaq
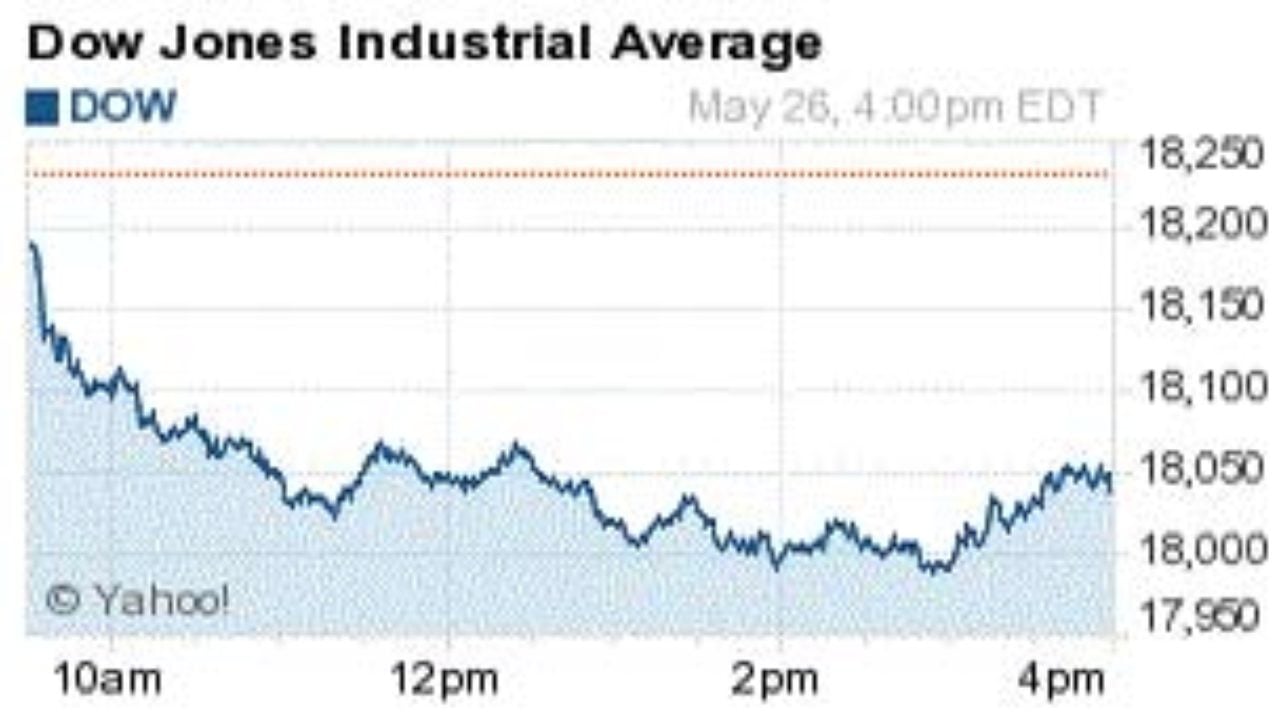
The S&P 500 is often considered the most accurate reflection of the U.S. economy, as it tracks 500 of the largest publicly traded companies across all sectors. When people ask what the market is doing, they are usually looking at the S&P 500 to gauge broad institutional confidence.
The Dow Jones Industrial Average (DJIA), meanwhile, offers a narrower view of 30 “blue-chip” companies. While less diverse, it reflects the stability of industrial and financial giants. Conversely, the Nasdaq Composite is heavily weighted toward technology and growth stocks. On days when “the market” is driven by breakthroughs in Artificial Intelligence or shifts in Silicon Valley, the Nasdaq often leads the charge, showing higher volatility than its counterparts.
The Bond Market and the 10-Year Treasury Yield
While equities grab the headlines, the bond market is often the “smarter” sibling that dictates the direction of stocks. Specifically, the 10-year Treasury yield is a foundational metric. When yields rise, it often puts downward pressure on stocks because it increases borrowing costs for corporations and offers investors a “risk-free” alternative to the volatile equity market. Understanding what the market is doing today almost always requires a glance at the fixed-income sector to see if investors are seeking safety or fleeing for growth.
Commodities and Currency Fluctuations
A comprehensive view of the market also includes commodities like gold and oil. Gold often serves as a hedge against inflation or geopolitical instability; if gold is “doing well” while stocks are crashing, it indicates a “risk-off” environment where investors are scared. Similarly, the strength of the U.S. Dollar (DXY) impacts international trade and the earnings of multinational corporations. A surging dollar can make American exports more expensive, potentially dragging down the earnings of large-cap companies.
Key Drivers of Daily Market Movements
The market does not move in a vacuum. Every tick up or down is a response to new information. To understand today’s market action, one must look at the specific catalysts that are currently influencing trader behavior.
Economic Data Releases and Central Bank Policy
The most significant mover of markets in the current era is the Federal Reserve. Investors hang on every word of the “Fed Chair,” looking for hints regarding interest rate hikes or cuts. On days when the Consumer Price Index (CPI) or employment data is released, the market can be incredibly volatile. If inflation data comes in higher than expected, the market might “price in” higher interest rates, leading to a sell-off. Conversely, a “cool” inflation report can spark a massive rally as investors anticipate more liquidity and cheaper borrowing.
Corporate Earnings and Sector Rotation
Four times a year, during “Earnings Season,” the market’s behavior is dictated by individual company performance. When a bellwether company like Apple or Microsoft reports its quarterly results, it doesn’t just move its own stock; it moves the entire sector.
Furthermore, “sector rotation” is a common phenomenon. On some days, tech stocks might be down while “defensive” sectors like utilities and healthcare are up. This tells us that the market is rotating out of high-growth, high-risk assets and moving into safer, dividend-paying stocks. Recognizing these internal shifts is key to understanding the nuances of daily market behavior.
Liquidity and High-Frequency Trading
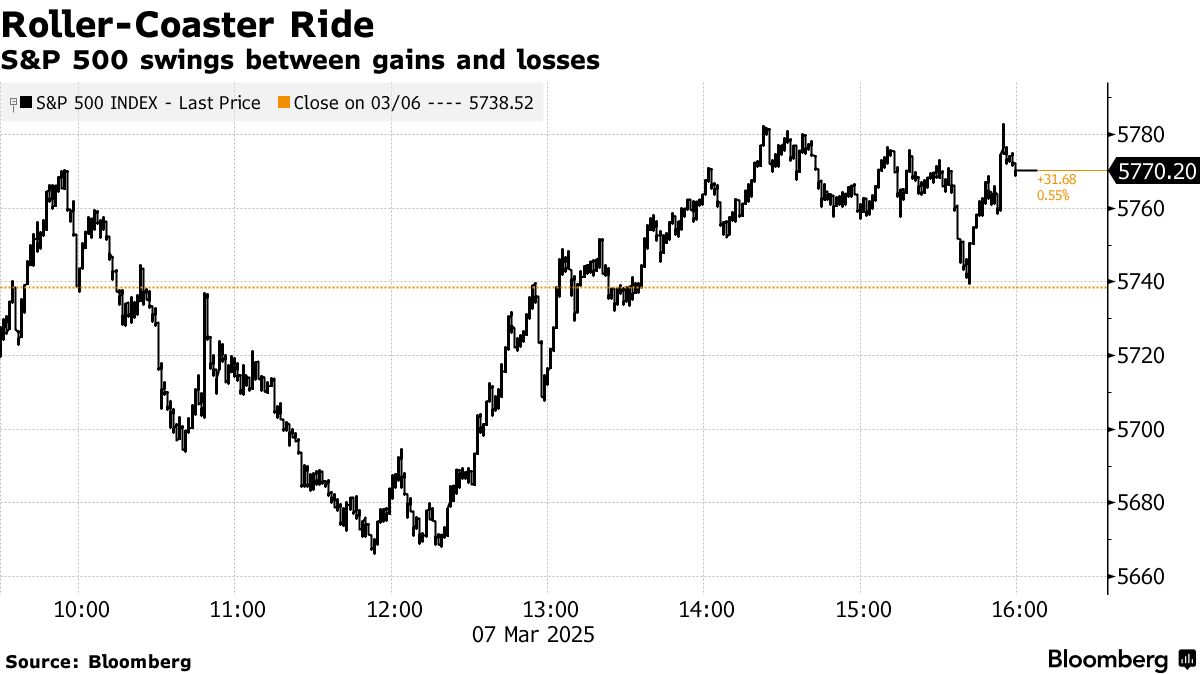
In the modern era, a significant portion of “what the market is doing” is driven by algorithms and high-frequency trading (HFT). These computer programs execute trades in milliseconds based on technical patterns or keyword triggers in news headlines. This can lead to “flash” movements where the market drops or spikes for no apparent fundamental reason, simply because certain price levels triggered a cascade of automated sell or buy orders.
Psychological and External Influences on Volatility
Markets are not just spreadsheets; they are reflections of human emotion. Greed, fear, and uncertainty are the invisible hands that move the charts.
The Fear and Greed Index and Market Sentiment
Market participants often use the VIX (Volatility Index), colloquially known as the “Fear Gauge,” to measure expectations of near-term price changes. When the VIX is high, it indicates that investors are nervous and paying more for protection (options).
The “Fear and Greed Index” aggregates various factors like market momentum and junk bond demand to provide a snapshot of the current emotional state of the market. On days when the market is “doing nothing” or trading sideways, it often suggests a “wait-and-see” approach from big institutions, perhaps ahead of a major political event or a holiday.
Geopolitical Events and “Black Swan” Risks
Global politics play an oversized role in market performance. Conflicts in oil-rich regions, trade tensions between major economies, or unexpected election results can send shockwaves through the financial system. These are often referred to as “Black Swan” events—unpredictable occurrences that have a massive impact. When the market reacts to these, it is often sharp and non-linear, as investors scramble to re-evaluate the risk profiles of their entire portfolios.
The Role of Retail Sentiment and Social Media
In recent years, the rise of “retail” investors—individual people trading from their phones—has introduced a new layer of complexity. Social media platforms can occasionally drive massive surges in specific stocks or “meme” assets, independent of traditional financial metrics. While this represents a smaller portion of the total market cap, it can significantly influence the “vibe” of the market and cause localized pockets of extreme volatility.
Developing a Long-Term Strategy in a Short-Term World
When you ask what the market is doing today, it is important to remember the context of your own financial goals. The “daily” market is often a distraction from the “decade” market.
Filtering Noise from Signal
For the long-term investor, most daily fluctuations are “noise.” A 1% drop in the S&P 500 might feel significant in the moment, but in the context of a 10-year investment horizon, it is a mere blip. Understanding what the market is doing today should be a tool for awareness, not necessarily a trigger for action. High-quality investing involves distinguishing between a fundamental change in a company’s value and a temporary dip caused by market-wide panic.
The Importance of Diversification
One of the best ways to navigate the uncertainty of “what the market is doing” is through diversification. If you are diversified across stocks, bonds, real estate, and international markets, a bad day in the Nasdaq won’t necessarily ruin your portfolio. Diversification is the only “free lunch” in finance, allowing you to capture the long-term upward trajectory of the global economy while smoothing out the daily bumps that cause stress.
Disciplined Rebalancing and Dollar-Cost Averaging
Rather than trying to time the market based on daily news, successful investors often use a strategy of dollar-cost averaging (DCA). By investing a fixed amount of money at regular intervals, you naturally buy more shares when the market is “doing poorly” (and prices are low) and fewer shares when the market is “doing well” (and prices are high). This removes the emotional burden of checking the ticker every hour and aligns your actions with the mathematical reality of wealth accumulation.
Conclusion
So, what is the market doing today? It is likely doing what it has done for over a century: processing vast amounts of information, reacting to human emotion, and attempting to find the “fair price” for the world’s most valuable assets.
While the headlines may focus on the daily drama of a particular stock or a specific economic report, the true story of the market is one of resilience and growth over time. By understanding the indices, the economic drivers, and the psychological factors at play, you can transform from a passive observer of the market’s whims into a strategic participant in its long-term rewards. Whether the “candles” are green or red today, the most important thing is that you have a plan that extends far beyond the closing bell.
aViewFromTheCave is a participant in the Amazon Services LLC Associates Program, an affiliate advertising program designed to provide a means for sites to earn advertising fees by advertising and linking to Amazon.com. Amazon, the Amazon logo, AmazonSupply, and the AmazonSupply logo are trademarks of Amazon.com, Inc. or its affiliates. As an Amazon Associate we earn affiliate commissions from qualifying purchases.