
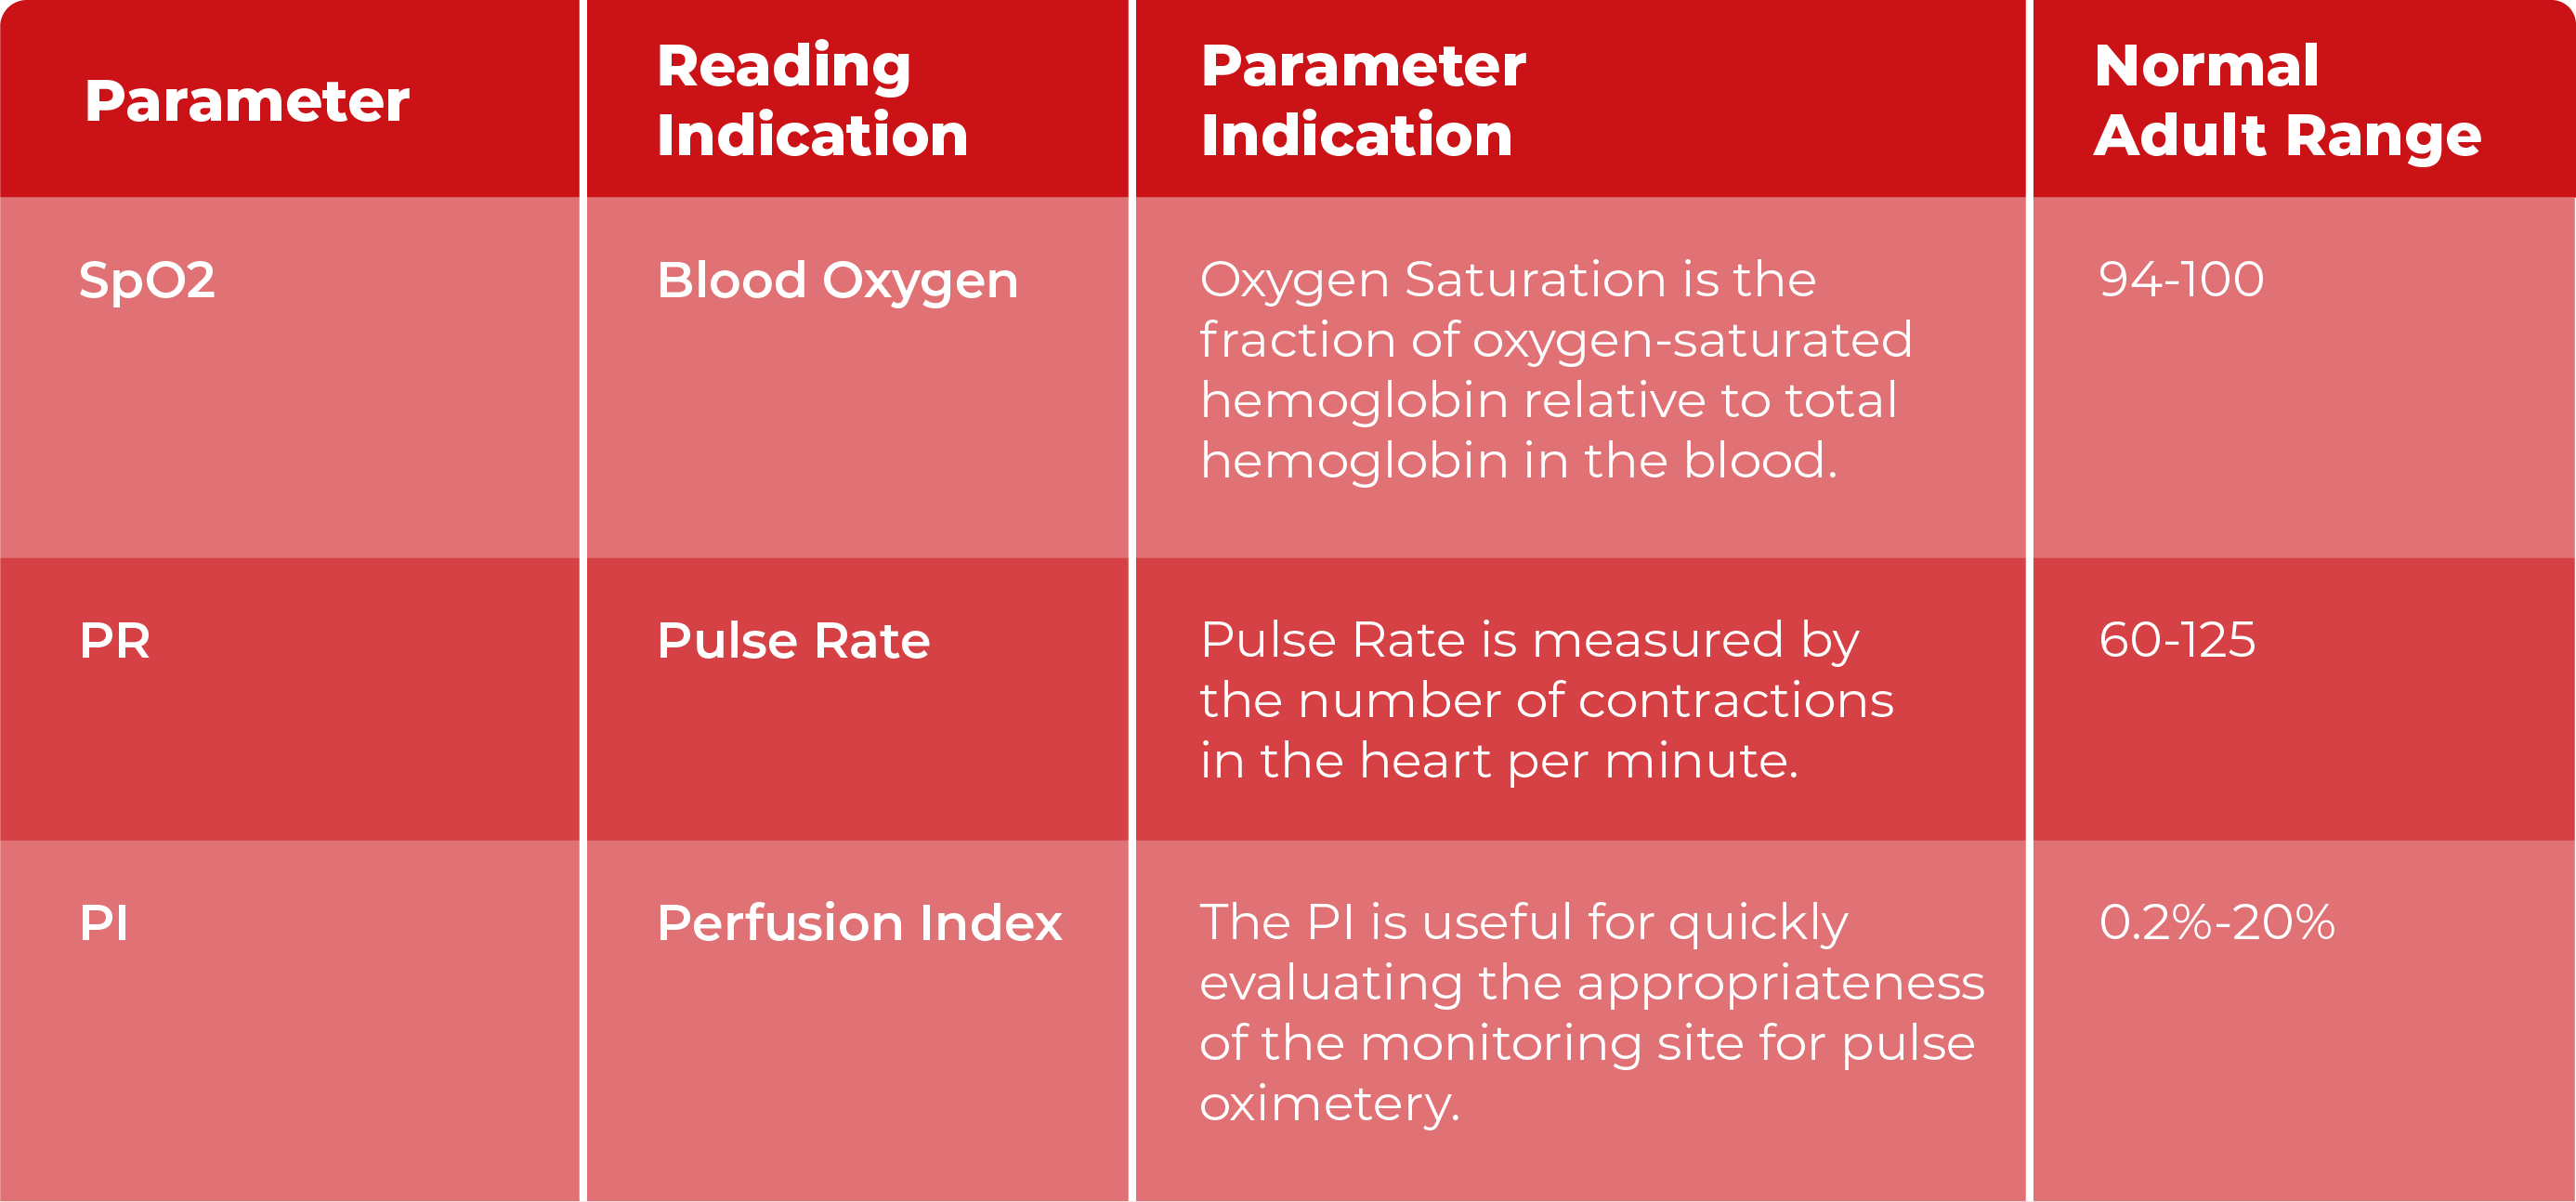
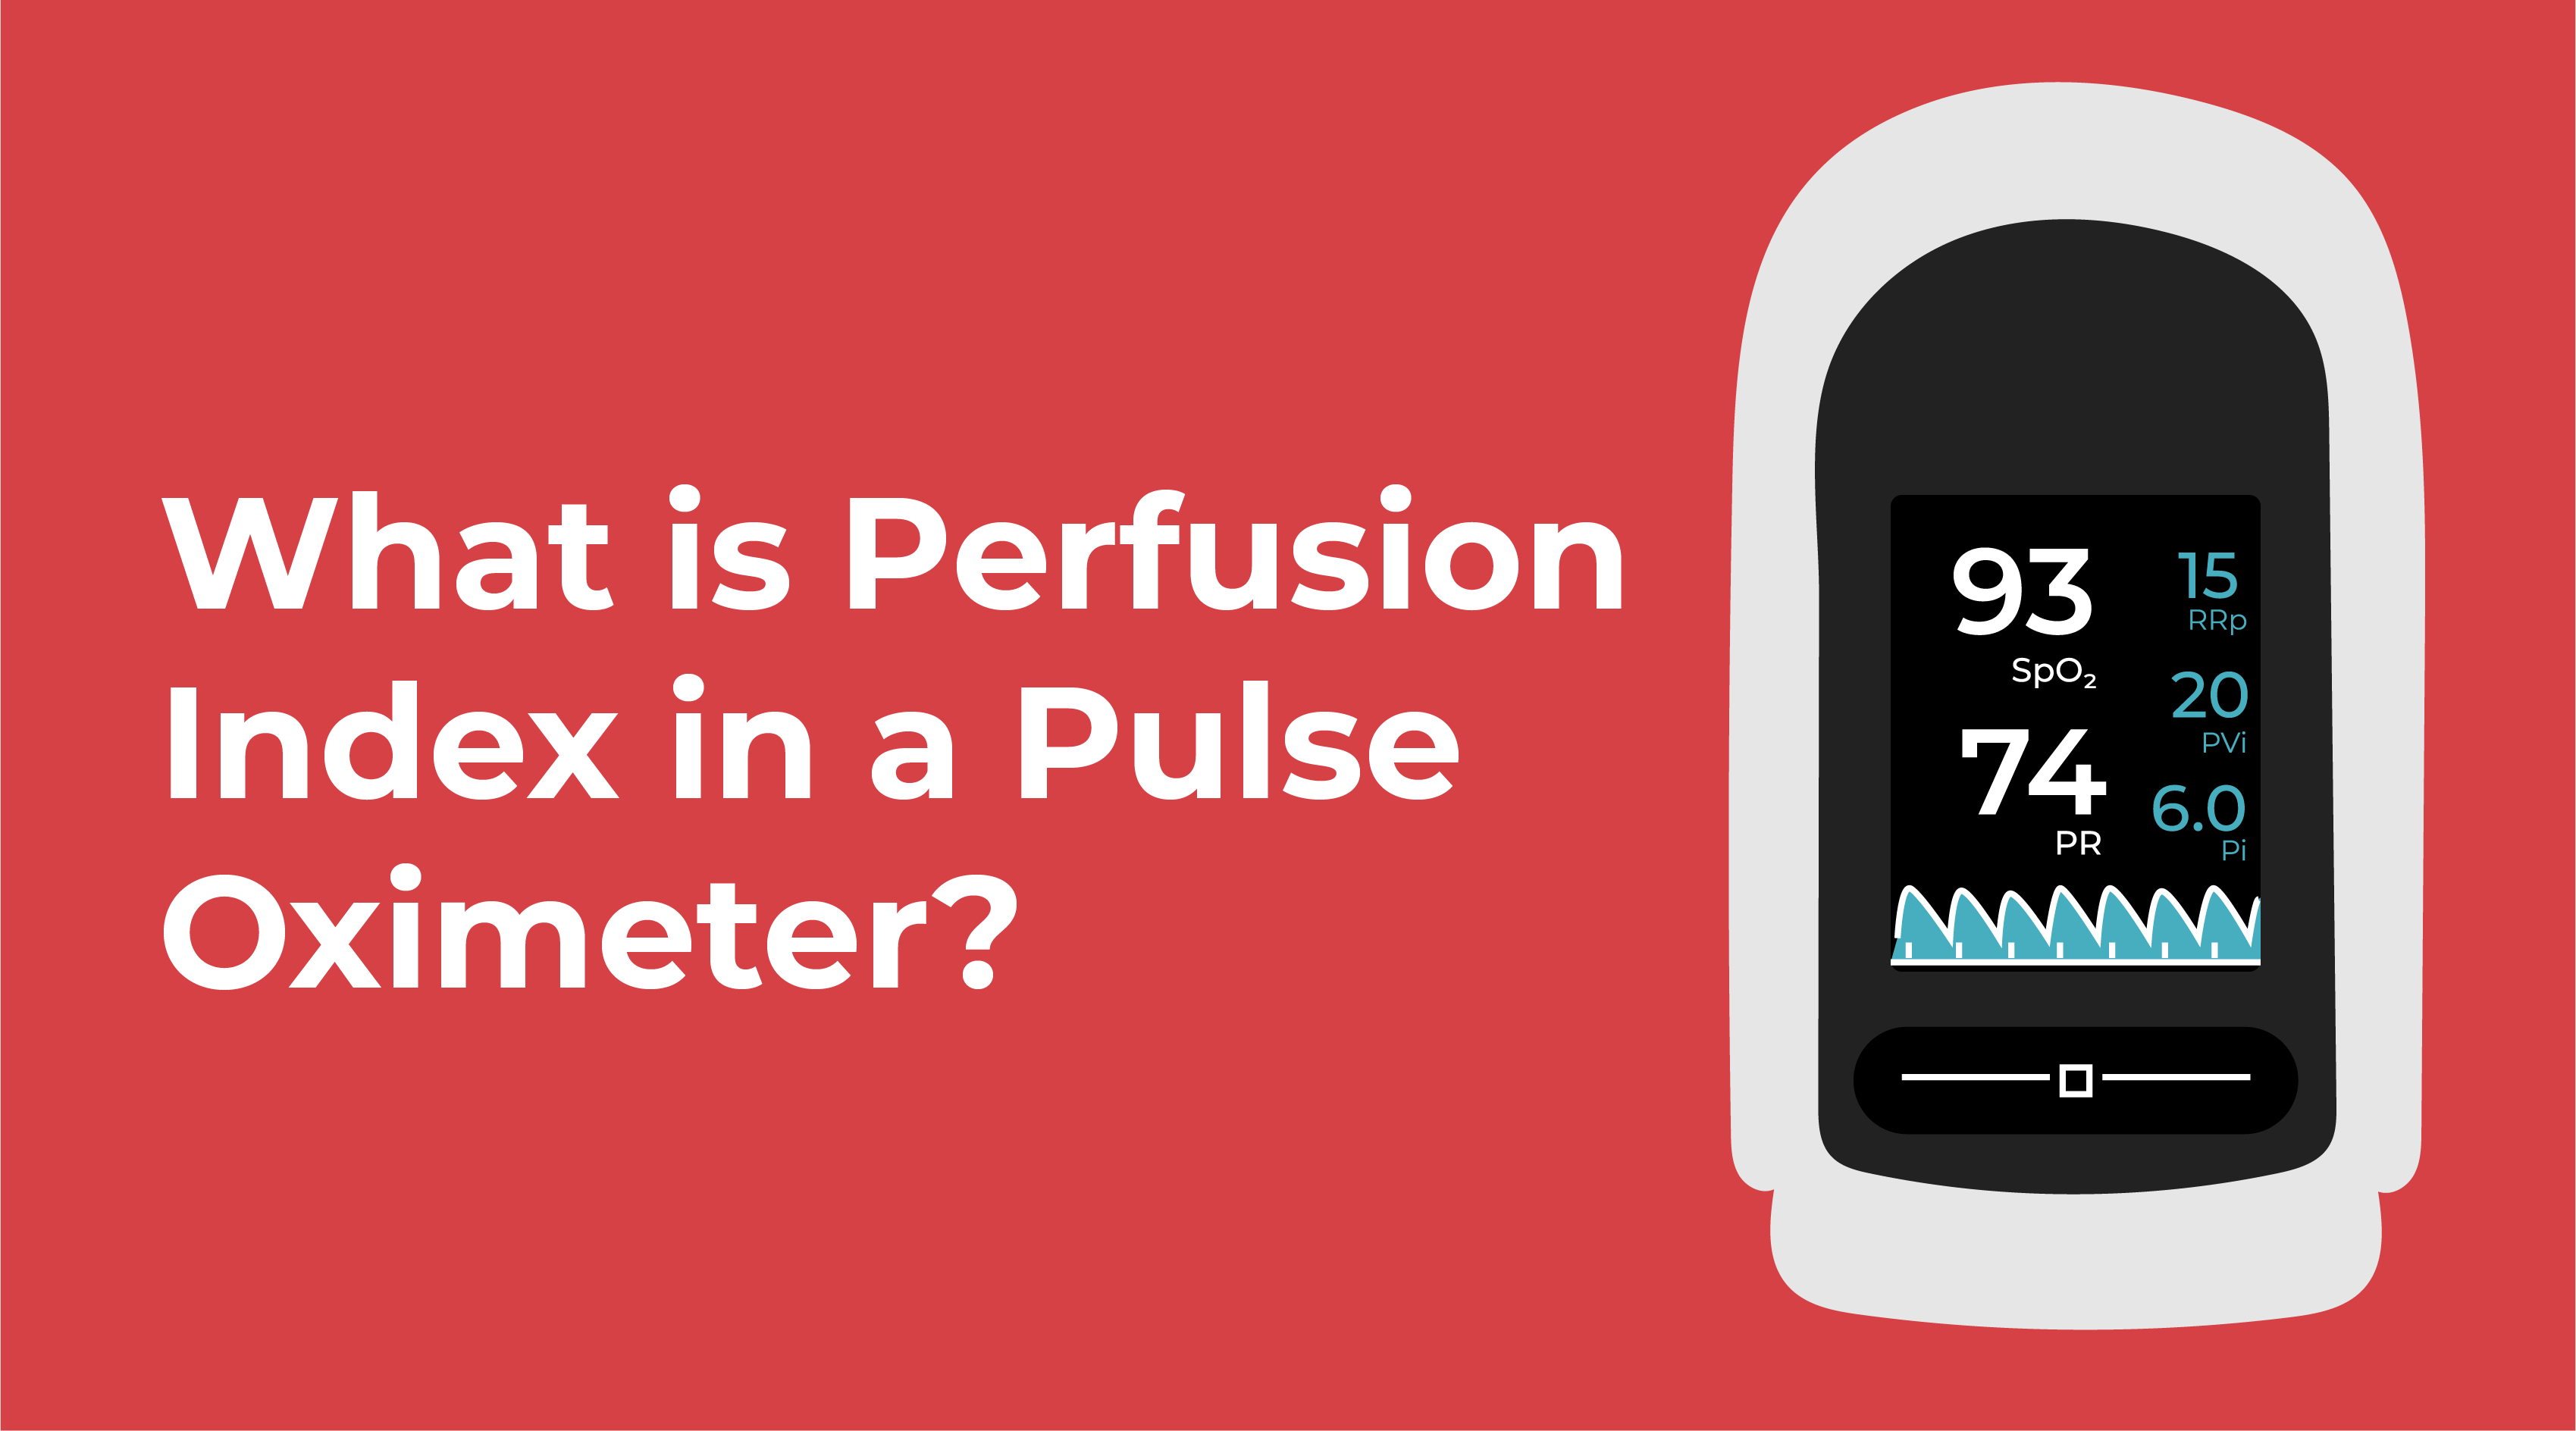
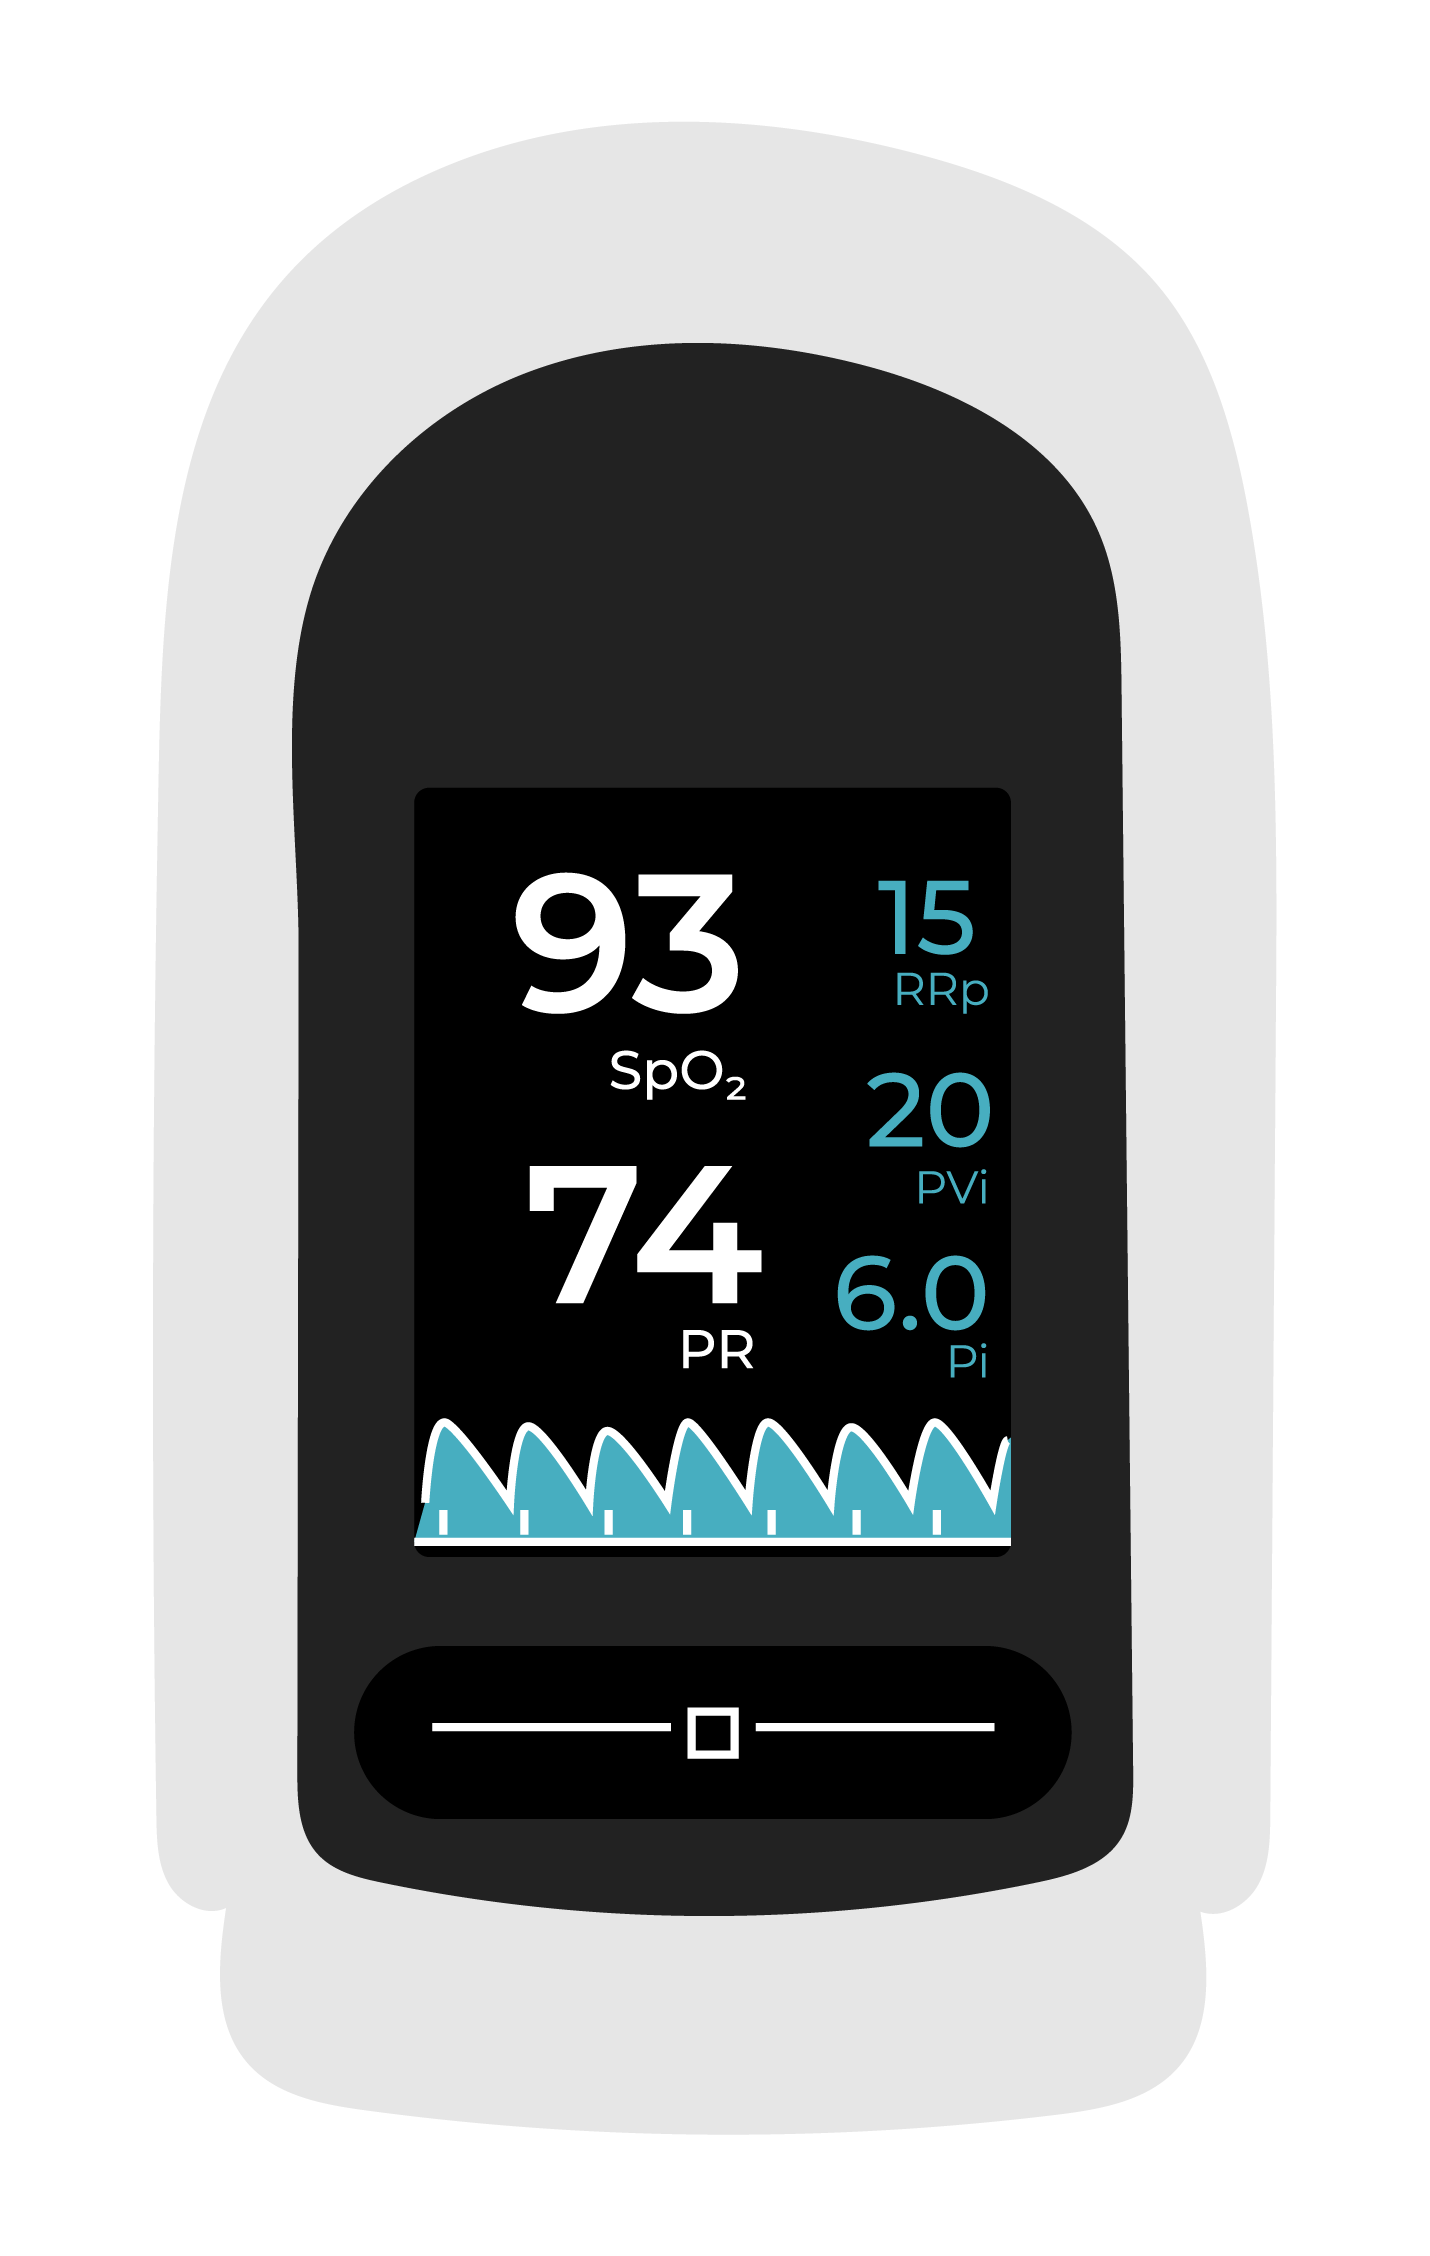
In the rapidly evolving landscape of consumer health technology, the pulse oximeter has transitioned from a specialized clinical tool to a common household gadget. While most users are familiar with SpO2 (blood oxygen saturation) and PR (pulse rate), a third metric often appears on the digital display: PI, or the Perfusion Index. To the average user, this numerical value can seem cryptic, yet it represents a sophisticated intersection of optical engineering and physiological data processing.
The Perfusion Index is more than just a secondary data point; it is a critical indicator of signal reliability and vascular health. As wearable tech continues to integrate high-precision sensors into our daily lives, understanding the technical nuances of the PI value is essential for anyone looking to master their personal health data.
The Engineering Behind the Perfusion Index
To understand what PI means, one must first look at the hardware and software mechanics of a pulse oximeter. These devices utilize a technology called photoplethysmography (PPG). This process involves emitting specific wavelengths of light—typically red and infrared—through a translucent part of the body, such as a fingertip or earlobe.
How Pulse Oximeters Capture Data
The sensor in a pulse oximeter consists of two light-emitting diodes (LEDs) and a photodetector. As light passes through the tissue, it is absorbed by various components, including skin, bone, connective tissue, and, most importantly, blood. Oxygenated hemoglobin absorbs more infrared light, while deoxygenated hemoglobin absorbs more red light. By calculating the ratio of these two light frequencies, the device’s internal processor determines the oxygen saturation level.
However, the light that reaches the photodetector is not uniform. It consists of two distinct components:
- The DC (Direct Current) Component: This represents the constant light absorption by non-pulsating tissues like bone, muscle, and venous blood.
- The AC (Alternating Current) Component: This represents the variable light absorption caused by the “pulse” of arterial blood as it flows through the site with every heartbeat.
Calculating the Ratio: Pulsatile vs. Static Light Absorption
The Perfusion Index is technically defined as the ratio of the pulsatile blood flow (AC) to the non-pulsatile static blood flow (DC) at the monitoring site. In mathematical terms, it is expressed as a percentage: PI = (AC / DC) × 100.
From a technical standpoint, PI is a measurement of the “strength” of the pulse at the sensor site. A higher PI indicates a stronger pulse and better blood flow, while a lower PI suggests that the peripheral blood flow is weak, making it harder for the device to distinguish the arterial pulse from the background noise of the static tissue. This makes the PI a vital diagnostic tool for the device itself, serving as a “quality control” metric for the SpO2 reading.
Interpreting PI: From Clinical Hardware to Consumer Gadgets
In a clinical environment, medical professionals use the Perfusion Index to assess a patient’s peripheral circulation. In the world of consumer technology, the PI helps users determine if their device is positioned correctly or if physiological factors are interfering with the accuracy of their health data.
What is a “Good” PI Reading?
The Perfusion Index is a relative value that varies significantly from person to person. Because it is dependent on the specific anatomy and vascular state of the individual, there is no universal “normal” range. However, tech manufacturers and clinicians generally follow these guidelines:
- Low PI (0.02% to 0.5%): A very low PI suggests that the pulse signal is extremely weak. In this range, the SpO2 and pulse rate readings may be inaccurate or take a long time to stabilize.
- Average PI (1.0% to 5.0%): This is the standard range for most healthy individuals under normal conditions. It indicates sufficient blood flow for the device to capture high-fidelity data.
- High PI (above 10%): A high PI indicates very strong peripheral perfusion. This is often seen in individuals with excellent cardiovascular health or in environments where the hands are warm and blood vessels are dilated.
Factors Affecting Sensor Accuracy
Because the Perfusion Index measures the strength of the arterial pulse, several external and internal factors can cause the PI to fluctuate. Digital health enthusiasts should be aware of these variables to ensure they are getting the most out of their hardware:
- Ambient Temperature: Cold temperatures cause vasoconstriction, where blood vessels narrow to preserve core body heat. This reduces peripheral blood flow and results in a lower PI.
- Sensor Placement: If the finger is not inserted correctly into the device, the light path may be obstructed, leading to a false low PI reading.
- Physical Movement: Motion artifacts are the enemy of PPG sensors. Excessive movement can create “noise” in the AC component, causing the PI to fluctuate erratically.
- Vascular Health: Conditions such as Raynaud’s disease or peripheral artery disease can result in chronically low PI values, as these conditions physically limit the volume of blood reaching the extremities.
The Role of PI in Wearable Technology and Biometric Monitoring
As we move toward an era of proactive health management, the Perfusion Index is finding a new home in smartwatches, fitness trackers, and advanced biometric rings. The integration of PI into consumer ecosystems is changing how we interact with our own physiological data.
Integration with Smartphones and Health Apps
Modern pulse oximeters are rarely standalone devices. Most now feature Bluetooth connectivity, allowing them to sync with health platforms like Apple Health, Google Fit, or proprietary manufacturer apps. Within these apps, PI data is often used to calculate a “Signal Quality Index” (SQI).
Software developers use PI as a filtering mechanism. If a wearable device detects a PI below a certain threshold, the app may discard the SpO2 reading or prompt the user to remain still. This prevents the logging of “dirty data,” ensuring that the user’s long-term health trends are based on high-quality, verified samples. For athletes, tracking PI over time can even offer insights into recovery; a consistently low PI during rest might signal overtraining or systemic fatigue.
Beyond Oxygen: The Future of Multiparameter Sensors
The tech industry is currently exploring how PI can be used in conjunction with other metrics to provide a more holistic view of cardiovascular health. Engineers are looking at “Pulse Variability” and “Pleth Variability Index” (PVI), which are derived from changes in the PI over a respiratory cycle.
In the future, your wearable might use PI to detect early signs of dehydration or even stress. Dehydration reduces blood volume, which in turn lowers the Perfusion Index. By utilizing AI algorithms to analyze these subtle shifts in the PPG waveform, future software updates could alert users to drink water or take a break long before they feel physical symptoms. This turns the PI from a simple “signal strength” bar into a predictive health metric.
Troubleshooting and Optimization for Accurate Tech Readings
For users who rely on pulse oximeters for monitoring chronic conditions or optimizing athletic performance, getting a consistent PI reading is paramount. If your device is displaying a low PI or “Error” message, several tech-focused troubleshooting steps can help.
External Variables and Signal Interference
Optical sensors are sensitive to environmental light. If the housing of your pulse oximeter does not provide a complete seal around the finger, “ambient light leakage” can flood the photodetector. This artificially inflates the DC component of the ratio, leading to a lower calculated PI. High-end devices use opaque materials and sophisticated shielding to prevent this, but budget gadgets may require you to cup your hand or move away from direct sunlight to get an accurate reading.
Furthermore, nail polish—particularly dark colors like black, blue, or green—can interfere with the wavelengths of light used by the LEDs. Because these pigments absorb the light before it reaches the vascular bed, the signal becomes weak, resulting in a low PI and unreliable SpO2 data. Tech-savvy users often recommend rotating the finger 90 degrees or using a toe if fingernail obstructions are present.
Best Practices for High-Precision Monitoring
To maximize the performance of your health tech, consistency is key. Experts suggest the following protocol for high-quality data capture:
- Warm the Monitoring Site: If your hands are cold, rub them together or run them under warm water to encourage vasodilation before taking a measurement. This will significantly boost your PI.
- Maintain a Neutral Posture: Keep your hand at heart level. Holding your hand too high can reduce blood pressure at the fingertip (lowering PI), while holding it too low can cause venous pooling (distorting the DC component).
- Software Updates: For smart wearables, ensure your firmware is up to date. Manufacturers frequently release algorithmic updates that improve how the device interprets the Perfusion Index under challenging conditions, such as during sleep or low-light environments.
The Perfusion Index is a testament to how far consumer medical technology has come. What was once a complex calculation reserved for bedside monitors in intensive care units is now a standard feature in our pockets and on our wrists. By understanding that PI represents the strength and reliability of our physiological signal, we can better navigate the sea of data provided by modern gadgets, ensuring that our digital health journey is guided by accuracy and insight.
aViewFromTheCave is a participant in the Amazon Services LLC Associates Program, an affiliate advertising program designed to provide a means for sites to earn advertising fees by advertising and linking to Amazon.com. Amazon, the Amazon logo, AmazonSupply, and the AmazonSupply logo are trademarks of Amazon.com, Inc. or its affiliates. As an Amazon Associate we earn affiliate commissions from qualifying purchases.