
In the ecosystem of business finance and digital commerce, metrics serve as the primary compass for growth and sustainability. Among the various Key Performance Indicators (KPIs) that stakeholders monitor, one acronym consistently rises to the top of the priority list for any revenue-focused organization: AOV.
AOV stands for Average Order Value. While it is a simple calculation on the surface, its implications for a company’s financial health, cash flow, and scalability are profound. In an era where customer acquisition costs (CAC) are rising across almost every industry, understanding and optimizing AOV is no longer just a tactical advantage—it is a financial necessity.
Understanding AOV: The Core Financial Metric for Profitability
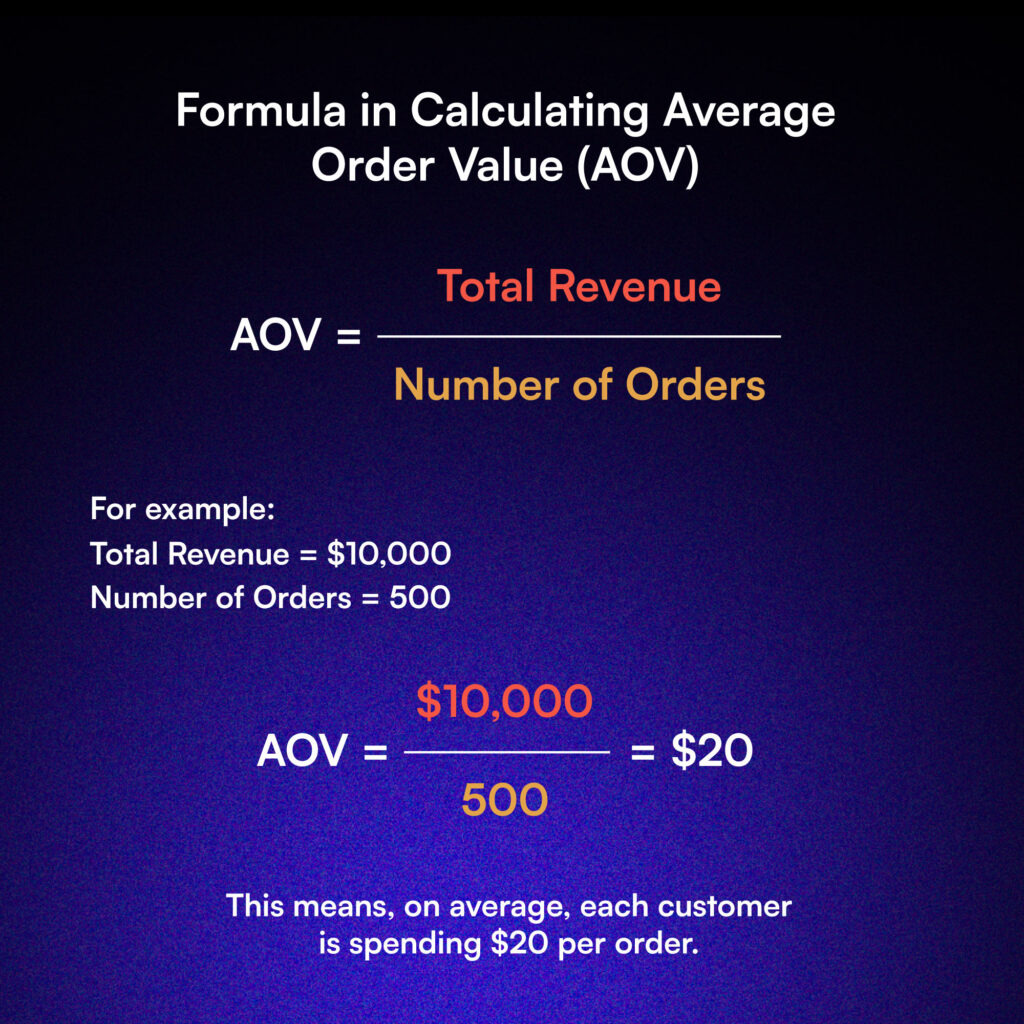
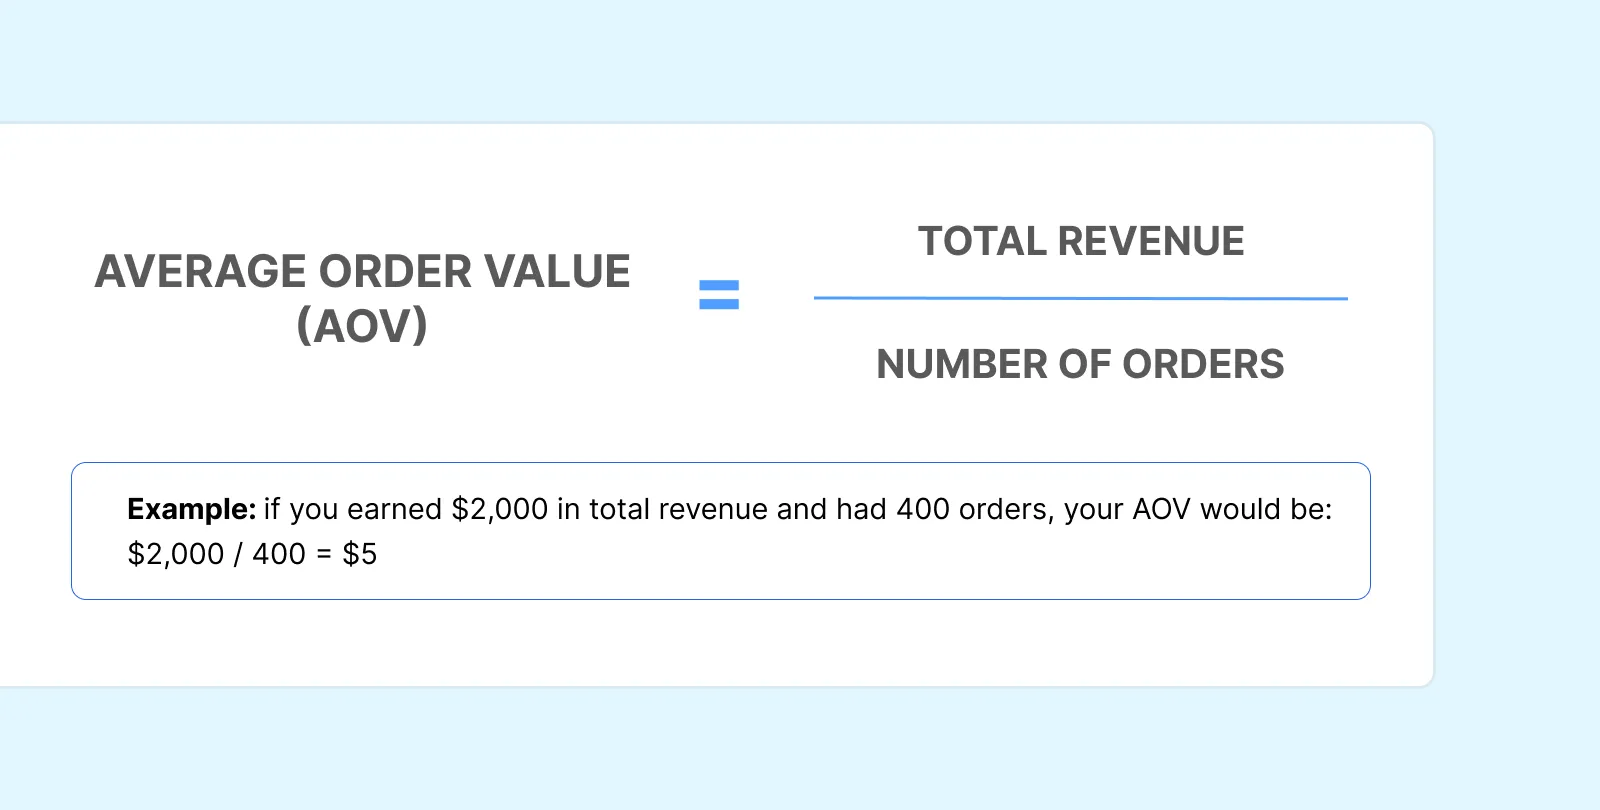
At its most fundamental level, Average Order Value tracks the average dollar amount spent each time a customer places an order on a website or in a store. It is calculated by dividing total revenue by the total number of orders over a specific period.
The formula is straightforward:
AOV = Total Revenue / Total Number of Orders
For example, if an online business generates $50,000 in revenue from 1,000 orders in a single month, the AOV is $50. From a financial perspective, this number provides a window into consumer behavior and the efficiency of the sales funnel. Unlike metrics such as total revenue or conversion rate, AOV focuses specifically on the “size” of the transaction rather than the “volume” of customers.
Why AOV Matters for Bottom-Line Growth
In business finance, growth is often pursued through three primary levers: increasing the number of customers, increasing the frequency of purchases, or increasing the value of each transaction. Of these three, increasing the value of each transaction (AOV) is frequently the most cost-effective path to higher profitability.
When a company increases its AOV, it is essentially generating more revenue from the same amount of traffic or the same number of customers. This means the overhead costs associated with processing an order—such as payment processing fees, customer service time, and digital infrastructure—are spread across a larger dollar amount. By maximizing the revenue per transaction, a business can significantly improve its contribution margin, which is the revenue remaining after variable costs are subtracted.
The Impact on Net Profit
AOV is intrinsically linked to net profit. Consider two businesses: Company A has an AOV of $30, while Company B has an AOV of $60. If both companies have a fixed shipping and handling cost of $10 per order, Company A is left with $20 to cover the cost of goods sold (COGS) and marketing, whereas Company B has $50. The leverage provided by a higher AOV allows Company B to be more aggressive in its growth strategies while maintaining healthier margins.
The Relationship Between AOV, Customer Acquisition Cost (CAC), and LTV
To truly grasp the financial importance of AOV, one must view it in relation to other critical financial metrics, specifically Customer Acquisition Cost (CAC) and Lifetime Value (LTV).
Balancing the Equations
Customer Acquisition Cost (CAC) represents the total expense required to gain a new customer, encompassing marketing spend, sales salaries, and advertising overhead. In many modern business models, particularly in e-commerce and SaaS, the CAC can often exceed the profit made on a customer’s first order. This is where AOV becomes a defensive financial metric.
If your CAC is $40 and your AOV is only $35, you are losing money on every new customer acquired—a situation that is unsustainable without massive venture capital backing or a very high retention rate. However, if you can implement strategies to raise that AOV to $60, you immediately pivot from a loss-leading model to a profitable one. A higher AOV provides a “buffer” that allows a business to spend more on marketing to outbid competitors, effectively buying market share while remaining financially solvent.
The Impact on Cash Flow
From a cash flow management perspective, AOV is a vital indicator of how quickly a business can recoup its investments. A high AOV accelerates the “payback period”—the time it takes for a customer to become profitable. In business finance, liquid cash is the lifeblood of operations. By increasing the amount of money flowing into the business with each transaction, management can reinvest that capital into inventory, product development, or debt reduction much faster than a business reliant on high-volume, low-value transactions.
AOV as a Component of Lifetime Value (LTV)
Lifetime Value (LTV) is the total amount of money a customer is expected to spend with your business during their entire relationship. The formula for LTV is:
LTV = AOV x Purchase Frequency x Customer Lifespan
As this formula demonstrates, AOV is one of the three pillars of long-term customer value. While increasing purchase frequency and lifespan are about retention and brand loyalty, increasing AOV is about maximizing the immediate financial opportunity. A business that ignores AOV is essentially leaving money on the table that could have been used to fuel further growth.
Strategic Methods to Increase Average Order Value
Increasing AOV is a multi-faceted endeavor that requires a blend of psychological pricing, inventory management, and financial incentives. Here are the most effective strategies utilized by high-performing companies to boost their average transaction size.
Upselling and Cross-selling Techniques
Upselling involves encouraging a customer to purchase a more expensive version of the item they are currently considering. From a financial standpoint, the marginal cost of providing a “premium” product is often much lower than the price increase, leading to higher margins.
Cross-selling, on the other hand, involves suggesting complementary products. When a customer adds a $500 camera to their cart, suggesting a $50 memory card and a $30 carrying case is a classic cross-selling move. These additions may seem small to the customer, but they can increase the AOV by 15-20% without requiring any additional marketing spend.
Threshold Incentives and Tiered Pricing
One of the most effective ways to influence AOV is through the use of “thresholds.” The most common example is “Free Shipping on orders over $100.” If a customer has $85 worth of goods in their cart, they are highly likely to find an additional $15 item to avoid paying a $10 shipping fee.
Financially, the business must calculate the “break-even” point for these thresholds. If the margin on the extra $15 item exceeds the cost of the shipping provided, the business has successfully increased its AOV and its total profit. Other variations include “Spend $150, Get $20 Off” or “Buy Two, Get the Third at 50% Off,” all designed to nudge the transaction value higher.
Product Bundling and Subscription Models
Bundling allows a business to group related items together and sell them as a single unit, often at a slight discount compared to buying them individually. While the discount might seem to lower margins, the increase in AOV usually results in higher total profit per order.
Similarly, introducing a subscription element can stabilize AOV. If a customer typically buys one unit of a product sporadically, offering a “Subscribe and Save” option can ensure a consistent, higher-value transaction occurs on a regular cadence, which significantly aids in financial forecasting and revenue predictability.
AOV Analysis: Benchmarking and Industry Standards
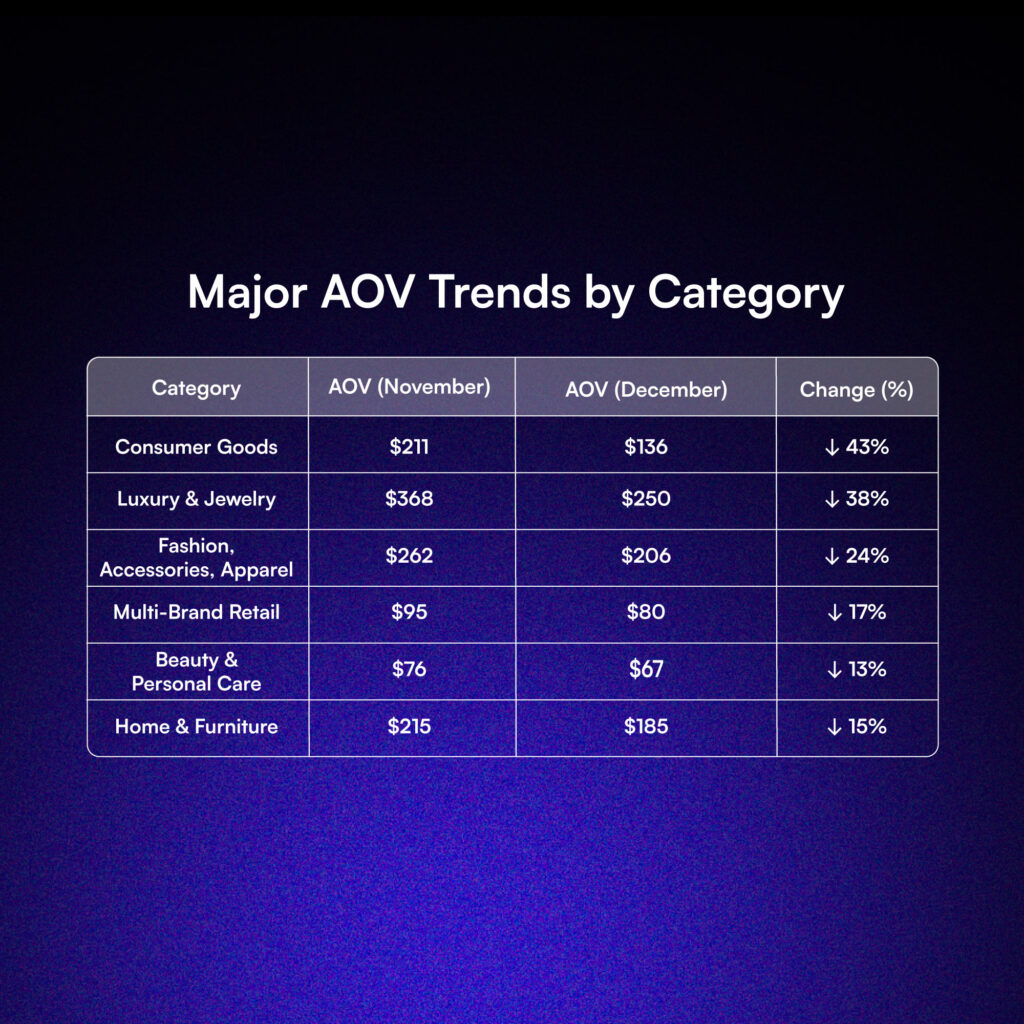
Understanding what AOV stands for is the first step; the second is knowing how to analyze it. A “good” AOV is entirely relative to the industry, the product category, and the business model.
Segmenting Your Data
To gain deep financial insights, AOV should not be looked at as a single, monolithic number. Savvy financial analysts segment AOV by:
- Customer Type: Do returning customers have a higher AOV than new ones?
- Acquisition Channel: Does traffic from search engines yield a higher AOV than traffic from social media?
- Device Type: Do mobile users spend less per order than desktop users?
- Geographic Location: Are customers in certain regions more prone to high-value purchases?
By segmenting this data, a business can allocate its marketing budget more effectively, targeting the channels and demographics that yield the highest financial return per transaction.
Pitfalls to Avoid in AOV Optimization
While a higher AOV is generally positive, businesses must be wary of “AOV at any cost.” If you increase your AOV by forcing customers into larger bundles they don’t need, you may see a short-term spike in revenue but a long-term decline in retention. Furthermore, if the incentives used to drive AOV (like deep discounts or free high-cost shipping) eat too far into your margins, you may find yourself with a higher AOV but a lower net profit.
Financial health requires a balance. The goal is “Profitable AOV,” where the increase in order size contributes meaningfully to the bottom line after all variable and fixed costs are accounted for.
Future-Proofing Your Financial Strategy Through AOV
In the modern business landscape, where competition is global and consumer attention is fragmented, AOV stands as a critical barometer of a company’s financial efficiency. It is more than just a metric; it is a reflection of how well a brand understands its customers and how effectively it manages its revenue streams.
By focusing on AOV, business owners and financial managers can build more resilient organizations. Higher order values provide the capital necessary for innovation, the margin necessary for market fluctuations, and the cash flow necessary for expansion. Whether you are a small side-hustle owner or a corporate finance officer, mastering the levers of Average Order Value is a fundamental requirement for achieving long-term financial success.
In summary, AOV stands for Average Order Value, but in the world of business finance, it represents the potential for increased profitability, efficient scaling, and a healthier bottom line. By consistently monitoring, analyzing, and optimizing this metric, a business can ensure that every transaction is a stepping stone toward greater financial stability.
aViewFromTheCave is a participant in the Amazon Services LLC Associates Program, an affiliate advertising program designed to provide a means for sites to earn advertising fees by advertising and linking to Amazon.com. Amazon, the Amazon logo, AmazonSupply, and the AmazonSupply logo are trademarks of Amazon.com, Inc. or its affiliates. As an Amazon Associate we earn affiliate commissions from qualifying purchases.