
In the era of the quantified self, the resting heart rate (RHR) has transitioned from a metric gathered once a year in a cold clinical setting to a continuous stream of data points living on our wrists, fingers, and smartphones. For technology enthusiasts and digital health advocates, the question “what is a good resting heart rate” is no longer just a medical inquiry; it is a fundamental benchmark for optimizing human performance, understanding the limits of hardware accuracy, and leveraging artificial intelligence to predict physiological trends.
The proliferation of sophisticated wearable technology—ranging from the Apple Watch and Garmin Fenix series to the Oura Ring and Whoop strap—has democratized access to biometric data. However, as our devices become more capable of tracking every beat, the need for a deep technological understanding of what these numbers signify, how they are captured, and what constitutes “good” in a digital context has never been more critical.
The Hardware Revolution: How Modern Sensors Track Your Pulse
To understand what makes a resting heart rate “good,” one must first understand the technology responsible for measuring it. The shift from manual pulse checking to 24/7 digital monitoring relies on a sophisticated interplay of hardware and software.
Photoplethysmography (PPG) and Optical Sensors
The vast majority of consumer wearables utilize Photoplethysmography (PPG). This technology works by shining light (usually green LEDs) into the skin and measuring the light reflected back. Because blood absorbs green light, each cardiac contraction causes a surge in blood volume at the wrist or finger, which in turn causes a dip in the amount of reflected light.
High-end tech brands have refined these sensors to include multiple light paths and frequencies. For instance, while green light is excellent for tracking heart rate during movement, infrared light is often used during sleep to preserve battery life and provide a more accurate RHR reading when the body is at total rest. A “good” RHR reading is only as valid as the sensor’s ability to filter out “noise”—the interference caused by movement, skin tone, or ambient light.
Accuracy and the Signal-to-Noise Ratio
In the tech world, the “gold standard” for heart rate monitoring remains the Electrocardiogram (ECG), which measures the electrical signals of the heart. While wearables are closing the gap, they face the challenge of the signal-to-noise ratio. To provide a reliable RHR, devices use complex algorithms to identify the precise moment of a “beat” amidst the chaos of daily activity.
A high-quality wearable doesn’t just give you a single number; it identifies your lowest sustained heart rate during your most immobile state—usually deep sleep. This digital “resting” state is a much more accurate representation of cardiovascular health than a manual check performed while sitting at a desk, which can be influenced by recent caffeine intake or the stress of an upcoming meeting.
Benchmarking the Numbers: What Data Science Says About a “Good” RHR
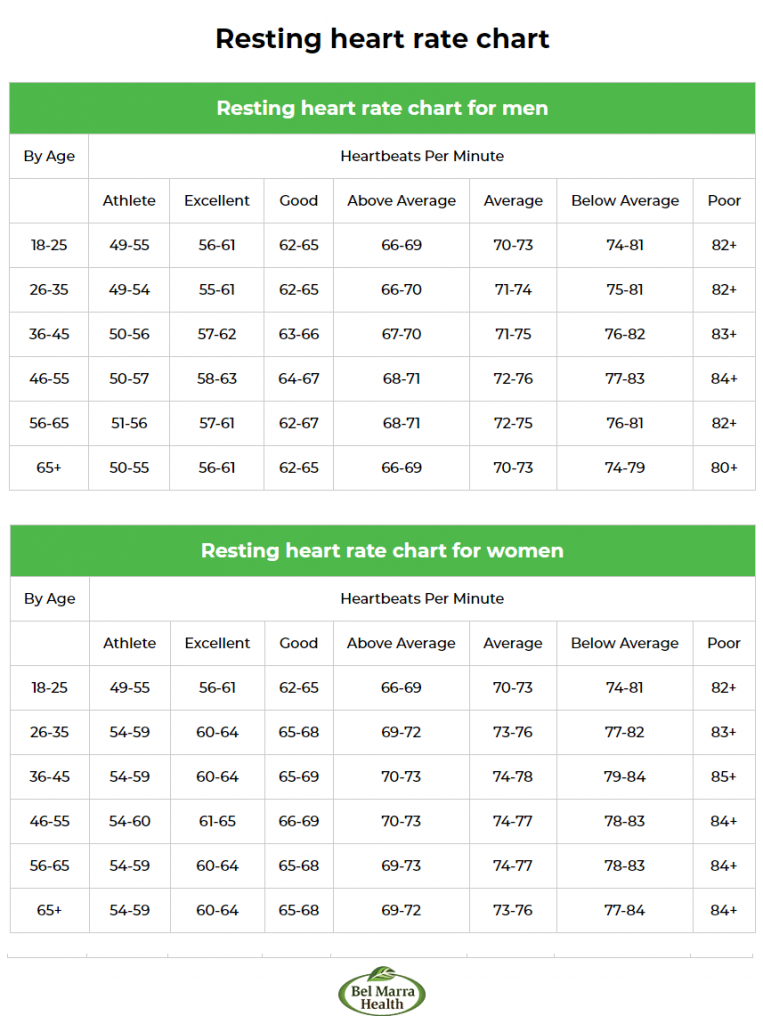
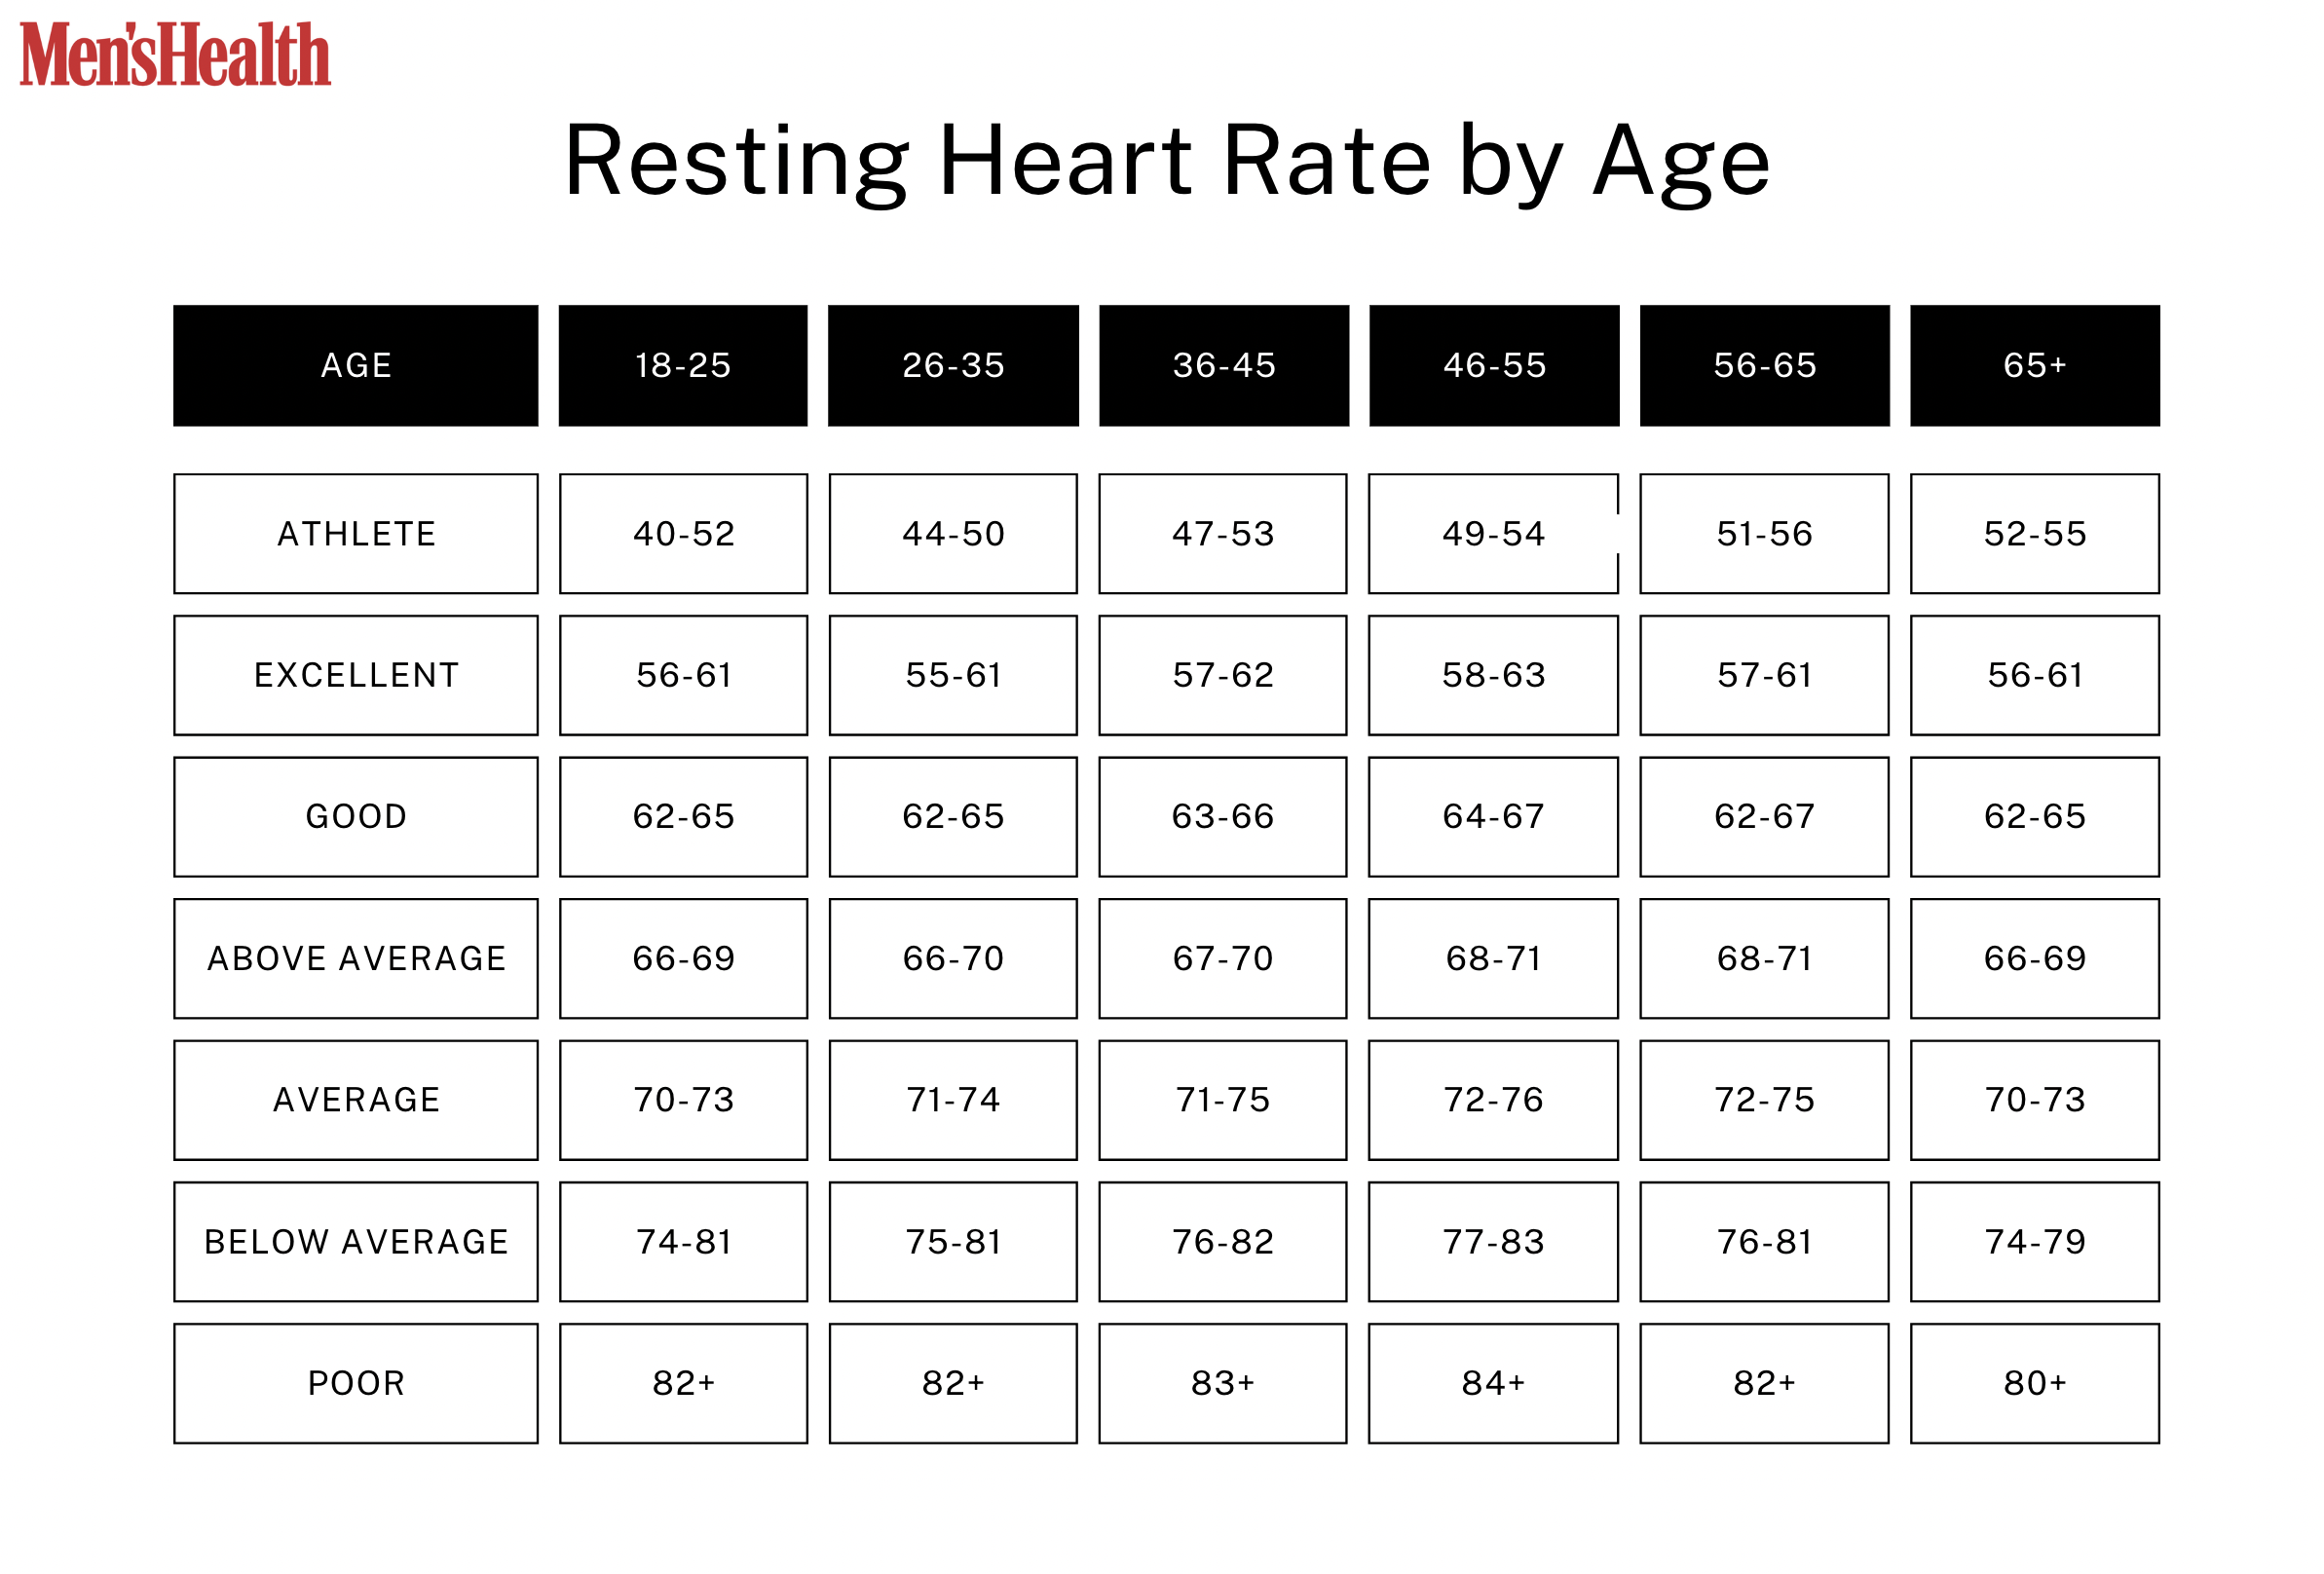
The medical community generally defines a normal resting heart rate for adults as 60 to 100 beats per minute (BPM). However, in the world of high-performance tech and data science, these broad strokes are often viewed as insufficient.
The Deviation from the Baseline
For a tech-savvy user, a “good” RHR is defined less by a universal standard and more by its relationship to an individual’s baseline. Wearable platforms like Whoop and Oura focus heavily on “baseline deviation.” If your personal average RHR is 52 BPM, a sudden jump to 58 BPM—even though it is well within the “healthy” 60-100 range—is a significant data anomaly.
This digital perspective treats the heart as a dynamic system. A “good” heart rate is one that remains stable and recovers quickly after periods of high strain. Sophisticated health dashboards now use rolling averages (often 7-day or 14-day windows) to help users identify when their RHR is trending in the right direction. A downward trend over several months is a digital confirmation of increased cardiovascular efficiency, often resulting from optimized training loads or improved sleep hygiene.
Age, Fitness, and the Algorithmic Perspective
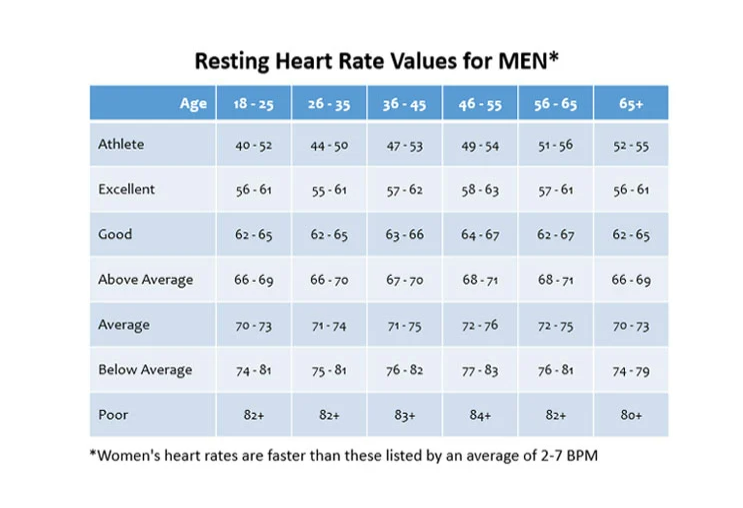
Algorithms must account for biological variables to determine what constitutes a “good” rate for a specific user. Elite athletes frequently see RHRs in the 30s or 40s—a condition known as athletic bradycardia—which would be flagged as a concern in a non-athletic context.
From a technology standpoint, the most advanced apps now categorize RHR data by age and gender percentiles. This allows a user to see not just their raw number, but where they rank in a global database of millions of other users. Being in the “top 10% for your age group” is the new digital gold standard for health, providing a more granular and competitive target than the outdated clinical range.
The Software Layer: AI, Predictive Analytics, and Recovery Scores
The real power of knowing your resting heart rate lies in how software interprets that data. We are moving past the era of descriptive analytics (what happened) and into the era of predictive and prescriptive analytics (what will happen and what you should do).
Moving Beyond the Single Metric: The RHR and HRV Relationship
In modern health tech, RHR is rarely analyzed in a vacuum. It is almost always paired with Heart Rate Variability (HRV)—the measure of the time variation between each heartbeat. While a “good” RHR is low, a “good” HRV is typically high.
Software suites use these two metrics to create “Readiness” or “Recovery” scores. If your RHR is 5 BPM higher than your average and your HRV has plummeted, the AI interprets this as a sign of autonomic nervous system stress. Whether the cause is overtraining, an impending illness, or a night of poor sleep, the technology can provide a warning before the user even feels symptomatic.
Machine Learning and Early Warning Systems
One of the most exciting frontiers in wearable tech is the use of machine learning to detect early signs of infection. Research from tech giants and academic institutions has shown that a sustained rise in resting heart rate can predict the onset of a fever or viral infection (including COVID-19 and the flu) up to 48 hours before symptoms appear.
For the user, a “good” resting heart rate is one that remains consistent with their AI-predicted model. When the data deviates from the model, the software flags it, turning the wearable from a passive monitor into a proactive health guardian. This transition from “counting steps” to “analyzing biometrics” is the defining trend of the current digital health landscape.
The Digital Health Ecosystem: Integration and Data Security
As we collect years of RHR data, the question shifts from “what is the number” to “where does the data go and how is it protected?” The integration of biometric data into the broader tech ecosystem is a double-edged sword.
The Interoperability of Health Platforms
A “good” data strategy involves interoperability. Whether you use Apple Health, Google Fit, or a proprietary platform, the ability to sync RHR data across apps is vital. This allows for “stacking” data—combining RHR with nutrition logs, meditation minutes, and workout intensity.
Advanced users are now utilizing APIs to export their RHR data into custom dashboards or even sharing it directly with their healthcare providers. This creates a longitudinal record that is far more valuable than a snapshot taken during a check-up. The technology allows for a holistic view of how lifestyle changes—such as adopting a new diet or changing a supplement regimen—directly impact the heart’s resting efficiency.
Privacy in the Age of Biometric Surveillance
The sensitivity of RHR data cannot be overstated. It is a proxy for your overall health, stress levels, and even certain lifestyle habits. As the tech industry moves toward more integrated health solutions, the security of this data becomes paramount.
Leading tech firms are implementing end-to-end encryption for health data and on-device processing to ensure that your most intimate biometrics aren’t stored in a vulnerable cloud environment. When evaluating the “tech” behind a good RHR, one must also evaluate the “security” behind the device. A good resting heart rate is of little comfort if the data used to track it is not securely handled.
Optimization Strategies: Using Tech to Lower Your Resting Heart Rate
Finally, for those looking to improve their metrics, technology offers a suite of tools designed to lower RHR over time. This is where the digital meets the physical.
Biofeedback apps use the camera on a smartphone or the sensor on a watch to guide users through breathing exercises in real-time. By watching their RHR drop on a screen as they breathe, users receive immediate positive reinforcement, training their nervous system to enter a state of calm.
Furthermore, smart home integrations are now being used to optimize RHR. Smart thermostats can lower the room temperature during sleep cycles, and smart lighting can shift to red spectrums in the evening to promote melatonin production—all of which have been shown in wearable data to correlate with a lower, healthier resting heart rate.
In conclusion, “what’s a good resting heart rate” is a question that starts with a number but ends with a complex understanding of sensor technology, algorithmic interpretation, and data-driven lifestyle optimization. In the current tech landscape, a good RHR is a baseline that reflects a body in balance, tracked by accurate hardware, analyzed by intelligent software, and protected by robust digital security. As wearables continue to evolve, our ability to interpret this single beat will remain the cornerstone of our digital health journey.
aViewFromTheCave is a participant in the Amazon Services LLC Associates Program, an affiliate advertising program designed to provide a means for sites to earn advertising fees by advertising and linking to Amazon.com. Amazon, the Amazon logo, AmazonSupply, and the AmazonSupply logo are trademarks of Amazon.com, Inc. or its affiliates. As an Amazon Associate we earn affiliate commissions from qualifying purchases.